


 Spanish (pdf)
 Article in xml format
 Article references
 Send this article by e-mail
 Cited by SciELO
  Similars in
SciELO
Similars in
SciELO 
 Permalink
Introduction
In recent decades, beekeeping in Argentina has developed an important role in agricultural production, being the country with the largest number of bee hives in the southern hemisphere. Argentina allocates 95% of its honey production to export, so it ranks the first place as an exporter and the third as a honey producer 4, 30. While beekeeping is perceived as an activity that mainly promotes honey consumption, a healthy and natural product, it is also a sustainable activity with a close relationship with the biodiversity 28.
This way, beekeeping encourages both the development of rural family agriculture, as well as regional economies. Santa Fe Province has 1419 beekeepers recorded under the National Register of Beekeeping Producers (RENAPA), with a total of 393095 bee hives registered. With an export growth of 45% between 2019 and 2020, this activity places Santa Fe in third position, after Buenos Aires and Entre Ríos province within national honey production.
Since 2016, EEA INTA Rafaela and INTA national beekeeping program has been working on Apis mellifera colonies health monitoring, studying the most important diseases associated to reduced honey production and colony losses: Varrosis and Nosemosis. Varroa destructor (Anderson & Trueman) is an obligate ectoparasite, almost cosmopolitan 30, that cause body weight loss, malformation of bees, weakening of colonies and lifespan reduction of workers bees 1,17.
Regarding nosemosis, it is caused by Nosema apis and Nosema ceranae, both species of microscoporidia found as an obligate ectoparasite of the bee gut, reducing the lifespan of their host 21. In addition, the interactive/synergism between V. destructor and Nosema sp ectoparasites has been demonstrated 25, which endanger honey bee health and promote the development of other pathogens 26.
During the last years, the role of pathogens has received increasing attention as the main cause of beekeeping activity decline and elevated colony losses. Surveillance programs based on health monitoring includes the set of activities which gather necessary information to describe the behavior and natural history of diseases, detecting and preventing changes in order to provide scientific information.
This information might be used to make a decision for disease prevention, control and/or eradication. Sentinel units (sentinel apiaries) is a well-proven strategy to get reliable information about the health status of a biological population from a sample (random or not), that allow to identify early disease cases and prevent important outbreaks.
The aim of this study was to describe and analyze the results of the first three years of a surveillance program implemented on sentinel apiaries, in order to provide information about varrosis and nosemosis regional distribution and prevalence level.
Introduction
During 2017, 2018 and 2019 a total of 49 apiaries were monitored in four different zones of Santa Fe Province: North, South, Riverside and Central. A minimum of 14 apiaries were monitored per year (confidence 95%; N=1419 apiaries and 20% of minimum expected prevalence). The zones were defined based on the nectar flow period and their beekeeping man- agement schedule, the eco-region categorization 2 and agricultural practices 18.
Every year, data about apiary size and location, along with main management practices performed in the apiary was gathered by means of questionnaire. Each apiary was visited three times per year when adult bee population, brood cells availability and food reserves of six colonies was recorded and samples for V. destructor and Nosema ceranae diagnose were taken from the same monitored colonies.
During 2017, 14 apiaries were monitored at three key moments of beekeeping production: before and after autumn acaricide treatment (45 days after application) and at the beginning of the following beekeeping season (August/September). The application of the acaricide active ingredients was registered in the four zones of Santa Fe Province (North, South, Riverside and Central). Similar to 2017, a total of 18 apiaries were monitored in 2018 and 2019 at the same moments (Table 1).
Sample collection
To determinate V. destructor infestation, during each visit among 250 bees were collected from both sides of three unsealed brood combs in a jar containing 50% ethanol and a drop of soap. The mites were separated from the bees by agitating the jar and pouring the content into a sieve with a mesh size of 2 mm 11.
Following this method, the intensity of mite infestation was calculated dividing the number of mites counted by the number of bees in the sample, to determine the proportion of infested individuals and multiplying by 100 to obtain the percentage of infestation per colony (PV). In addition, the number of bees and brood, pollen and honey cells of all colonies were estimated according to the Liebefeld method8.
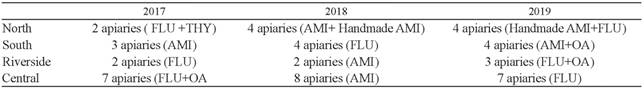
Table 1 Number of apiaries monitored and acaricide treatment application registered between 2017 and 2019 FLU: Flumethrin; AMI: Amitraz; OA: Oxalic acid; THY: Thymol

Table 2 Varroa infestation level, Nosema abundance and colony strength population monitored in the different zones, at the three sample periods during 2017 BT: before autumn Varroa treatment AT: after autumn Varroa treatment SB: spring beginning.
In order to determinate N. ceranae abundance, worker honey bee samples were collected from the hive entrance. A minimum of 60 bees were gathered and placed in labeled plastics flasks containing 60 ml of 96° of alcohol. Spore suspensions were prepared by adding 60 ml of distilled water to crushed abdomens of 60 randomly-selected individuals of each colony. Nosema sp spores/bee (transformed to log 10) were determined using light microscopy 40x and hemocytometer.
For each sample, the number of spores in 80 hemocytometer squares (5 groups of 16 squares) was counted 16. This is the most frequently used sampling method, that provides information about the number of spores per bee and can detect a 5% of infected bees with 95% of confidence 15.
Also, during each visit to the apiaries a short survey with management practices data was collected from the beekeepers. The first questionnaire (prior to autumn acaricide treatment) gathered information about: general apiary traits (geographic location and number of colonies), average honey production of the season and acaricide treatment against Varroa mites (active ingredient and treatment date).
During the following visit (45 days after acaricide treatment application) we recorded data concerning carbohydrate supply during autumn season and number of surrounding apiaries (up to 1.5 km). After winter, during the last visit we asked the beekeepers information about winter mortality and acaricide treatment against Varroa mites before spring season.
Statistical analysis
A descriptive analysis was performed in order to study disease and colony population size variation across the zones in different moments and during the studied years (2017-2019). We evaluated the association between % mite infestation and Nosema sp spore counts using Spearman correlation. Infestation levels were categorized into three levels according to the damage thresholds at low: PV<3%, mean: PV>3% - <10% and high: PV>10%.
A multinomial logistic regression model was adjusted to assess the probability of infestation percentages of hives >10% according to the sample period (before treatment, after treatment and at the beginning of the following spring), to the sample year (2017, 2018 and 2019) and to the zone (North, South, Riverside and Central). To select the adequate model, backward selection was used by comparing the nested models through the deviations obtained.
Results
The percentage of Varroa infestation in early autumn in 2017 was lower in the Riverside than the rest of the monitored zones before treatment (P=0.012; Table 2). After autumn treatment, Varroa infestation declined in North, Riverside and Central Zone, but residual mites were found in the South (P<0.001; Table 2). Similarly, an increase in Varroa levels was observed in the South Zone at spring beginning (P<0.001, Table 2).
During autumn, before and after the acaricide treatment, the South zone showed higher Nosema spore counts compared to the other zones (BT: P<0.001; AT: P<0.001). At spring beginning Riverside zone showed a significant increase as the higher spore counts were registered there. The South zone was the second most infected zone according to the spore counts (P=0.002; Table 2).
In 2018, the Central zone showed significantly more Varroa mites than the rest of the zones before acaricide treatment (P=0.003, Table 3). After autumn treatment, Varroa infestation declined in South, Riverside and Central Zone, but residual mites were found in the North (P< 0.001; Table 3). The South and Central Zone showed a slight increase in the percentage of Varoa infestation, at the beginning of the spring but not significant differences were found (P=0.131, Table 3).
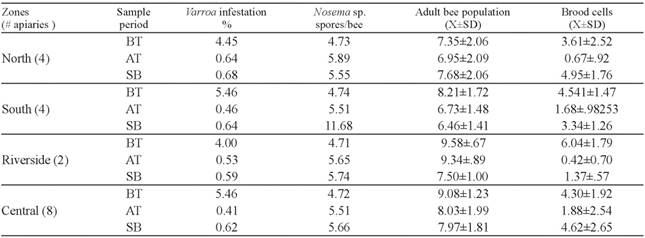
Table 3 Varroa infestation level, Nosema sp abundance and colony strength population monitored in the different zones, at the three sample periods during 2018. BT: before autumn Varroa treatment AT: after autumn Varroa treatment SB: spring beginning.
No significant differences in Nosema spore counts were found during early autumn, before acaricide treatment (P=0.121; Table 3). However, after acaricide treatment the South zone showed higher Nosema spore counts compared to the other zones (P<0.001). As we observed during 2017, at spring beginning 2018 Riverside zone showed the higher spore counts followed by the number of spores counted in the south zone (P=0.002; Table 3).
During 2019, before acaricide treatment no differences in the Varroa infestation level were found be- tween monitored zones (P=0,125). Similar to previous year, in 2019 after autumn treatment Varroa infestation declined in South, Riverside and Central Zone, but residual mites were found in the North (P<0.001; Table 4). At the beginning of the spring, the levels of Varroa infestation showed an important increase in North being higher than the infestation levels registered in the other zones (P=0.06, Table 4). During autumn, before and after the acaricide treatment, the South zone showed higher Nosema spore counts compared to the other zones (BT: P<0.013; AT: P<0.001; Table 4). However, at spring beginning no significant differences in Nosema spore counts were found infected zone according to the spore counts (P=0.06; Table 4).
On the other hand, no significant correlation was found between Nosema sp infection and Varroa infestation in all zones during the three years period (P<0.05). Both pathogens fluctuate seasonally, but Riverside and South zones showed systematically higher levels of Nosema sp spore counts than North and Central zones.
Concerning Varroa destructor dynamics, the multinomial logistic regression model selected was: Year + Period + Zone + Year*Zone + Period*Zone. In all three years significant higher Varroa levels were found be fore autumn Varroa treatment (BT period).
Also, no significant interaction was found between period and year suggesting the seasonality of the Varroa population dynamics. In contrast, considering all three years, apiaries from North and South showed higher percentages of Varroa infestation especially in the AT y SB periods.
Discussion
Since V. destructor is a main threat to honeybee colonies, this study described its geographical distribution within Santa Fe province and the association with the beekeeping management performed in the apiaries. In addition, we analyzed the relationship with Nosema presence, another potential stressor associated with colony losses.
Our results suggested that, both region and control strategies impact on Varroa infestation level during the course of the year. However, it seems that the relative importance of one or the other depend on the moment when this is observed.
The high percentages of Varroa infestation found after treatment in the south zone during 2017 (>1%) are associated with the elevated worker brood levels in BT and AT probably due to a mismanagement in the autumn carbohydrate supply. Its normally recommended to the beekeepers that if honey stores are inadequate, colonies should be fed with sucrose syrup to bring them up to a desired over wintering condition with reduced brood 12.
Despite of the use of a high efficacy acaricide on colonies (amitraz), of the availability of brood cells during autumn may contribute to high Varroa counts during late season 31. Varroa regular treatment and number of brood cells (at the time of treatment application) are key to prevent high infestation level after and before winter season.
Furthermore, some studies suggest that regions where brood rearing often continues throughout win- ter exhibit a continuous mite population growth, thus Varroa infestation will be more sever in long brood-rearing seasons than in short ones 34,35.
During the following years, Varroa infestation on adult bees showed an important increase in north zone after treatment, showing higher levels than the other zones. According to the acaricide treatment registered in this zone, it was reported the application of a homemade amitraz formulation.

Table 4 Varroa infestation level, Nosema sp abundance and colony strength population monitored in the different zones, at the three sample periods during 2019 BT: before autumn Varroa treatment AT: after autumn Varroa treatment SB: spring beginning.
It is known that beekeepers and researchers employ a variety of acaricides treatments on Varroa mites, including conventional and no conventional treatments 19,27 and that successful chemical control of Varroa in the colonies is essential in temperate climates to ensure winter survival.
However, Varroa populations are evolving resistance mechanisms to these acaricides 23 mainly due to acaricides mismanagement that results in residuals accumulations that persist in beehives products 6. In this context, home-made formulations without a known dose probably enhance contamination and resistance problems, without guaranteeing an efficient control or a higher probability for the colony to survive.
The significant interaction between brood availability and Varroa inbreeding should be considering when designing acaricide treatment concept: timing and product (29. These events observed from 2017 to 2019 emphasizes the importance of early monitoring, before and after the autumn treatment (BT-AT), when Varroa mite already reached damaging levels, especially for controlling the mite population previous to the next honey yield season5.
Furthermore, considering the association between the reduction of V. destructor population by means of treatment and samples testing negative for DWV (deformed wing virus) at late summer or early autumn 25, controlling mite infestation contribute to the control of “overt” DWV infections.
Our study is in line with previous results that has demonstrated a seasonal trend of Varroa, in response to bee dynamic population and reproduction 13. Here, the Varroa levels followed the same pattern during the three years: higher levels were found at the same period (BT), it decreased after the autumn treatment (AT) and riced again at the beginning of the season (BS), showing the absence of interaction between period*year factors.
This seasonal component is partially explained by the mite population growth during spring and summer and the brood rearing declining during early autumn, when the number of infested cells increased 9, showing a positive feedback between mite and bee populations. From the management perspective, identifying the main spread period provides useful information on the treatments timing, especially the importance of a coordinated schedule within a zone.
Temperature and nutritional status have been examined as factors that might trigger seasonal changes in worker bee’s behavior and physiology, overall colony health and its response to mite infestation 13. In addition, several Varroa mite mitigation strategies, especially organic products, are strongly dependent on ambient temperature and humidity 32.
It is known that a temperature rise after winter pro duces an increment in the colony activity, and consequently in Varroa levels 20 . Also, once temperatures are high, the diversity of the floral resources influences bee health and foraging behavior 33. This nutritional need of colonies, which includes quality and quantity of nectar and pollen resources, and its strong relationship with immunity is compromised when colonizes are parasitized by Varroa10.
Therefore, the seasonality of Varroa infestation levels arise from a complex interaction between beekeeping management (particularly control strategies) and regional environmental drivers than shape the observed pattern. It is known that Varroa mite infestation contribute to nosemosis development due to parasite interaction 22,24.
Infection with Nosema sp may negatively affect the behavior of worker bees and consequently, Varroa hygiene may be lower in colonies affected by nosemosis7. Additionally, a negative effect of Nosema infection on acaricide treatment efficacy was reported as well as on honeybee defense capability against V. destructor3.
In our study we found no correlation between Varroa mites and Nosema sp development. Previous studies reported no apparent relationship between these pathogens, being this association frequently observed in collapsing colonies 14.
Thus, our hypothesis is that an association between both pathogens was not found because we did not observe collapsing colonies, mainly due to that colonies were infected with lower levels of Varroa. It is suggest- ed a leading role of V. destructor with the subsequent appearance of Nosemosis disease and Viruses infection over the viability of the colonies. These results could relegate Nosema sp to be an opportunistic agent, with a secondary role concerning colony health status.
Apis mellifera colonies surveillance program by means of sentinel apiaries was effective in monitoring and remedying the level of two of the most important pathogens associated with colony health condition, Varroa destructor and Nosema sp.
Additionally, the geographical distribution and the data collected from the beekeepers regarding management strategies allowed us to describe and explain how these drivers impact on disease dynamics and apicultural production.

