


 English (pdf)
 Article in xml format
 Article references
 Send this article by e-mail
 Cited by SciELO
  Similars in
SciELO
Similars in
SciELO  uBio
uBio 
 Permalink
Background
Nephrotoxicity is an important clinical com-plication of snakebite by crotalid and viperid snakes (Warrell 2004; Sitprija 2006; Albuquer-que et al. 2013, Gutiérrez et al. 2017; Albuquer-que et al. 2020) and is frequently characterized by a combination of acute tubular necrosis, acute tubulointerstitial nephritis, renal cortical necrosis, mesangiolysis, vasculitis, glomerulo-nephritis, proteinuria, hematuria, and myoglo-binuria (Sitprija 2006, 2008), as well as altera-tions in renal ion transport (Sitprija and Sitprija, 2016). The high vascularization of the kidneys and their involvement in blood filtration and the excretion of endogenous and xenobiotic substancies makes these organs particularly prone to the actions of circulating snake venoms and their toxins (Sitprija 2006, 2008; Sanhajariya et al. 2018).
In Brazil, most cases of snakebite-induced acute kidney injury (AKI) result from envenom-ation by lanceheads (Bothrops spp.) and the South American rattlesnake (Crotalus durissus terrificus = C. d. terrificus) (Pinho et al. 2008; Rodrigues Sgrignolli et al. 2011; Berger et al. 2012; Albuquerque et al. 2013). Although Bothrops spp. are responsible for 87% of the bites by venomous snakes in this country compared to 9% by C. d. terrificus (data for the period 2001-2014), the overall mortality associated with the latter species is 2.6-fold greater than with the former genus (0.97% vs. 0.37%) (SIN-AN 2019). The greater lethality associated with envenomation by C. d. terrificus has been at-tributed primarily to its high content of crotox-in, a phospholipase A (PLA2) p-neurotoxin that accounts for ~50% of the venom dry weight (Hadler and Vital Brazil 1966; Sampaio et al. 2010).
Snake venom PLA display a variety of activi-ties, such as presynaptic neurotoxicity, myone-crosis, edema formation, cardiotoxicity, antico-agulant activity, activation/inhibition of platelet aggregation, hemorrhage, hemolysis and cy-totoxicity (Kini 2003; Harris and Scott-Davery 2013). Most of these effects reflect the PLA2-mediated hydrolysis of cell membrane phos-pholipids to release arachidonic acid that can be oxidized to generate reactive oxygen species (ROS) that in turn produce lipid peroxides, leading to cellular injury (Spiteller et al. 2001; Kini 2003; Teixeira et al. 2003).
Human envenomation by C. d. terrificus is characterized by peripheral neurotoxicity (palpebral ptosis, external ophthalmoplegia and facial weakness that produce ‘myasthenic facies’, generalized muscle weakness, mydriasis and, rarely, respiratory failure requiring mechanical ventilation), systemic myonecrosis (rhabdomy-olysis, with a marked increase in serum myo-globin and creatine kinase, and myoglobinuria, as well as generalized myalgia), coagulopathy (afibrinogenemia leading to prolonged clotting time with no thrombocytopenia), and AKI, with little or no local manifestations such as hemorrhage, edema or necrosis at the bite site (pain related to traumatism caused by the bite may be present but is soon followed by paresthe-sia and anesthesia) (Amorim and Mello 1954; Rosenfeld 1971; Azevedo-Marques et al. 1985, 1987; Silveira and Nishioka 1992; Sano-Mar-tins et al. 2001; Bucaretchi et al. 2002; Warrell 2004; Pinho et al. 2005; Berger et al. 2012; Fra-re et al. 2019; Medeiros et al. 2020). AKI is the major clinical complication and the principal cause of death in individuals who survive the severe initial phase of envenomation (Pinho et al. 2005; Frare et al. 2019).
Although the clinical profile of AKI induced by C. d. terrificus venom in humans has been ex-tensively studied, with an important mechanism of kidney damage being the renal deposition of myoglobin released by the rhabdomyolytic ac-tivity of the venom (Rosenfeld 1971; Azevedo-Marques et al. 1985, 1987; Silveira and Nish-ioka 1992; Bucaretchi et al. 2002; Warrell 2004; Pinho et al. 2005; Albuquerque et al. 2013; Fra-re et al. 2019), relatively few experimental stud-ies have investigated the mechanisms involved in this phenomenon. The renal lesions caused by this venom in humans can be reproduced to varying extents in dogs (Sangiorgio et al. 2008) and mice (Frezzatti and Silveira 2011). In mice, C. d. terrificus venom causes renal dysfunction and oxidative stress (Yamasaki et al. 2008) that can be attenuated to varying extents by com-pounds such as lipoic acid (Alegre et al. 2010), allopurinol (Frezzatti and Silveira 2011), and N-acetyl-L-cysteine (Barone et al. 2014). The renal functional alterations seen after enven-omation may be mediated directly by venom components such as crotoxin/PLA (Monteiro et al. 2001; Amora et al. 2008) or indirectly by mediators released by cells such as macro-phages exposed to the venom (Martins et al. 2003; Cruz et al. 2005).
Physiological and pathophysiological studies have shown that rats respond more like hu-mans than do mice and has led to the extensive use of these rodents as a model for investigat-ing normal and diseased states (National Human Genome Research Institute 2004), but no reports have examined the response to C. d. terrificus venom in this species. Hence, in this work, we examined the ability of C. d. terrificus venom to induce AKI after intraperitoneal (i.p.) injection in rats as a potentially useful model for the experimental evaluation of new therapeutic strategies to treat systemic envenomation.
We assessed AKI 2 h after venom injection to simulate the time interval between envenom-ation and seeking medical assistance in the clinical setting, including antivenom administraron [mean interval of 3 h, according to Pinho et al. (2005)]. The occurrence of AKI was consid-ered a positive confirmation of envenomation, and several other biochemical, hematological, and histological parameters were monitored to assess the extent of renal damage. We also examined the ability of antivenom given i.p. 2 h post-venom to rescue rats from the lethal ef-fects of the venom and to attenuate the renal functional alterations associated with AKI.
Methods
Animals
Standard laboratory practices for animal care were followed according to the Guide for the Care and Use of Laboratory Animals (National Research Council of the National Academies 2011) and the Animal Research: Reporting of In vivo Experiments (ARRIVE) guidelines (Kilkenny et al. 2010). The experimental protocols were approved by the institutional Committee for the Care and Use of Experimental Animals at the University of Sorocaba (protocol no. 031/2014). Male Wistar rats (Rattus norvegicus) (290-400 g; 3-6 months old) purchased from the Central Animal Facility of the Institute of Biomedical Sciences of the University of Sao Paulo (Sao Paulo, SP, Brazil) were housed (3 rats/plas-tic cage on a wood shavings substrate) at the University of Sorocaba animal facility at 22 ± 3 oC and 50 ± 5% humidity on a 12 h light/dark cycle (lights on at 6 a.m.), with access to food and water ad libitum.
Venom
Crotalus d. terrificus venom was collected manually from 20 male and female young adult snakes (200-400 g, ~2 years-old) captured in the Paraiba Valley close to the city of Sao José dos Campos (23° 11’ 0” S; 45° 53’ 0” W) and kept in the serpentarium of the Center for Na-ture Studies (under Environmental Secretariat License SMA 15.380/2012) at the University of Vale do Paraiba (UNIVAP, Sao José dos Campos, SP, Brazil). The use of the venom was reg-istered with the Brazilian National System for the Management of Genetic Patrimony and Associated Traditional Knowledge (SISGEN, registration no. ACB5FCO). The venom was ly-ophilized and stored at 4-8 °C until used.
Antivenom
Therapeutic crotalic antivenom raised against C. d. terrificus venom (lot 135202/I, expiry date for human use: October 2016) produced by the Instituto Vital Brazil (Rio de Janeiro, RJ, Brazil) was kindly donated by the Escritorio Regional de Saúde (ERSA) in Piracicaba, SP, Brazil. Al-though the antivenom was used beyond the expiry date for human use, the solution nev-ertheless conserved the macroscopic proper-ties generally considered to be indicative of quality maintenance, i.e., lack of turbidity and no formation of precipitates. Indeed, previous studies have demonstrated the usefulness of antivenoms beyond their formal expiry dates (O'Leary et al. 2009; Sánchez et al. 2019; Tan et al. 2019). The dose of antivenom was calcu-lated based on the manufactureras stated po-tency in which 1 mL of antivenom neutralizes the lethality of 1.5 mg of reference C. durissus ssp. venom in mice.
In vivo protocols
All rats were anesthetized i.p. (always on the left side) using a schedule based on the Guide for the Care and Use of Laboratory Animals. The anesthetic mixture consisted of xylazine (10 mg kg-1) and ketamine (10 mg kg-1) (both purchased from Ceva®, Paulínia, SP, Brazil), with midazolam (1 mg kg-1) being used for ini-tial sedation (before venom administration) and tramadol (5 mg kg-1) as an analgesic (both from Medley®, Campinas, SP, Brazil) administered soon after venom injection.
Urine, blood, and renal tissue samples were collected at death (with venom alone, ~8.2 h post-venom; see later) or 2 h or 24 h post-ven-om when the rats were killed with an overdose of isoflurane (Cristália®, Itapira, SP, Brazil). He-matological (leukocytes, platelets, and erythro-cytes) and biochemical (protein, creatinine, and urea) parameters were determined in blood and urine, whereas blood and renal tissue samples were used to evaluate oxidative stress markers (glutathione - GSH, glutathione peroxidase -GPx, catalase - CAT, thiobarbituric acid reactive substances - TBARS). Alterations in renal morphology were analyzed by light microscopy. In a preliminary set of experiments, rats were injected with different doses of C. d. terrificus venom (5, 6, 7.5, and 10 mg kg-1, i.p.; one dose per rat, n=3 rats/dose, a total of 12 animals) to determine an appropriate minimal venom dose able to induce AKI. The venom was injected in a volume of 0.5 mL, which is considerably less than the volume of 10 mL kg-1 recommended elsewhere (Morton et al. 2001), and the venom dose of 6 mg kg-1 was selected based on a marked increase in blood urea and creatinine concentrations. These biomarkers are fre-quently used as indicators of renal dysfunction because they reflect a decrease in the glomeru-lar filtration rate in response to renal alterations (Sato 2012). The rats were randomly distrib-uted into five groups (n=5/group; total N = 25 rats), as follows: Group 1 (G1) - Saline (sham) control (n=5): Rats received 0.5 mL of sterile phosphate-buffered saline (PBS, i.p.) and were killed 2 h later with an overdose of isoflurane for blood and tissue sample collection; Group 2 (G2; n=5) - rats were injected with C. d. terrificus venom (6 mg kg-1, i.p.) and killed 2 h later with an overdose of isoflurane for blood and tissue sample collection. Pharmacokineti-cally, this 2 h interval provided sufficient time for the absorption and diffusion of the venom and its main toxin, crotoxin, from the site of ap-plication (Barral-Netto and von Sohsten 1991; Cura et al. 2002), with subsequent binding to the presynaptic terminations of striated muscle (Cura et al. 2002); Group 3 (G3) - Assessment of survival time (n=5): Rats were injected with venom (6 mg kg-1, i.p.) and 2 h later received PBS (0.5 mL, i.p., n=5) after which they were monitored until imminent death when blood and tissue samples were collected; the rats in this group survived for 8.2 ± 1.6 h. Group 4 (G4) - C. d. terrificus venom followed by antivenom (n=5): Rats were injected with venom (6 mg kg-1, i.p.) and 2 h later they received crotalic antivenom (from 1.3 to 1.9 mL, i.p.; 1 mL of antivenom neutralizes 1.5 mg of C. d. terrificus reference venom, according to the manufacturer) in a rescue model conceptualized by Baudou et al. (2017); blood and tissue samples were collected 24 h after venom injection (22 h af-ter antivenom). Group 5 (G5) - PBS followed by antivenom (n=5): Rats were injected with PBS (0.5 mL, i.p.) and 2 h later they received crotalic antivenom i.p. (the same volume as in group G4); blood and tissue samples were collected 24 h after PBS injection (22 h after antivenom). The rats in groups G4 and G5 were killed with an overdose of isoflurane before blood and tis-sue sample collection.
Groups G1-G5 were all injected with PBS, venom, or antivenom on the right side. Figure 1 shows the experimental schedule described above.
Hematological parameters Blood samples were collected in polypropyl-ene tubes (Injex® Indústria Cirúrgica Ltda., Ourinhos, SP, Brazil) containing ethylenediami-netetraacetic acid tripotassium salt (EDTA). Total leukocyte, platelet and erythrocyte counts were determined in triplicate per sample using a Sysmex XS 1000i™ Hematology Analyzer (Roche, Basel, Switzerland). Whole blood samples (~20 pL) were injected into the analyzer and platelets and erythrocytes were counted using an impedance detection method com-bined with hydrodynamic focusing technology (Yoshida et al. 2020). Leukocytes were counted using fluorescent flow cytometry.
Assessment of oxidative stress Glutathione (GSH) was determined by sulfhy-dryl (SH) quantification using the Ellman meth-od (Ellman 1959). Briefly, 100 pL of Triton X-100 was added to 150 pL of blood followed by 100 pL of 10% trichloroacetic acid (TCA). After centrifugaron (5,000 rpm, 10 min, 4 oC) the super-natant was diluted in 1 M phosphate buffer (pH 7.4) and an aliquot was subsequently mixed with 10 mM 5,5'-dithiobis(2-nitrobenzoic acid) (DTNB) to yield a yellow complex, the absor-bance of which was read at 412 nm. A similar procedure was used for renal tissue homoge-nates in which 250 mg of tissue was suspended in 5 mL of 0.15 mM KCl and homogenized with an ultrasonic tissue homogenizer in an ice bath. Thereafter, 600 pL of homogenate was mixed with 100 pL of TCA, centrifuged, and an aliquot of 250 pL was diluted in PBS and mixed with 10 mM DTNB. The GSH concentraron was expressed in mM for blood or mmol g-1 for tissue.
Glutathione peroxidase (GPx) activity was as-sayed according to Paglia and Valentine (1967). Briefly, 10 pL of diluted blood was mixed with 390 pL of 100 mM potassium phosphate buffer, pH 7, containing 1 mM GSH, 0.1 U of GSH-reductase/mL, 0.15 mM nicotinamide adenine dinucleotide phosphate (NADPH), 1.25 mM so-dium azide and 100 pL of 0.4 mM hydrogen per-oxide (H2O2). Tissue samples were processed as described in the preceding paragraph. GPx activity was monitored as the decay in NADPH absorbance (greater activity = greater decay) for 2 min at 340 nm and was expressed in pmol NADPH min-1 g-1 of hemoglobin (Hb) for blood, or nmol NADPH min-1 g-1 of tissue.
Catalase (CAT) activity was assayed according to Aebi (1984). Briefly, 10 pL of blood was diluted in 590 pL of 50 mM potassium phosphate buffer, pH 7. A 20 pL aliquot was mixed with 70 pL of H2O2 to start the reaction and the enzymatic decomposition of H2O2 by CAT was monitored for 3 min at 240 nm. The reaction was run at 25 °C. A similar procedure was used for tissue homogenates prepared as described above. Enzyme activity was expressed as k min-1 g-1 of Hb for blood or k min-1 g-1 of tissue, where k is a rate constant.
Lipid peroxidation was assessed by quantifying thiobarbituric acid reactive substances (TBARS) according to Ohkawa et al. (1979). Briefly, 150 pL of plasma was mixed with 50 pL of 3 M NaOH and incubated at 60 oC for 30 min. This step was followed by the addition of 250 pL of 6% H3PO4, 250 pL of 0.8% thiobarbituric acid (TBA), and 100 pL of 10% sodium dodecyl sulfate (SDS) followed by incubation at 80 oC for 60 min. A similar procedure was used for tissue homogenates prepared as described above. Thereafter, 250 pL of the homogenate was mixed with 1.5 mL of 6% H3PO4, 500 pL of 0.8% TBA and 100 pL of 10% SDS. The reaction between lipid peroxidation products and TBA results in a pink/rose-colored compound detected spectro-photometrically at 532 nm. The results were expressed as TBARS concentration in pmol mL-1 of plasma or pmol g-1 of tissue.
Biochemical parameters The biochemical parameters of renal function were assessed using commercial ready-to-use kits for spectrophotometric assays purchased from Bioclin® (Belo Horizonte, MG, Brazil) or Labtest® (Lagoa Santa, MG, Brazil). Total pro-tein (biuret method; 545 nm), urea (urease method; 600 nm) and creatinine (alkaline pic-rate method; 510 nm) were evaluated in blood samples; urinary protein was quantified by the pyrogallol red method (600 nm), while urinary urea and creatinine were assayed with the same kits as used for blood samples. Control serum (Biocontrol N, normal) was used as an internal control and yielded the following val-ues: protein = 5.3 g dL-1 (normal range values (NRV) provided by the manufacturer: 4.7-5.9 g dL-1), urea = 16.0 mg dL-1 (NRV: 12.0-20.0 mg dL-1) and creatinine =1.43 mg dL-1 (NRV: 1.141.72 mg dL-1).
Histological analysis of renal tissue At the end of the experiments, the kidneys from groups G1-G5 (n=5/group) were excised, washed in physiological solution, and imme-diately fixed in 10% buffered formalin solu-tion for 24 h at room temperature. The kidneys were then sectioned sagittally and immersed in 70% ethanol until histological processing us-ing standard procedures for dehydration and embedding in paraffin. Sections (4 pm thick) were mounted on slides, dewaxed, cleared in xylene, and hydrated in running tap water, af-ter which they were double-stained with hema-toxylin-eosin (H&E) and examined with a light microscope (Olympus CBA, Tokyo, Japan). The slides from each group were examined for venom-induced alterations to the following structures: the glomeruli (hypercellularity due to mesangial proliferation and/or invasion, di-lation of glomerular capillaries to form micro-aneurysms), tubules (loss of brush border, oc-currence of cell swelling, hydropic alterations, presence of luminal cell casts), interstitium (medullary or cortical proliferation and/or loss of interstitium) and vessels (congestion, partic-ularly in the arterioles). The potential protective effects of crotalic antivenom on renal morphol-ogy were also assessed. Representative histological fields from each group were captured using a digital 16-megapixel camera, with a 10x objective for a panoramic overview (1 cm = 20 pm) and a 40X objective (1 cm = 40 pm) for a detailed view.

Figure 1: Experimental timeline for induction of AKI with C. d. terrificus venom (6 mg kg-1, i.p.) and subsequent treatments. AKI, acute kidney injury; Antivenom, crotalic antivenom; PBS, phosphate-buffered saline.
The observational frequency of such alterations ranged arbitrarily from 0 to 6, with 0-1 representing the absence or presence of few alterations (the latter mainly due to tissue ma-nipulation), 2-3 indicating a moderate number of alterations, and 5-6 representing a high frequency of morphological alterations.
Data analysis
All numerical parameters were expressed as the mean ± SD. Statistical comparisons among the experimental groups were done using one-way ANOVA followed by the Tukey-Kramer multiple comparisons test, with p<0.05 indicating sig-nificance in all cases. The normality of the data was assessed using the Shapiro-Wilk test prior to the statistical comparisons. All data analy-ses were done using Origin© v.8.0 (OriginLab Corporation, Northampton, MA, USA) or Sta-tistica v.8.0 (Dell, Round Rock, TX, USA).
Results and discussion
Crotalus d. terrificus venom induces AKI in hu-mans (Warrell 2004; Pinho et al. 2005, 2008; Albuquerque et al. 2013) and experimental animals such as mice (Yamasaki et al. 2008); venom-induced renal lesions have also been reported in dogs (Frezzatti and Silveira 2011), although this species is resistant to AKI (Sousa-e-Silva et al. 2003). Whereas the venom of C. d. terrificus and related subspecies causes func-tional and histological alterations in rat isolated perfused kidneys (Monteiro et al. 2001; Amora et al. 2008), the renal effects of C. d. terrificus venom in vivo in rats have not been investigat-ed, in contrast to Bothrops venoms (Boer-Lima et al. 1999, 2002; Linardi et al. 2011; Gois et al. 2017; Yoshida et al. 2020). In this work, we examined the ability of C. d. terrificus venom injected i.p. to induce AKI in rats and the ability of antivenom to protect against this dam-age. We also assessed the potential changes in several renal biochemical, hematological, and histological parameters in response to the venom. Although not the normal or usual route of venom inoculation during a ‘natural’ bite, at least in humans, i.p. injection of venom could potentially occur in rodent prey bitten by snakes with long fangs. Since there have been no experimental studies of AKI induced by C. d. terrificus venom in rats we chose to use this route of administration because we had used it in an earlier investigation of AKI caused by Bothrops jararaca venom (Yoshida et al. 2020). The results of this study show that venom injected i.p. was able to cause AKI and that this could be a suitable model for studying venom-induced renal damage.
Biochemical parameters Rats injected with venom (groups G2 and G3, but especially G3) showed an increase in the blood (Fig. 2A,C) and urine (Fig. 2B,D) con-centrations of urea and creatinine compared to rats injected with saline alone (control, G1), a finding compatible with the development of AKI. The persistent elevation in blood urea and creatinine concentrations for up to 7.2 h indi-cated sustained and worsening renal damage after venom injection. Increases in urea and creatinine are standard criteria for defining and monitoring the progression of AKI (Mehta et al. 2007; Cerdá et al. 2008) but are considered by some to be insensitive, nonspecific, and of limited usefulness for the early detection of AKI (Vaidya et al. 2008). Although blood pro-tein concentrations were generally unaltered (Fig. 2E), proteinuria indicative of defective glomerular filtration was observed (Fig. 2F). Renal proteinuria is a common indicator of AKI and is frequently seen after snakebites (Sitprija 2006), including by C. d. terrificus in humans (Pinho et al. 2005), dogs (Sousa-e-Silva et al. 2003), as well as rats (as shown here; Fig. 2F).

Figure 2: Urea, creatinine, and protein concentrations in blood (A, C, and E, respectively) and urine (B, D, and F, respectively) in rats injected with phosphate-buffered saline (PBS; G1), C. d. terrificus venom (6 mg kg-1, i.p.; G2 - analyzed 2 h post-venom; G3 - analyzed 7.2 h post-venom), venom + C. d. terrificus antivenom (G4, analyzed 24 h post-venom) and antivenom alone (G5 -24 h after antivenom). In groups G4 and G5, antivenom was administered 2 h after the injection of venom (G4) or PBS (G5). The antivenom:venom ratio used was based on the manufacturer's recommended ratio in which 1 mL of antivenom neutralizes the lethality of 1.5 mg of reference C. durissus ssp. venom in mice. The columns represent the mean ± SD (n=3-5/group). p<0.05 compared to G1(*), G2(#), G3(@), and G4(&).
Antivenom administered 2 h after venom was effective in preventing the increase in blood urea and renal proteinuria (Fig. 2A,F), but failed to prevent the changes in the other blood and urinary biochemical parameters (Fig. 2B-E). Most of these alterations are likely mediated by crotoxin that is rapidly cleared from the circu-lation in mice (Barral-Netto and von Sohsten, 1991) and Amaral et al. (1997) reported that C. d. terrificus venom and crotoxin were un-detectable in most of their patients who were treated >8 h post-bite, and that crotoxin was undetectable in most patients by 4-8 h after being bitten. A kinetic analysis has shown that in humans crotoxin has a distribution half-life of 22 min and a terminal elimination half-life of 5.2 h (Cura et al. 2002). As shown here, by 2 h post-venom, when a considerable propor-tion of the crotoxin would have been distrib-uted and bound to tissues, antivenom still of-fered some protection against the deleterious effects of the venom. The time interval of 2 h after venom injection used here was chosen to simulate the delay seen clinically between envenomation and treatment since in humans the mean interval between these events is ~3 h and antivenom is frequently given at post-envenomation intervals that are considerably greater than that used here (Bucaretchi et al. 2002; Pinho et al. 2005).
The lack of protection by antivenom against certain venom-induced alterations may reflect the availability of a less than optimal amount of antivenom to neutralize that particular effect, even though the antivenom:venom ratio used was that recommended by the manufacturer; poor neutralization because of a suboptimal amount of antivenom has also been noted by others (Baudou et al. 2017).
Crotalic antivenom did not prevent the venom-induced increase in urinary creatinine, but instead markedly enhanced the level of this marker (~10-fold increase compared to saline control in G1 and ~5-fold increase compared to G3; Fig. 2D). The marked elevation in creatinine in this group 22 h after antivenom administraron was possibly related to venom-induced muscle damage (rhabdomyolysis), with the re-sulting myoglobinuria contributing to the devel-opment of AKI (Azevedo-Marques et al. 1985, 1987; Nogueira and Sakate 2006).
Creatinine, an uncharged endogenous sub-stance (113 kDa) that is not bound to serum proteins, is generated from the nonenzymatic conversion of creatine and creatine phosphate, 95% of which is found in muscle (Thong-prayoon et al. 2016). As shown here, antivenom alone increased the creatinine concentration in blood and urine after 22 h (Fig. 2C,D), although the increase in urine was less than in G4 rats. One possible explanation for the antivenom-induced increase in serum creatinine could be related to changes in creatinine kinetics (in this case enhanced elimination) resulting from alterations to the glomerular filtration rate (GFR), as occurs in paraquat poisoning (Mohamed et al. 2015). This finding suggests that the increase in creatinine concentrations in G4 rats treated with antivenom should not be attribut-ed entirely to C. d. terrificus venom. In contrast to this effect, antivenom alone (G5) reduced the proteinuria to below the baseline concentration in G1 (Fig. 2F). This change had minimal effect on the creatinine concentration because creatinine shows little tendency to bind other proteins.
Oxidative stress parameters The antioxidant system of tissues, which con-sists of a series of enzymes and small mol-ecules, provides an effective defense mecha-nism against renal damage by xenobiotics by delaying or inhibiting the oxidation of sub-strates and the generation of damaging reactive oxygen species (ROS) (Ferreira and Mat-subara 1997). An increase in antioxidant en-zyme activity generally has a protective effect whereas a decrease can lead to renal damage. Given the physiological importance of anti-oxidant mechanisms in tissue protection and the fact that lipid peroxidation, one of the first events in oxidative damage initiated by ROS, has been implicated in snake venom toxicity (Santosh et al. 2013), we examined the chang-es in lipid peroxidation (TBARS) and oxidative stress (GSH, GPx and CAT activity) in blood and renal tissue of rats injected with C. d. ter-rificus venom and the ability of crotalic antive-nom to protect against these alterations.
Lipid peroxidation is a free radical-mediated chain of reactions that results in the oxidation of polyunsaturated lipids (Hampel et al. 2016), leading to the damage of membrane lipids and the attenuation of cell and tissue viability (Mylo-nas and Kouretas 1999). Figure 3A,B shows that 2 h post-venom (G2) there was no relevant increase in blood TBARS, whereas shortly before death (~8 h post-venom) TBARS had increased by approximately two-fold; there was no signif-icant change in the TBARS levels in urine. This finding that TBARS increased in G3 but not in G2 indicated that lipid peroxidation was a late event and agrees with previous studies show-ing that C. d. terrificus venom and some of its components cause lipid peroxidation in other tissues (Silva et al. 2011; Gongalves et al. 2014; Toyama et al. 2019). Treatment with antivenom 2 h post-venom did not attenuate the venom-induced increase in TBARS, possibly because antivenom alone also caused some lipid peroxidation.
Glutathione, which exists in reduced (GSH) or oxidized (GSSG) states, is one of the most im-portant ROS scavengers (Halliwell and Gutter-idge 1999) and increases in GSH levels have been observed in patients with chronic renal failure, possibly as a compensatory protec-tive mechanism to deal with the oxidative imbalance produced by kidney disease (Lucchi et al. 2005). As shown here, there was only a small increase in blood GSH in response to venom alone after 2 h and ~8 h (Fig. 3C,D) but a marked increase in renal GSH after 2 h (G2) that returned to normal after ~8 h (G3). Treatment with antivenom (G4) attenuated the small increase in blood GSH seen with venom alone after ~8 h but did not markedly affect the renal levels of GSH. Antivenom alone (G5) slightly reduced the concentration of circulating (blood) GSH but increased the renal content of GSH. Glutathione peroxidase (GPx) is a selenium-containing antioxidant enzyme that reduces H2O2 to water and lipid peroxides to lipid alco-hols. In the absence of adequate GPx activity or GSH levels, hydrogen and lipid peroxides are not detoxified and are converted to OH- and lipid peroxyl radicals, respectively, by transi-tion metals (Fe2+) (Tabet and Touyz 2007). GPx oxidizes glutathione to glutathione disulfide in the cytosol, mitochondria, and a small percent-age of the endoplasmic reticulum of mamma-lian tissues (Lu 2013). Glutathione is released as reduced GSH to extracellular spaces, in-cluding blood plasma, epithelial lining fluids, and exocrine secretions (Ballatori et al. 2009) in response to physiological disturbances. The GSH/GPx system thus acts as a buffer to pro-tect crucial proteins against modifications in-duced by rOs (Chen et al. 2015).
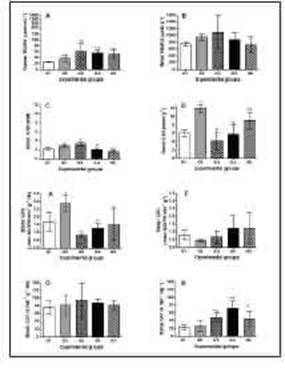
Figure 3: Oxidative stress biomarkers (TBARS, GSH, GPx, and CAT) in blood (A, C, E, and G, respectively) and urine (B, D, F and H, respectively) of rats injected with phosphate-buffered saline (PBS; G1), C. d. terrificus venom (6 mg kg-1, i.p.; G2 - analyzed 2 h post-venom, G3 - analyzed 7.2 h post-venom), venom + C. d. terrificus antivenom (G4, analyzed 24 h post-venom) and antivenom alone (G5 - 24 h after antivenom). In groups G4 and G5, antivenom was administered 2 h after the injection of venom (G4) or PBS (G5). The antivenom:venom ratio used was based on the manufacturera recommended ratio as defined in the legend of Figure 2. The columns represent the mean ± SD (n=5/group). *#p<0.05 indicate differences compared to G1(*) or G2(#). CAT, catalase; GPx, glutathione peroxidase; GSH, glutathione; TBARS, thiobarbituric acid reactive substances.
Venom caused an increase in blood GPx activ-ity after 2 h but this returned to below saline (control) levels after ~8 h (Fig. 3E). Antivenom did not markedly alter the response to venom (G4) compared to that seen in G3, nor did antivenom alone have a relevant effect on GPx activity. There were no marked venom-induced alterations in renal GPx activity after 2 h and ~8 h with venom alone, or after treatment with antivenom (Fig. 3F).
CAT is an enzyme located in peroxisomes that converts H2O2 to water and oxygen (Weydert and Cullen 2010). Neither venom nor antivenom (in the absence or presence of venom) markedly affected the blood CAT activity (Fig. 3G), but there was a venom-induced increase in the activity of this enzyme in renal tissue after ~8 h that was not attenuated by antivenom; an-tivenom alone increased the renal CAT activity to a level like venom alone (Fig. 3H). Indeed, antivenom alone (G5) enhanced the levels of several parameters, particularly blood and uri-nary creatinine, and to a lesser extent, renal GSH, blood TBARS and renal CAT in relation to saline-treated (control) rats but reduced the level of blood GSH and renal proteinuria.
These findings suggest that antivenom alone can alter the redox status in blood and renal tissue by mechanisms that could involve the activation of defense pathways against horse immunoglobulins (Bahrami et al. 2016) and an adverse reaction to antivenom (Silva et al. 2015). Adverse reactions to snake antivenom include both acute (anaphylatic or pyrogenic) and delayed (serum sickness type) reactions (León et al. 2013; de Silva et al. 2016; Negrin et al. 2021), but no reports have described such reactions in response to the i.p. injection of antivenom in rats. Intraperitoneal injection is con-sidered a safe route of administration (Guarni-eri 2016; Al Shoyaib et al. 2019), but no studies have reported on the renal responses to cro-talic antivenom alone, such as done here. The i.p. administration of bothropic antivenom in rats resulted in proteinuria (Yoshida et al. 2020), one of the earliest signs of renal diseases and indicative of glomerular damage (Gowda et al. 2010). Thus, it is possible the potential effect of antivenom itself on a variety of parameters may have been masked by the concomitant admin-istration of venom in studies that did not include an experimental group with antivenom alone. An additional source of interference could be the phenol used as a preservative in antivenom solutions since this chemical can impair leuko-cyte-endothelial interactions in vivo (Zychar et al. 2008), and high phenol inhalation for several weeks paralysis and severe injury to the heart, liver, kidneys, and lungs, and in some cases, death in experimental animais (Agency for Tox-ic Substances and Disease Registry 2008). The use of lyophilized antivenom (Mendonga-da-Silva et al. 2017) could potentially avoid phe-nol-related problems.
Hematological parameters Hematological alterations are a common manifestaron of systemic envenoming after snake-bite and the detection of abnormal blood parameters is an important step in the manage-ment of envenomed persons. Figure 4 shows the hematological results for the various experimental groups. There was a slight reduction in leukocyte numbers in G2 and mild leukocytosis in G3; treatment with antivenom appeared to attenuate the leukocytosis in group G4. This at-tenuation may have been partly mediated by the antivenom itself, independently of its effect on venom, since antivenom alone caused a reduction in leukocyte numbers. Mild leukocytosis has been observed in humans (Sano-Mar-tins et al. 2001) and dogs (Sousa-e-Silva et al. 2003; Nogueira and Sakate 2006; Nogueira et al. 2007) envenomed by C. d. terrificus and has been attributed to neutrophilia (Sousa-e-Silva et al. 2003). Nogueira et al. (2007) argued that this neutrophilia involved an acute-phase response with the release of catecholamines and cellular mediators; serum chemotactic factors have also been implicated in human envenom-ation by C. d. terrificus (Martins et al. 2002). Souza-e-Silva et al. (2003) reported that leuko-cytosis persisted for up to 48 h in dogs injected with a venom dose of 1 mg kg-1, i.m., and was reversed by treatment with antivenom i.v. 2 h after envenomation, as also observed here in rats using antivenom (G4 in Fig. 4A).
Platelet number was unaffected by the venom (Fig. 4B), a finding in general agreement with studies in dogs (Sousa-e-Silva et al. 2003) and humans (Sano-Martins et al. 2001) that also reported unaltered platelet numbers after envenomation by C. d. terrificus. Antivenom alone (G5) did not affect platelet number but decreased this number when associated with venom (G4). However, this decrease was not clinically relevant since there was no significant difference compared to saline-treated (control) rats (G1). The lack of effect on circulating platelet numbers could perhaps be the most useful parameter for distinguishing between clinical envenomation by C. d. terrificus (Sano-Martins et al. 2001) and Bothrops species (Sano-Martins et al. 1997; Yoshida et al. 2020) since venoms of the latter genus can cause marked thrombocytopenia. Such a distinction would be of clinical relevance in facilitating the choice of the appropriate antivenom, thereby ensuring better treatment of the patient, particularly in cases where the offending snake is not brought for identification.

Figure 4: Hematological parameters (leukocyte, platelet and erythrocyte counts) in rats injected with phosphate-buffered saline (PBS; G1), C. d. terrificus venom (6 mg kg-1, i.m.; G2 - analyzed 2 h post-venom, G3 - analyzed 7.2 h post-venom), venom + C. d. terrificus antivenom (G4, analyzed 24 h post-venom) and antivenom alone (G5 - 24 h after antivenom). In groups G4 and G5, antivenom was administered 2 h after the injection of venom (G4) or PBS (G5). The antivenom:venom ratio used was based on the manufacturera recommended ratio as defined in the legend of Figure 2. The columns represent the mean ± SD (n=3-5/ group). *#’®A##p<0.05 compared to G1 (*), G2 (#), G3 f), G4 (&), and G3 and G5 (##).

Figure 5: Histological renal tissue assessment in groups G1 (A and B), G2 (C and D), G3 (E and F), G4 (G and H), and G5 (I and J) (scale bar = 20 µm in all major panels). Insets in all groups show renal corpuscles (scale bar = 40 µm in all inserts). G1 (control rats injected with phosphate-buffered saline; arrows indicate the normal appearance of renal corpuscles). The effects of severe damage induced by C. d. terrificus venom are seen in G2 (venom group): panel C, long arrows = widened filtration space and hypercellularity; short arrows = microaneurysms; panel D = luminal cellular casts resulting from detachment of tubular epithelial lining; G3 (rats treated with venom and saline): panel E = hyalinization of both cortical segments and glomeruli; panel F, medullary segments showing few alterations. G4 (rats treated with venom and antivenom) and G5 (rats treated with antivenom): all panels show tissue hyalinization leading to poorly defined cell limits; panels G and I = hemorrhagic foci and glomerular microaneurysms (arrows); panels H and J = medullary sections showing the flattened epithelial lining of tubular segments with a distended lumenal space. A description of the alterations is provided in the text.
There was no difference in the number of eryth-rocytes 2 h (G2 vs. G1) or 7.2 h (G3 vs. G1) after envenomation (Fig. 4C). The delayed administraron of antivenom (G4) attenuated the slight increase in the number of erythrocytes in G3 to a level similar to that seen with saline and antivenom alone (Fig. 4C). Other reports have also observed no alterations in the number of erythrocytes, the hematocrit, or the hemoglo-bin concentration in dogs (Sousa-e-Silva et al. 2003) and humans (Sano-Martins et al. 2001) envenomed by C. d. terrificus.
Histological analysis
The kidneys regulate the bodys internal com-position through a complex network of neph-rons and collecting ducts that filter, absorb and secrete fluid and electrolytes and promote the elimination of metabolic waste products via the urine (Santoro et al. 2008). Glomerular damage leads to several pathologies (Greka and Mun-del 2012) and circulating snake venom compo-nents can cause morphological abnormalities that result in functional disturbances.
Figure 5 shows representative panels and insets for the different groups that illustrate the main histological alterations seen in the renal parenchyma. Histological analysis of renal sec-tions from the different experimental groups (G2-G5) showed that morphological changes were not evenly distributed throughout the renal parenchyma since there were areas with visible abnormalities juxtaposed to regions normal in appearance. This heterogeneity reflected the differential effects of venom components on the kidney in that all nephrons were not affect-ed simultaneously or in the same manner. Except for G1 (saline control) that showed the typical normal morphology of renal corpuscles, proximal and distal convoluted tubules, the loop of Henle and collecting ducts (Fig. 5A,B), all the other groups exhibited varying degrees of alterations in their structural segments (Fig. 5C-J). The changes included glomerular alterations (indicated by arrows in the panels and insets of Fig. 5). Major and more numerous glomerular alterations were seen in G2 and G3 (see insets); antivenom (G4) partially prevented the glomerular morphological alterations (inset in G4). Of note were the glomerular alterations in G5 (inset in G5) that received antivenom alone. The greatest structural changes in the cortical tubular nephron segments and medullary collecting tubules were seen in G2: the changes included loss or central collapse of the brush border in the proximal tubules, and luminal widening with cellular casts in the proximal and distal tubules and collecting ducts (Fig. 5C,D). Groups G3, G4, and G5 had a general hyaline appearance in the nephron segments located in the renal cortex that obscured visualization of their cellular constituents (Fig. 5E,G,I). The renal medulla showed less damage in enven-omed rats treated with physiological saline so-lution (G3) (Fig. 5F), whereas greater damage was seen in envenomed rats treated with antivenom (G4) and in rats treated with antivenom alone (G5) (Fig. 5H,J) compared to G3 (Fig. 5F); similar renal alterations in response to antive-nom have been described elsewhere (Oliveira et al. 2021), but the reasons remain to be in-vestigated. All the changes observed here are characteristic of renal disease (Cardoso et al. 1993; Haraldsson et al. 2008).
A comparative analysis of the frequency of his-tological alterations in groups G1-G5 yielded the following scores: G2 = a score of 5-6 repre-senting a very high-frequency of alterations; G3 = 2-3, a relatively low-to-moderate frequency of alterations; G4 and G5 = 4 indicating a high frequency, and G1 = 0-1 indicating few or no alterations (most of the alterations were attrib-utable to technical artifacts).
The results of this study allow us to address two specific issues: (a) The early onset of AKI: Pinho et al. (2005) have shown that ap-proximately two-thirds of patients who develop AKI following envenomation by C. d. terrificus do so within 24 h of being bitten and that the mean time between being bitten and receiving antivenom (among patients with and without AKI) was 3 h (range: 1-48 h). Risk factors for the development of AKI included age (greater for children <12 years old), the time until anti-venom administration (the greater the interval, the greater the risk), and CK >2000 IU/mL; a diuresis >90 mL/h was considered a protective factor. The 2 h time frame used to assess AKI and for antivenom administration in the pres-ent study was based on the mean interval until antivenom administration noted by Pinho et al. (2005). (b) The parameters used to assess AKI: Parameters commonly used to analyze AKI in-duced by C. d. terrificus include urinary output (diuresis) and glomerular filtration rate (based on creatinine clearance), fractional excretion of Na+ and K+, serum creatine kinase (CK), serum and urinary creatinine and proteinuria, although not all of these have the same usefulness (sen-sitivity or predictive value); additional ancillary parameters include hemoglobin, hematocrit, and platelet counts. The choice of parameters used here (creatinine, urea, and proteinuria) as markers for AKI was based on previous reports in the literature and also because these can be easily measured in serum and urine, samples of which can be obtained with relative ease in the clinical setting.
Conclusión
The findings of this study show that C. d. terrificus venom (6 mg kg-1, i.p.) induced AKI in rats within 2 h, with an increase in blood and renal urea, creatinine, and GSH concentrations, as well as enhanced blood GPx activity and renal protein concentrations. These parameters, together with histological analysis, could be potentially useful biomarkers for assessing the severity of AKI. Antivenom was effective in at-tenuating the increase in blood urea, in normal-izing the proteinuria, and in inactivating antioxi-dant defense through CAT activity, but did not protect against lipid peroxidation.
Acknowledgments
The authors thank Coordenagao de Aperfeigoamento de Pes-soal de Nivel Superior (CAPES)/Prosuc (Finance code 001), Probic/Uniso, Financiadora de Estudos e Projetos (FINEP, grant no. 01.10.0659.00), and Fundagao de Amparo a Pesquisa do Estado de Sao Paulo (FAPESP, grant no. 2016/12599-2) for fellowships. This work was supported by FAPESP (grant nos. 2015/01420-9 and 2016/12599-2).
Conflict of interest: The authors have no con-flicts of interest related to this work.
Authors’ contributions: EHY, MMJD, ICFO, and JAMF did the experiments under super-vision by YOF; JCC milked the snakes and provided the venom; DG was responsible for interpreting the oxidative stress data; MACH was responsible for the histological analyses. VMHY and YOF designed the study, and YOF, DG, MACH, and SH wrote the manuscript.

