


 Español (pdf)
 Articulo en XML
 Referencias del artículo
 Enviar articulo por email
 Citado por SciELO
  Similares en
SciELO
Similares en
SciELO 
 Permalink
INTRODUCTION
The production of nanoparticles from different materials has been a topic of wide interest for several years. The improvement of techniques, precursors and particle size control have been the main objectives of previous works [1]. Among the different synthesis techniques, the most popular has been the polyol method. Presented as a simple, versatile and easy to implement method [2], it has been successfully applied to a variety of metals [3]. In particular, palladium (Pd) nanoparticles have received much attention, given their multiple applications, especially in catalysis [4,5] and biomedicine [6]. Ethylene glycol (EG) has been commonly used as a solvent and reducing agent in the production of Pd nanoparticles in a polyol medium [7]. The decomposition of EG produces a reduction, and the new metallic phase initiates the nucleation and growth that will produce nanoparticles [8]. However, the reducing power of EG is limited, hence increasing the system temperature is used to bolster oxidation [9]. The addition of promoting compounds such as hydrazine [10] or sodium borohydride (NaBH4) [11] is a common practice to facilitate the decomposition of EG and shorten reaction times. In this way, it is possible to increase the synthesis reaction rate, but it becomes more difficult to control stabilization and material dispersion in these conditions [12,13]. Size could potentially be tuned by careful control of temperature, but high temperatures have been associated with irregular particle growth [14]. Because of these difficulties, the addition of promoters and surfactants for aggregation control during synthesis has also become a common practice [15]. Although the results of such products are promising, it has been found that chemical residues of surfactants were chemically adsorbed on the surface of the nanoparticles, potentially compromising the effectiveness of the produced material for catalytic applications [16]. Wang et al.[17] showed that it is possible to obtain stabilized noble metal nanoparticles with good dispersion using a protector-free polyol method. Arora et al. [18] demonstrated that even polyol can act as a stabilizer and that by controlling solely the reaction conditions it is possible to synthesize monodispersed Pd nanoparticles. Quinson et al. [19] obtained nanoparticles in surfactantfree EG and studied size control with sodium hydroxide (NaOH) as a promoter. These studies used the combined effects of promoters and temperature control to obtain small particle sizes. However, Chen et al. [20] explored the possibility of using only NaOH to promote nanoparticle synthesis. Since alkaline conditions promote the reduction of noble metals, it is accepted that the role of NaOH is that of a pH regulator [12]. Nevertheless, it has been observed that hydroxide ions might have an additional catalytic function [21], affecting the reaction kinetics and therefore the particle size [12,22]. The amount of hydroxide (OH−) employed is then expected to become a key element in size controlled colloidal synthesis [19,23]. The aim of the present study was to analyze the influence of hydroxide concentration on the formation kinetics of Pd nanoparticles by the simple polyol method. No stabilizers were used, and temperature was kept at room temperature to discard possible effects on the synthesis and particle size, apart from the OH− concentration. We followed the evolution of the metallic precursor reduction and nanoparticle growth with UV-vis absorbance spectroscopy. Powder X-ray diffraction (XRD) was used to study the crystallinity, morphology and particle size evolution as a function of NaOH concentration. In this context, we found that at lower OH− concentration both nucleation and grow process are regulated by the reduction of the Pd precursor given that the induction times are shorter. As a consequence, few nuclei are created resulting in the formation of larger final size nanoparticles. The increase in the OH− concentration leads to an increase in the induction time as a result of the formation of Pd-Cl-OH intermediate species. The dissolution of this species regulates the formation of PdO by increasing the number of nuclei and giving the smallest final size nanoparticle, independently of the subsequent growth processes that could take place.
METHODS
Materials
Palladium(II) chloride (PdCl2, 99.99%) metal precursor from Spex Industries, Inc. USA, Sodium hydroxide (Na(OH), ≥99%) from Merck, KGaA, Germany and Ethylene Glycol anhydrous (EG, 99.8%) from Sigma-Aldrich, Co. USA were used in the synthesis. Acetaldehyde (99.5%), from Honeywell Riedel-de Haën TM , USA, was also used as a standard of comparison. All reagents used were analytical grade, stored at room temperature and used without additional purification procedures.
Synthesis of Pd nanoparticles
We obtained Pd nanoparticles by the well-known polyol method [20]. A stock solution of PdCl2 (10 mM) in EG was prepared with the addition of concentrated hydrochloric acid (∼ 1 µ l HCl : 1 ml EG) to enhance the PdCl2. By taking different volumes of stock solution and adding NaOH solution in EG up to a total volume of 5 ml, samples with [NaOH]/[Pd] molar ratios (R) from 1 to 33 were obtained. The NaOH solution was prepared by diluting a known amount of the base in EG at room temperature. Before use, all glassware was carefully and thoroughly cleaned and dried.
Mixing was carried out at room temperature and under vigorous stirring. Several minutes after mixing the reagents, a black colloid deposit containing the nanoparticle materials was observed. To extract the nanoparticles, the colloid was washed five times with acetone (1:5 vol) in a sonication (330 W, 50 Hz)-centrifugation (10000 rpm, 10 min) sequence. At each wash, the supernatant was removed and replaced with fresh acetone. The final material was redispersed in alcohol.
Characterization
Ultraviolet visible absorption spectroscopy (UV-vis).
Synthesis product formation and reaction evolution were followed by UV-vis spectroscopy. Reactions were carried out in 1 cm quartz cells (1 cm optical pathway) in an Ocean Optics USB2000 spectrophotometer. To ensure a complete and uniform mixture of the reagents, a magnetic stirrer was used during the spectrum collections. The measurement started when the NaOH solution was added, at a spectrum measuring interval of 0.1 sec from the 180 to 800 nm wavelength. Further measurements of the final solution were performed to determine the amount of remaining Pd. In these measurements, 2.5 ml samples were centrifuged (15000 rpm, 10 min) to remove solids, and the supernatant was analyzed as described above. An acetaldehyde/EG mixture was also analyzed as a reference standard.
Transmission electron microscopy (TEM).
Samples were prepared using droplets of the colloid. These droplets were washed with acetone and redispersed in methanol. A drop of this suspension was deposited on a carbon-coated copper microscopy grid (400 mesh). Grids were dried, and the excess liquid was removed with tissue paper. The grids thus prepared were analyzed using a JEOL-100CX II TEM at 100 kv and a FEI-HR TEM (Talos TM F200X) at 200 kV.
X-ray diffraction (XRD).
The crystalline structure of the samples was analyzed by powder XRD using a Panaytical Empyrean III diffractometer with a CuKα (1.5418 Å) radiation. Diffractograms were obtained in the interval 30 ≤ 2θ ≤ 90, with a step size of 0.02◦ and a speed of 1 sec/step. Samples were prepared by drying a few milligrams of the solid material obtained from the colloid after washing.
RESULTS AND DISCUSSION
Formation of Pd nanoparticles
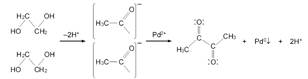
The polyol method employed started with the dissolution of the Pd salt and progressed through the commonly accepted reactions depicted in Fig. 1. In the particular case of PdCl2, acidification of the medium is required for complete dissolution. The late addition of NaOH solution would enhance EG oxidation into acetaldehyde, reducing Pd and producing 2,3-butanedione as main oxidation product.
The reaction progress can be observed by the naked eye. The initial PdCl2/EG solution (bright orange) changes color according to the concentration of the added NaOH. A black dispersion, typical of reduced Pd colloids, can be observed as the NaOH solution is added. This first Pd reduction is fast and precedes the nucleation and growth process of nanoparticles. The Pd/EG solutions analyzed by UV-vis showed two well-defined peaks at 330 and 437 nm. The intensity of these peaks is directly correlated with the Pd2+ concentration [24], so their attenuation indicates the reduction of Pd2+ and, therefore, the formation of metallic palladium (Pd0). Thus, we monitored the reaction progress by following the peak with the highest intensity. In this wavelength interval, no interferences from EG or NaOH/EG solution are expected.
In preliminary experiments, we observed that the Pd reduction and nanoparticle production were possible in the absence of NaOH. However, the reaction rate at room temperature was very slow. The UV-vis spectra from these Pd/EG solutions show different features in comparison to a freshly prepared solution; however, after several weeks no significant amount of sedimented Pd0 was obtained.
The spectra (between 190 - 540 nm) of the supernatant solutions at different NaOH concentrations are shown in Fig. 2. From the PdCl2/EG 10 mM reference solution, the minimum Pd concentration would be reached at R ≈ 4. A precipitate of clustering particles that sediment and leave a translucent supernatant can be obtained at these concentrations, which implies that all available Pd is reduced and the Pd2+ peak should not be present. Instead of this peak, two well-defined signals are detected at 220 and 282 nm in agreement with those obtained from the NaOH/EG solution at equivalent concentrations. As the NaOH concentration increases, the intensity of the peaks increases; the signals may correspond to by-products formed during the synthesis, probably an acetaldehyde. Analysis of the EG/acetaldehyde mixture prepared with pure reagents showed peaks at the same wavelengths, which suggests the presence of remaining acetaldehyde not consumed during the reaction. In this scenario, the action of NaOH would be mainly catalytic (providing OH− ions), increasing the production of acetyls by EG dehydration [25,26], according to the first part of the reaction scheme presented in Fig. 1. The resulting high concentration of acetyls increases the possibility of reduction of Pd ions and the consequent increase in conversion. There is little evidence in the literature confirming the presence of acetaldehyde, as it is an unstable compound [27] that might oxidize into other species easily. In spite of this, Chen et al. [20] identified -CHO groups by infrared spectrometry in a Tollens reaction and Joseyphus et al. [28] detected acetaldehyde using UV vis with a 2,4-dinitrophenyl hydrazine test solution. The formation of dioxane, glycolaldehyde and carboxylic acid has also been suggested, specially at high temperature [23,29]. A complete discussion on the presence and quantification of the reaction by-products is beyond the scope of the present study, and further research is needed.
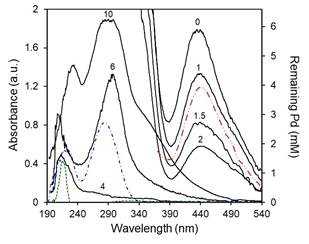
FIG. 2: UV-vis absorbance (left scale) and remaining Pd concentration (right scale) of Pd-EG solutions for different R (0-10, as indicated): after completion of the reaction (black solid lines); without NaOH and stored for four weeks (red dashed double dotted line); fresh acetaldehyde-EG solution (blue dashed dotted line); and fresh NaOH-EG solution for a similar concentration of R = 4 (green short dashed line). Conditions: [Pd]0 = 10 mM, VTotal = 5 ml, room temperature.
Crystalline structure, particle size and morphology
The crystalline structure, average particle size and morphology of the obtained material were analyzed by XRD and TEM. Fig. 3 shows the diffraction patterns for different NaOH concentrations. Planes (111), (200), (220), (311) and (222) at Bragg angles 2θ of 40.2◦, 46.6◦, 68.0◦, 82.0◦ and 86.5◦, respectively, are identified by comparison with the Crystallography Open Database, COD file 1534921, indicating that the samples are composed of Pd0 in a face-centered cubic (fcc) structure. These results are in good agreement with those reported by Long et al. [30] for Pd nanoparticles in EG. In some samples, we observed the presence of sodium oxalate (Na2C2O4), which could be removed after the purification process. Although the formation of Pd(OH)2 has been suggested [20], this compound was not detected in our samples.
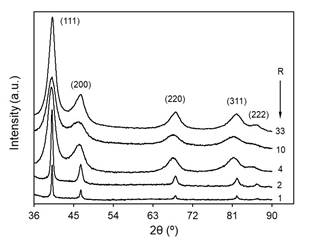
TEM images showed that the material is formed by irregularly shaped aggregates, as seen in Fig. 4 for the case of R = 10, which is representative of the overall samples. Nevertheless, it can be assumed that these clusters are formed by smaller particles, although it is difficult to make a proper estimation of the particle size mainly due to the overlapping caused by the aggregation itself. These aggregates were already described in the literature and attributed to the self-assembling nature of oxalate dianion [31]. In this context, XRD data were also used to calculate the crystalline domain size to assess the effect of NaOH concentration on the size of the nanoparticles. The average crystallite size can be estimated from the width of the powder diffraction peaks. As can be seen, the initially narrow XRD peaks increase in width as the NaOH concentration increases (Fig. 3). This correlation may suggest a direct relationship between nanoparticle size and NaOH/Pd ratio, even when it is difficult to rule out that the nanoparticles may consist of more than one crystallite.

Fig. 5 shows the average crystallite size as a function of R, obtained from the Williamson-Hall plot [32,33]. The average size decreases rapidly from 24 to ∼4 nm for R < 6, remaining an approximately constant size of about 2.5 nm for higher NaOH concentrations. This behavior is in good agreement with those published elsewhere [20,34].

To obtain more insight about nanoparticle morphology, we evaluated the crystallite sizes for each diffraction peak by applying the Scherrer equation [32]. The results for different R values are plotted in Fig. 6. As expected, the average size for each plane increases as the proportion of the Pd precursor decreases. Furthermore, a noticeable relative growth of the average crystallite size is observed for planes (111) and (222), while a decrease is expected according to the Bragg angle increase. This result suggests that the crystallite has a preferential growth in the direction of plane {111} [31,35,36]. However, for R less than 3, the differences between the sizes obtained for the plane (111) and the ones obtained for the plane (222) become larger as R decreases; for values greater than 3, the difference becomes negligible. Therefore, it can be assumed that the nanoparticles have a nonspherical shape and that their anisotropy increases as R increases.

Nanoparticle formation process
The kinetic study of nanoparticle formation was performed by in situ UV-vis data analysis of the reaction, without stabilizers. The omission of stabilizing agents allowed the analysis of the process without diffusional or mass transfer limitations that might have originated by the use of these substances. In this way, the maximum formation speed of the nanoparticles can be determined [37]. Fig. 7 shows the absorbance at 437 nm as a function of time for different R values. This process occurs differently in each case, and the plotted curves vary according to the time interval and the NaOH concentration used. The identified stages are in agreement with typical nanoparticle formation mechanisms [38,39]. The reduction reaction starts at the time t ad when NaOH is added to the PdCl2/EG reference solution. Thereafter, the absorbance sharply drops due to a combination of dilution and Pd reduction effects. At this stage, seed nuclei appear and would eventually develop into nanoparticles. Following this stage, the absorbance increases owing to the dispersion produced by the nuclei growth. This growth continues until the ripening phase is reached, at which point Pd2+ ion concentration is minimum and larger particles would continue to grow at the expense of smaller ones. This particle coarsening has been studied in the formation of metallic nanoparticles [40,41]. As the reagent concentration increased, the time difference between nucleation and growth was greater and maturation was clearly observable. Under these conditions, the results are similar to those reported by Tojo et al. [42] in obtaining metallic particles in a confined environment. When the amount of reagent is increased, the formation of nuclei is favored and the amount of Pd+ decreases. However, if the reducing agent is not strong enough, unstable nuclei will form, redissolve and condense on the surface of more stable ones. For this reason, the total number of particles decreases causing a dispersion reduction, which eventually leads to an absorbance drop. Finally, the absorbance signal becomes noisy due to the effect of continuous aggregation and precipitation of larger particles. In all experiments, a rapid reduction step was observed, with the minimum absorbance being recorded a few seconds after the start of the reaction. However, the reaction was not completed in all cases. At low NaOH concentrations, this variation is approximately 45%, and increases to 93% at the maximum concentration. It has been reported that reduction processes would have a direct effect on the formation of nuclei, and therefore also on the final nanoparticle sizes [43].

FIG. 7: Evolution of the absorption for reactions with different concentration of NaOH as a function of time at room temperature, [Pd]0 = 10mM, Vtotal = 5 ml.
To study these processes, the first step was addressed using the slope of the curve (absorbance versus time) at the beginning of the reaction. Experimental data for the different reactions are presented in Fig. 8. Initial rate (starting slope) values along with the R concentrations values are presented in Fig. 9a. and the final average nanoparticle size along with initial rates in Fig. 9b. These results suggest the existence of two underlying mechanisms that would affect nanoparticle size in relation to the NaOH concentration. At lower concentration (R = 0 to 2) the reduction rates increase from 0.5 s−1 up to 2.4 s−1 and the average particle size drops from about 18 nm up to ∼ 10 nm. For higher values of R, the reduction rate decreases to a minimum of 0.7 s−1, which was not altered with further increases of R. In agreement with this behaviour, the particle size decreases to a minimum of around 3 nm for the highest R values tested (Fig. 9b).

FIG. 8: Absorbance (λ = 437 nm) vs. time of the initial region of the Pd2+ reduction curves at different R.

FIG. 9: (a) Initial rate for different R ratios. (b) Particle size function of the initial rate, (R value is indicated).
Once the absorbance minimum was reached, an induction period became apparent, which precedes an increase in the UV-vis signal (see Fig. 7). We defined this induction period (t i ) as the time in which absorbance does not vary, that is, from - dA/dt ≈ 0 until the rate of increase is continuous and greater than 0.2 s−1 (which is the minimum absorbance change that can be detected by our equipment).
Fig. 10 shows how t i increases with R and a linear correlation from R = 2. The maximum value of t i was 20 min, achievable at R = 33, after which a barely perceptible (∼ 0.2 s−1) increase in absorbance occurs, probably due to the noise produced by the aggregation of the nanoparticles. These results indicate that as the NaOH concentration increases, t i also increases, which is indicative of the formation of small-sized nanoparticle.

FIG. 10: (a) Induction time for different R ratios. (b) Particle size function of the induction time, (R is indicated).
At the end of the induction period, the absorbance increase rate is different for each case. For R < 3, t i is very short and the experimental data can be represented by the first-order kinetic law, dA/dt= k A, where k is the kinetic constant. A plot of ln A against time would correspond to a straight line (see Fig. 11a), being the slope the rate constant. A similar experimental behavior was observed by Cai [44] in silver nanoparticle formation kinetics and by Sau [45] in a seed particle-mediated synthesis. When R is increased (3, 4), the reduction increases, a longer induction time is recorded and finally a rapid increase in absorbance is observed. At this point, the nucleation and growth stages begin to be distinguished separately. For higher R (6, 8), the induction time continues to increase and the growth kinetics can be fitted using a sigmoidal curve, suggesting an autocatalytic reaction. If this autocatalytic stage exists, then ln [a / (1-a)] will change linearly with time, where a = A f /A t and A t and A f are the absorbance at t and final times, respectively [46,47]. This is plotted in Fig. 11b; the growth is actually autocatalytic, which becomes less pronounced with the increase of R. At high R values, the growth rate and the slope of the curve are so low that the absorbance versus time could be described by a straight line (linear growth, Fig. 7).

Influence of NaOH concentration
The different behaviors seen in Fig. 7 could be explained on the basis of the initial NaOH concentration. This concentration would determine the reduction reaction rate and the following nucleation and growth steps. Initially, when R < 2, the reaction rate is low. The concentration of Pd ions remains high given the weak reduction character of the solution, thus few nuclei will form. Then, the first particles formed act as catalysts, attracting precursor ions to their surface, where they would be subsequently reduced [48-50]. The low OH− concentration delays the reduction process, and therefore could increase the adsorption of precursor ions to the newly formed nuclei. Furthermore, the absence of capping agents or other protective agents allows easy access of ions to the surface of the catalytic nuclei. In addition, since there is a high material flow to the surface, both reduction and growth occur simultaneously, speeding up the increase in the average size of the newly formed particles. Reported studies have proved that high concentrations of a strong reducing agent promote fast initial reduction and the formation of a large number of small nuclei. In other words, the average particle size decreases as the concentration of the reducing agent increases. In the present study. we found that the initial rate decreases as the amount of hydroxide increases (Fig. 10a). This relationship could be indicative of a deceleration of the reduction process; consequently, the nanoparticles formed will tend to grow. However, no larger nanoparticles were observed. To study this phenomenon, we followed the evolution of the UV-vis spectra of each reaction as we increased the NaOH concentration from R = 0 to 33. Fig. 12a shows the absorbance spectra corresponding to zero induction time, t i , for each reaction. As the reaction progresses from the NaOH addition (t ad ) to the beginning of the induction period, ti, for R > 2 the intensity of the 437 nm peak decreases, and also shifts to lower wavelengths as shown in 12b for the extreme case of R = 33. Initially, this occurs by nonisosbestic behavior, implying that the starting Pd (Pd2+) is transformed into an intermediate ionic complex [51] (possibly of the Pd-Cl- OH type), which will eventually decompose and reduce to Pd0. The speciation of Pd has been researched [52,53], and published results show that the species distribution is highly pH dependent. Under acidic conditions, only [PdCl4]−2 type ions are present [54]; as pH increases, these species gradually disappear and start forming complexes of [PdCl m (OH) n ]2−-type composition that end up being the predominant species [55]. Mechanisms for the formation of these complexes, in which NaOH is used as the reducing agent, have been proposed in the polyol reduction process [56]. In the present study, the dissolution of Pd chloride was performed in acidic medium (pH = 2), so the predominant complexes would be tetrachloropalladates. Thus, the observed variations in the UV-vis are due to the decrease in the concentration of these compounds. For higher R values, along with the reduction, the formation of chloro-hydroxo complexes occurs, showing that absorption bands are lower wavelengths. The UV-vis signal variation then corresponds to both the reduction of Pd [PdCl4]−2 and the formation of a new complex, decreasing the intensity and shifting the signal, respectively. This behavior is pronounced as the concentration of OH− ions increases, so the initial reaction rate is lower [57]. The formation of intermediates also limits growth, decreasing the average particle size. The strong reducing character of the solution (R > 3) creates many small nuclei, which do not have the ability of attracting precursor ions to trigger autocatalytic surface growth, as these would not be available. The intermediates compete for these ions and become a regulated supply store of Pd2+ [58].
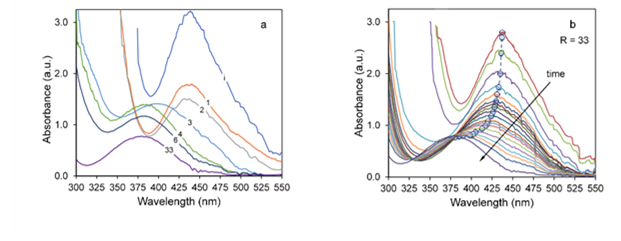
FIG. 12: (a) Variation of the characteristic Pd absorption bands for different R when the induction time is equal to zero. (b) Maximum absorbance peak evolution for R = 33.
The slow dissolution of the intermediates would control the eventual Pd reduction [28], governing the formation of new nuclei and the increase in size of the nanoparticles [56]. This behavior will produce a lower growth rate, as indicated by longer induction times, and a steeper slope in the growth curve as R increases.
These observations indicate that NaOH not only regulates the pH in the EG nanoparticle synthesis reaction. It Initially acts by promoting the EG oxidation, which will increase the rate of the reaction, therefore reducing the average size of the formed nuclei. At the same time, the remaining hydroxides could interact with metal ions, capturing them from the solution and preventing them from participating in the autocatalytic growth step. The process involves a simultaneous reduction of Pd ions and the formation of intermediate species, which are determining factors in the control of the reduction reaction and the size of the nanoparticles.
CONCLUSIONS
Palladium nanoparticles were obtained by NaOH-promoted EG reduction at room temperature. The nanoparticle formation process was analyzed by UV-vis spectroscopy, and the influence of the NaOH concentration was studied. A typical three-stage mechanism (reduction, nucleation and autocatalytic growth) was observed in the formation of the nanoparticles. The reaction involves the formation of an intermediate Pd species (Pd-Cl-OH), which decomposes into Pd0. The dependence of the average particle size on the initial OH concentrations is attributed to the formation of this compound, which competes for the available Pd2+ ions and thus modifies the growth kinetics. Hence, the hydroxide acts as a catalyst that promotes EG decomposition and simultaneously as a regulator of the amount of Pd ions available for reduction. The overall effect observed is a control of the average nanoparticle size, which is in the range of 24 to 4 nm as R increases to a value between 4 and 6, and then stabilizes around 3 nm for higher values of R. As we show by means of XRD analysis, the resulting nanoparticles have a preferential growth along the plane {111} direction; therefore, they are nonspherical in shape with an increasing anisotropy as R decrease. Our results show that for this synthesis process increasing the concentration of NaOH lengthens the induction times, resulting in the generation of more nuclei, which determines the smallest final particle size independently of subsequent growth processes.

