


 Artigo em XML
 Referências do artigo
 Enviar este artigo por email
 Citado por SciELO
  Similares em
SciELO
Similares em
SciELO 
 Permalink
Introduction
Cancer pathogenesis has been associated with genetic and epigenetic alterations that may lead to the inactivation or decrease of tumor-suppressor genes 1. Among these, the phosphatase and tensin homolog (PTEN) gene is frequently deleted or inactivated in various tumors, suggesting that the loss of a single PTEN allele is sufficient to drive tumorigenesis. It has been reported that minimal changes in the expression level of PTEN can have profound effects on tumor susceptibility 4. In addition, mechanisms such as methylation or mutations in the gene promoter may lead to a loss of PTEN function. This loss of PTEN function is involved in the development of cancer and other human diseases 7-13. In addition, polymorphisms in the PTEN gene have been associated with Type 2 Diabetes Mellitus (T2DM)14-18.
T2DM is closely related to obesity and both are characterized by insulin resistance 19, generally defined as a reduction in the ability of insulin to exert its metabolic effects on tissues 20. Although the etiology of T2DM can be very different, both have been related to alterations in insulin secretion, in the sensitivity to the action of insulin, or both 21-23. Since insulin is also a powerful promoter of cell growth, it has been involved in the development of some types of cancer.. In fact, a strong relation between T2DM and the risk of developing certain types of cancer has been reported 25-27.
Insulin action activates two main signal transduction pathways: the phosphatidylinositol-3-kinase (PI3K) pathway and the mitogen-activated protein kinase (MAPK) pathway. Both pathways in turn regulate most insulin actions associated with the regulation of energy metabolism and gene expression28-30. In muscle tissue and adipocytes, the metabolic actions induced by insulin, including GLUT4 translocation, glucose uptake and glycogen synthesis, in turn depend on the activation of another pathway, the PI3K/Akt pathway. In addition, it has been demonstrated that abnormalities associated with diabetes, metabolic syndrome, obesity, hypertension and cardiovascular diseases are related to the PI3K/PTEN signaling pathway.
Thus, since T2DM and cancer are connected and PTEN may be a crucial gene related to both diseases, we consider it is essential to evaluate the PTEN expression pattern in T2DM patients and T2DM patients with cancer. Based on this, the aim of the present study was to evaluate PTEN expression, PTEN methylation and the frequent 32-bp deletion in the PTEN gene (known as rs34421660 genetic variant) and their relationship with T2DM and cancer development.
Materials and methods
Patients
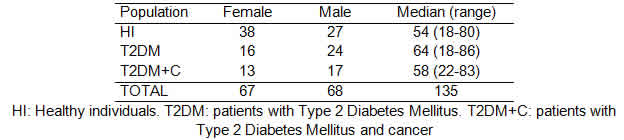
To carry out this work, we have performed a case control study. All the participants provided an informed consent and their anonymity was preserved. The study was approved by the Ethics Committee of Dr. Fernando Barreyro Hospital, Posadas, Misiones, Argentina. A total of 135 samples were analyzed. Peripheral blood samples were obtained from 70 patients of both sexes, aged between 17 and 83 years old: 40 patients with T2DM and 30 patients with T2DM and cancer (T2DM+C). All samples were obtained at CEBAC laboratories of the Nosiglia Clinic, Posadas, Misiones, Argentina. Control samples were collected from 65 healthy individuals of both sexes, aged between 18 and 80 years old, all from Posadas.
Sample preparation
Total RNA and DNA were extracted from total leukocyte cells from peripheral using Trireagent® following the manufacturer’s protocol. First-strand cDNA synthesis was performed with random hexamer primers and M-MLV reverse transcriptase®.
Polymorphism detection
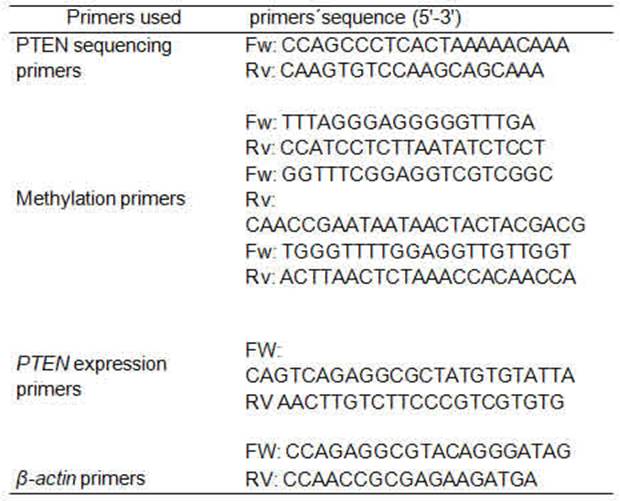
32-base-pair (bp) deletion polymorphism (rs34421660) was detected by conventional PCR, using Taq DNA polymerase 500U InBio Highway®.We obtain a fragment of 209 bp or 241 bp depending if the deletion was present or not. The primers used have been previously published 36 (Table 1). The reactions were carried out in the thermocycler Bioer GenePro. The rs34421660 polymorphism was corroborated by direct sequencing, using the PCR product corresponding to homozygous cases, one with deletion and the other without it (Figure 1). The PCR product was electrophoresed on 2% agarose gel containing ethidium bromide, a band corresponding to the expected size was purified using GFX columns (GE Healthcare) and then sequenced.
PTEN promoter methylation
The DNA samples were treated with sodium bisulfite, while methylated C residues resisted the treatment. Stanganelli et al. 37 method was used for the bisulfite treatment of DNA with certain modifications. Briefly, 1 μg of genomic DNA was denatured with 3 M NaOH at 37°C for 20 min and modified with 4.5 M sodium bisulfite (Sigma, St. Louis, MO, USA) and 10 mM hydroquinone (Sigma, St. Louis, MO, USA) at 55°C for 5 h. After purification with the WizardTM DNA Clean-up System (Promega A7280, Madison, WI, USA), the DNA was desulfonated in 3 M NaOH. The subsequent PCR amplification was performed using primers designed previously for either methylated or unmethylated DNA 38 (Table 1). The forward and reverse primers used for the first stage allowed amplify a fragment of 529 pb amplicon; 5 μl of the first-stage PCR product was used as a template for the second PCR stage. In the second stage, if the amplification product was unmethylated, the amplicon obtained was 173 bp, whereas, if the product was methylated, the amplicon obtained was 155 bp. Due to the difficulty in the process of methylation and subsequent amplification, only 42 samples could be analyzed by methylation of the PTEN promoter.
Thermal profiles consisted of an initial denaturation step at 95°C for 5 min, followed by 35 cycles at 97 °C for 45s, 58 °C for 30s, and 72 °C for 60 s, with a final extension step of 10 min at 72 °C. Reaction products were visualized after electrophoresis on 2% agarose gels (Tris-acetate EDTA
buffer, pH 8) containing ethidium bromide.
PTEN expression
To observe PTEN gene expression, Quantitative PCR was carried out using BIOER -Line Gene K Real Time, FDQ-48A (A4), as follows: 95 °C for 3 min, 50°C for 1 min, followed by 40 cycles to 95°C for 15 s and 60 °C for 1 min. The melting curve analysis and gel electrophoresis experiments were used to ensure that only one product of the expected size was amplified. Non-template controls were included in each run. Expression values were obtained from the threshold cycle (Ct value), using serial dilutions of the K562 cell line as standard curve.
The expression of the PTEN gene was normalized by subtracting the Ct value of the housekeeping gene (β-actin) from the Ct value of the target gene (ΔCt). The relative copy number of PTEN mRNA was calculated according to 2−ΔCt, and then expressed as a percentage. PTEN expression was measured in duplicate for each sample. The primers (table 1) and conditions have been previously published 39.
Statistical analysis
The association between the rs34421660 polymorphism and diabetes and cancer was analyzed by univariate Fisher's exact test and multivariable logistic regression analysis. The odds ratios (ORs) and their corresponding 95% confidence intervals (CIs) were calculated. The ORs were analyzed with the use of the SPSS software (version 15.0) (IBM, SPSS Inc., Chicago, USA), and Hardy-Weinberg equilibrium (HWE) was tested using a goodness-of-fit Chi-square test. Standard genetic models (additive, recessive, co-dominant and dominant) for disease penetrance were evaluated. Differences in expression levels were analyzed using one-way analysis of variance (ANOVA) and an unpaired t test to compare differences between groups. The statistical analyses were performed using GraphPad Prism5.0. All statistical tests were two-sided and values of p≤0.05 were considered statistically significant. To determine a value allowing the identification of cases with increased PTEN expression with respect to the healthy individuals (HI), a cut-off value from the healthy group was calculated as follows: mean + 3 standard deviation (SD) 39.
Results
Case-control study
Out of the 135 individuals incorporated in this study, 70 had T2DM and 30 of these individuals were also diagnosed with cancer (testicle, breast, colon, lung, prostate, kidney and pancreas). The distribution regarding gender and age is shown in Table 2.
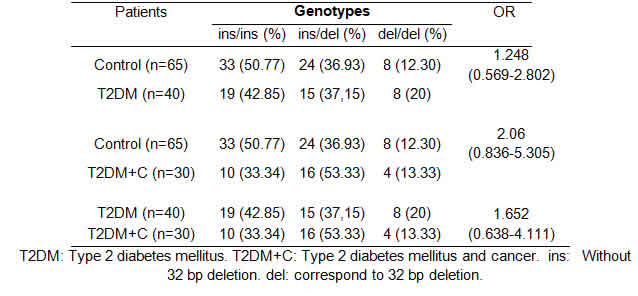
The rs34421660 genotype frequencies were also analyzed comparing patients and controls according to DM2, DM2+C and the Control Group (Table 3). Genotype and allele frequency distributions for rs34421660 in cases and controls are shown in Table 4.
No deviation from HWE was found either for controls or patients (p=0.38 and p=0.45, respectively).

Detection of the rs34421660 polymorphism (32-bp deletion)
After PCR amplification, all the samples were cataloged based on whether the rs34421660 polymorphism was present or absent considering gender and condition (patients or controls). The distribution of rs34421660 by condition is shown in Table 3.
The rs34421660 polymorphism seemed not to be associated with the development of diabetes [OR: 1.825 (0.804-4.140)] or cancer [OR: 1.64 (0.599-4.494)] and not involved in different levels of PTEN expression (p=0.45).
PTEN expression
The ANOVA (α=0.05) showed statistical differences in the PTEN expression levels (p<0.0001). Statistical parameter values of PTEN expression in the populations analyzed were as follows: statistical mean ( + HI: 3.69;
  +T2DM: 24.25; + T2DM+C: 7.74); SD σ (σ HI: 4.58; σ T2DM: 13.11; σ T2DM+C: 7.08); and standard error (SE) (SE HI: 0.57; SE T2DM: 2.62; SE T2DM+C: 1.67). The t test analysis was performed with significant level of α=0.05 and patients were compared between them and with HI. PTEN expression was statistically higher in T2DM patients than in HI (p<0.0001) and T2DM+C patients (p<0.0001). Besides, PTEN expression in T2DM+C patients was statistically different from that in HI (p= 0.0045) (Figure 2).
To determine a value that allow the identification of cases with increased PTEN expression with respect to HI, a cut-off value from the HI group was calculated as follows: mean + 3SD: 3.69 + (3 × 4.58) = 17.43. Unlike that observed in the other groups, 68% of T2DM patients presented an overexpression of the PTEN gene (Figure 3).
Methylation of the PTEN promoter
The methylation status of the PTEN promoter was analyzed in 42 cases of the three groups (Table 5). T2DM+C patients showed higher frequency of methylation than T2DM patients and HI (p=0.0215).
The first PCR stage, which produced a 529-bp amplicon, was used as a template for the second PCR stage, and the second stage was performed as previously described. In the second stage, the unmethylated amplification product was a 173-bp fragment, whereas the methylated amplification product was a 155-bp fragment.

Discussion
PTEN is a protein phosphatase with dual activity, both involved in the insulin signaling pathway and working as a tumor suppressor 42. The metabolic action of insulin depends on the PI3K signaling pathways, and some defects in these pathways have been reported in T2DM patients. In addition, PTEN can negatively regulate the positive actions of PI3K through the regulation of PIP3 levels. Thus, this negative regulation could "improve" the insulin signaling. Although the PTEN tumor-suppressor functions have already been widely demonstrated, the physiological role of PTEN in glucose metabolism is largely unknown.
Currently few studies are focusing on PTEN as a possible mediator by way of suppressor tumor, as well as negative regulator at the front desk of the insulin at the cellular level and its involvement in the development of cancer in individuals diagnosed with T2DM.
The aim of this work was to characterize the 32-bp deletion known as rs34421660 polymorphism in the PTEN gene and its association with the susceptibility to develop cancer in patients with T2DM. Besides, the levels of gene expression were assessed in patients whose PI3K pathway could be altered due to T2DM, and compared with respect to the expression levels in T2DM patients with cancer, considering PTEN functions as a tumor suppressor.
Polymorphisms can either be silent (and thus have no direct functional repercussions) or provide advantages or disadvantages against certain diseases in individuals carrying. Researches aimed to identify frequent genetic polymorphisms that confer susceptibility to suffer a particular disease are becoming more frequent. If these polymorphisms are present in the promoter region, they might derive in an altered gene expression. Similarly, when the changes occur in intronic regions, they could modulate the gene expression. In this context, specific molecular studies can demonstrate whether polymorphisms are functional, and epidemiological studies are fundamental to assess whether their presence is a risk factor for population health 49. In this study, no statistically significant association was observed between the rs34421660 polymorphism and T2DM and/or cancer development in T2DM patients. The role of PTEN as a tumor suppressor and its expression levels are regulated by several and complex mechanisms 41. The physiological action of PTEN is to block PI3K signaling by PIP3 dephosphorylation, avoiding related effects by PIP3 increase, as AKT signaling deregulation. An increase in AKT activity leads to amplified cell survival, growth and proliferation 51. It has been reported that patients diagnosed with many types of neoplasms have a lower expression of PTEN than those without neoplasms. These investigations are based on the development of cancer as the final result of the deregulation of the cell cycle and apoptosis inhibition. PTEN modulates the metabolic actions in the cell by regulating the pathway downstream PI3K, where, in addition to reducing the levels of PIP3, it can also dephosphorylate the insulin receptor substrate, altering the signaling of the insulin PI3K/AKT pathway through these two mechanisms 54. An increase in PTEN expression, and therefore in its activity, should lead to the same impact on the signaling of insulin as a decrease in the activity of the PI3K pathway 55.
In this study, the expression of PTEN presented a marked variation in the T2DM population with respect to healthy individuals. Through the cut-off value, calculated from the PTEN expression in healthy individuals, we identified that 68% of the T2DM patients studied had PTEN overexpression. A recent study related to the expression of this gene and its association with T2DM in a population of a region of Western China has recently found that this expression would be related to severe insulin resistance 6. In addition, PTEN is involved in the control of muscle protein metabolism, presenting a fluctuating behavior in catabolic conditions, and it has been shown that high levels of PTEN expression contribute to the degradation of muscle proteins, a characteristic phenomenon in T2DM 56. The T2DM mechanism that would lead to muscle atrophy is related to the reduction of protein synthesis. Proteolysis of the muscle in catabolic conditions is linked to insulin resistance and specifically to the defects in the substrate of the insulin receptor associated with the PI3K/AKT pathway. Experimental evidence has shown that PTEN levels vary with models of defects in insulin signaling, and that PTEN suppression produces a marked improvement of glucose concentrations in blood and of the insulin sensitivity in diabetic mice. On the other hand, overexpression of PTEN inhibits glucose uptake and GLUT4 translocation 57 and a high-fat diet-induced insulin resistance increases the activity of PTEN 58. The PTEN overexpression in patients with T2DM observed in this study is consistent with previous experimental evidence suggesting that PTEN is transcriptionally regulated in insulin chronic deficiency/resistance in T2DM. The mechanism of increased PTEN expression observed in T2DM would mean an increase in PTEN mRNA. The activity and expression of PTEN can be increased by the incubation of endothelial cells with free fatty acids. In this case, PTEN overexpression was related to the stimulation of p38 MAPK 59. Findings in muscle cells in culture have confirmed not only that palmitic acid increases p38 activation and PTEN expression, but also that p38 inhibition suppresses the increase in palmitic acid in PTEN mRNA and the expression of induced to protein. These results suggest that the transcription and expression of PTEN are related to the activation of p38, which could partly explain the high expression of PTEN in the T2DM.
In many tumors, the PTEN gene is mutated or deleted 42. Although in the present study we expected that T2DM patients with cancer would show decreased PTEN expression levels, we found no statistically significant difference with respect to those of the healthy individuals studied. Due to the great overexpression of PTEN observed in T2DM patients and considering that the diagnosis of cancer in the T2DM+C patients was subsequent to the T2DM condition, it is necessary to compare these two populations together. Although there was statistical difference selection to compare the levels of PTEN in T2DM patients with cancer and healthy individuals, the levels of expression in T2DM patients with cancer were markedly lower (p>0.0001) than those in T2DM patients without cancer. This may allow us to infer that, during T2DM, given the need to maintain over-expressed cellular homeostasis values of PTEN, variations in the levels of expression could lead to a deregulation of the "balance" reached in signaling pathways and promote the development of neoplasms. To prove this, it would be necessary to perform a prospective study in T2DM patients that develop any neoplasia over time and show decreased expression of PTEN. In addition to mutations in the PTEN gene, gene silencing through the hypermethylation of its promoter has been suggested as a potential mechanism that contributes to the down-regulation of the PI3K pathway by PTEN, which, at the same time, is positively associated with an increased risk to several types of cancer. This relationship between aberrant methylation and cancer has become evident by the fact that the absence of methylation leads to the activation of oncogenes and the presence of methylation annuls the protective action of tumor-suppressor genes. In the present study, we evaluated the methylation profile of the PTEN promoter in the different populations and established its association with the low expression of PTEN in T2DM patients with cancer. The inactivation of tumor-suppressor genes contributes to carcinogenesis by conferring certain advantages to indefinite cell growth, which is consistent with the partial results here obtained.
Conclusion
The rs34421660 polymorphism of PTEN in intron 2 was present in 44% of the healthy individuals studied. This polymorphism seems not to be associated with the development of T2DM or cancer as well as not involved in different levels of PTEN expression. However, PTEN expression levels are higher in T2DM patients than in healthy individuals and markedly lower in T2DM patients with cancer than in T2DM patients without cancer. The hypermethylated PTEN promoter is more frequent in T2DM patients with cancer. Genetic and epigenetic mechanisms of the PTEN gene may be a key in the relationship between T2DM and cancer. PTEN expression may serve as a potential candidate biomarker for cancer development in T2DM patients.
Legend to Figures

Figure 1: A: Representative polymerase chain reaction (PCR) products resolved by agarose gel electrophoresis to detect the presence or absence of the rs34421660 polymorphism (32-bp deletion) of the PTEN gene. M, DNA marker. Lane 1, heterozygous 32-bp deletion; lane 2: homozygous 32-bp deletion; lane 3: homozygous non-32-bp deletion. B: Genotype patterns for 32-bp homozygous deletion

Figure 2: Percentage of the mean of PTEN expression. PTEN expression was statistically higher in T2DM patients than in healthy individuals (p<0.0001) and T2DM patients with cancer (p<0.0001). Furthermore, a statistically significant difference was observed between T2DM+C patients and healthy individuals (p= 0.0045). HI: Healthy individuals, T2DM: patients with Diabetes Mellitus Type 2, T2DM+C: patients with Type 2 Diabetes Mellitus and cancer.

Figure 3: Frequency of cases with PTEN expression >17.43. Percentage calculated taking into account the cut-off value obtained from HI ( + 3SD = 17.43). High expression levels of PTEN among T2DM compared with T2DM+C and HI. Dark gray column: PTEN expression >17.43. Gray column: PTEN expression <17.43. HI: Healthy individuals, T2DM: patients with Type 2 Diabetes Mellitus, T2DM+C: patients with Type 2 Diabetes Mellitus and cancer.

