


 Inglês (pdf)
 Artigo em XML
 Referências do artigo
 Enviar este artigo por email
 Citado por SciELO
  Similares em
SciELO
Similares em
SciELO 
 Permalink
INTRODUCTION
Despite the carbon sequestration provided through photosynthesis by agriculture, it still presents increased CO2 emission potential. Alterations due to soil usage and management may result in sustainability problems, e.g. soil organic matter degradation, which is directly reflected on physical and chemical attributes, in biodiversity and on greenhouse gases emission to the atmosphere (Suleiman et al., 2020; Li et al., 2021; Ma et al., 2021; Wang et al., 2021).
The reuse of wastewater from domestic sewage treatment systems has been intensified for agricultural purposes, mainly because of limitations of its correct destination and the possible nutrient offer and recycling, and the decrease of higher quality water demand. However, Siqueira et al. (1994) reported that organic waste deposition directly affects soil biological characteristics, since it is a source of carbon, energy, and nutrients for microorganisms. Per Araújo & Monteiro (2007), biological indicators such as soil respiration, biological nitrogen fixation, organic compounds mineralization, enzymic activity, and microbial biomass are useful tools for monitoring the soil microorganism community and quality.
Therefore, this study aimed at evaluating the CO2 evolution in a Red Eutrophic Latosol (Typic Eutrustox) fertigated with treated sanitary wastewater under “Prata-Anã” banana cultivation.
MATERIALS AND METHODS
Soil samples with deformed structure were collected from the 0-20 and 20-40 cm soil profile depths of a Red Eutrophic Latosol (Typic Eutrustox) under “Prata-Anã” banana cultivation. The experimental area is adjacently located to the Sewage Treatment Plant of the Minas Gerais Sanitation Company (COPASA) in Janaúba, state of Minas Gerais, Brazil (15º 49' 53'' S 43º 16' 20'' W, altitude = 540 m), which presents Aw climate per Köppen’s classification (tropical with dry winters).
The experimental design was randomized blocks arranged in split-plots with four replications. The main plot factors were the application of different tertiary treatment sanitary wastewater doses (TSW) considering the maximum annual application limit of 150 kg Sodium (Na) ha-1 (MAL) (Larcher, 2005), as follows: T1: Control (clean water + mineral fertilization (MF)); T2: 130% (TSW1), and T3: 200% TSW2 compared to the reference MAL. The subplot factors consisted of different soil respiration measurements along time (7, 14, 21, and 28 days).
The TSW applications were initiated on the 41st day after planting (DAP) with weekly applications through fertigation (micro sprinkle); after each application, the water amount was complemented to meet crop requirements. After the third month after planting, top dressing chemical fertilization was initiated through fertigation using Nitrogen and Potassium for Control and complementation for effluent treated plots, aiming at equally providing nutrients (similar doses) for plants in all plots.
Monthly, during applications, simple TWW samples were collected for analysis of total N, ammonia-N, nitrate-N, organic-N, K, Na, P, Zn, CU, Fe, Mn, B, Cl, Co, Ca, Mg, electrical conductivity, chemical oxygen demand, biochemical oxygen demand, oils and greases, total suspended solids, total coliforms and Escherichia coli. The Average characteristics of treated sanitary wastewater from June 2012 to June 2014 are presented in table 1.
Samples were collected three years after experiment installment from 0-20 and 20-40 cm depths and then forwarded to the laboratory, where 50 g of each sample were distributed in 500 cm³ hermetically sealed containers, which were stored under room temperature on a laboratory table. Simultaneously, 100 g sample-1 were used for soil moisture measurements.
Soil moisture was measured, and the sample moisture was corrected on the day after collection to 100% field capacity (respective 0.2746 and 0.2549 g g-1 for 0-20 and 20-40 cm depths). Two cups were placed with the soil in the containers: one containing 30 mL of water for moisture maintenance and another containing 30 mL of 0.5 mol L-1 NaOH solution, a trap solution that retains CO2 from the biological activity, forming a Na2CO3 solution.
After the 7th, 14th, 21st, and 28th days

from incubation initiation, a 10 mL aliquot was collected from the flask containing NaOH solution (previously incubated), transferred to a 125 mL Erlenmeyer flask and replaced by a new NaOH 0.5 mol L-1 solution flask. Each container was kept open during 15 minutes for air exchange, which is necessary for soil respiration. The flasks were then hermetically sealed for a new incubation process. This period was uniform for all samples.
The Erlenmeyer flask containing 10 mL of NaOH received 10 mL of BaCl2 for carbon precipitation and to avoid titration interferences, and three 1% phenolphthalein drops as a turn point indicator. Also, 0.5 mol L-1 sodium hydroxide, 0.25 mol L-1 hydrochloric acid, 0.05 mol L-1 barium chloride, and 1% phenolphthalein solutions were used.
Four control flasks (blank) were used to discharge the remaining CO2 from the system. Thus, the CO2 amount discharged from each sample was obtained through residual or non-reactive alkali titration, since all this gas was removed as BaCO3. The CO2 per 100 soil g results were obtained through calculations of the evolved C-CO2 during the sample monitoring period as follows:
In which:
B = mL volume of HCl used for blank titration.
V = mL volume of HCl used for NaOH titration in soil samples.
M = actual HCl concentration (mol L-1); 6 = carbon atomic mass (12) divided by CO2 mols reactive with NaOH (2).
V1 = total ml volume of NaOH used for CO2 capture.
V2 = ml volume of NaOH used for each titration.
Data was submitted to variance analysis and was considered significant until 10%; Tukey’s and regression tests were performed for interaction unfolding and isolated factors.
RESULTS AND DISCUSSION
The soil respiration evaluation in the 0-20 cm depth indicated that wastewater usage increased soil respiration regardless of the evaluation period, especially the highest tested dose (Table 2).

Table 2 - Soil respiration in the 0-20 cm depth of a Red Eutrophic Latosol (Typic Eutrustox) under ‘Prata-Anã’ banana cultivation per mineral fertilization and sanitary wastewater application in Janaúba-MG, Brazil.
These soil respiration increments possibly result from the presence and predominance of mineral Nitrogen in the TSW, acting as a substrate for microbial development in the soil; consequently, additional carbon amounts were used in metabolic processes by the existing microbial populations. Furthermore, it is important to emphasize that soil conditions favored soil respiration, e.g., moisture close to field capacity and proper temperature. Simões et al. (2013) verified that microbial activity increased with crescent treated domestic sewage effluent applications, presenting the lowest values for control (100% well water) in a distrophic cohesive Yellow Latosol under castor bean cultivation. Thiessen et al. (2013) highlighted that, similarly to TSW, C-enriched substrate increases the soil native organic matter decomposing, which results in the “priming” effect.
Soil respiration presented distinct behavior among both soil profile evaluated depths. In the 0-20 cm depth, soil respiration exponentially increased along the evaluated days regardless of being submitted to MF or TSW treatments (Figure 1). Therefore, there was a significant reduction of the soil C:N relation with carbon losses along time and consequent organic matter mineralization predominance.
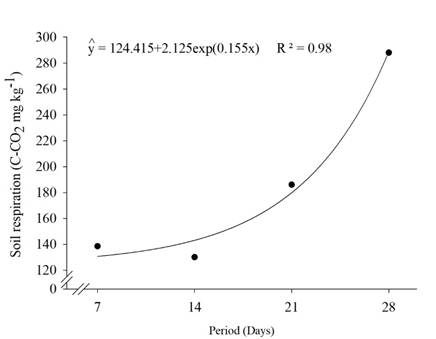
Figure 1 Soil respiration in the 0-20 cm depth of a Red Eutrophic Latosol (Typic Eutrustox) under “Prata-Anã” banana cultivation per treated sanitary wastewater (TSW) and mineral fertilization (MF).
There was interaction between control and wastewater treatments (TSW1 and TSW2), and the different evaluation periods in the 20-40 cm soil profile depth. Figure 2 reveals that soil respiration in the clean water and mineral fertilization (MF) treatment presented exponential behavior, tending to decrease and stabilize at 58.185 mg evolved C-CO2 kg-1 on the 28th evaluation day. Wastewater treatments, however, presented squared soil respiration behavior along the evaluated period with minimum respirations values estimated on the 18th day: respective 83.4 and 54.0 mg evolved C-CO2 kg-1 for TSW1 and TSW2 treatments.

Figure 2 Soil respiration in the 20-40 cm depth of a Red Eutrophic Latosol (Typic Eutrustox) under “Prata-Anã” banana cultivation per treated sanitary wastewater (TSW) and mineral fertilization (MF).
The soil respiration rate in the 20-40 cm depth evidenced from approximately the 18th day (Figure 2) possibly occurs due to mineralization of organic matter fractions with lower lability levels added to the soil using TSW. Some authors (Guimarães et al., 2014; Correia et al., 2015) reported that the different existing microbial populations and the substrate characteristics define soil respiration dynamics. Per Zou et al. (2005), labile organic carbon oxidizes in a simple negatively exponential pattern; thus, it is possible to infer that the MF treatment may have predominantly contributed with more easily decomposed fractions, since an exponential soil respiration decrease related to the evaluation period was verified in this study.
In this study, treated sanitary wastewater increased the soil respiration, which may contribute with additional CO2 for the atmosphere emission balance. However, contributions for wider range phenomena such as the greenhouse effect is conditioned to more complex experiments also considering the CO2 input into the system.
CONCLUSION
The assessment of soil respiration at a depth of 0-20 cm indicates that the use of wastewater increases soil respiration by 19.89 and 28.46%, respectively for treatments TSW1 and TSW2 in relation to the control treatment.
At a depth of 20-40 cm, the use of the control treatment promotes an exponential reduction in soil respiration, tending to decrease and stabilize at 58.185 mg C-CO2 kg-1 evolved on the 28th day of evaluation.
Treatments with wastewater present respiratory behavior in a quadratic behavior, with minimum respiratory values estimated on the 18th day, respectively 83.4 and 54.0 mg evolved C-CO2 kg-1 for treatments TSW1 and TSW2.
ACKNOWLEDGEMENTS
To the Montes Claros State University for the research conduction; To FAPEMIG, CAPES, and CNPq for the financial aid and scholarship grant.

