


Servicios Personalizados
Revista

Articulo
 Inglés (pdf)
 Articulo en XML
 Referencias del artículo
 Enviar articulo por email
Indicadores
-
 Citado por SciELO
Links relacionados
-
 Similares en
SciELO
Similares en
SciELO
Compartir

 Permalink
Revista de la Asociación Geológica Argentina
versión impresa ISSN 0004-4822versión On-line ISSN 1851-8249
Rev. Asoc. Geol. Argent. v.61 n.4 Buenos Aires oct./dic. 2006
Kendrick, E.1, Brooks, B.2*, Bevis, M.1, Smalley Jr., R.3, Lauria, E.4, Araujo, M.5 and Parra, H.6
1 Department of Geological Sciences, Ohio State University, 125 South Oval 275 Mendenhall Laboratory, Columbus, OH 43210, USA, Email: Kendrick.42@osu.edu
2 School of Ocean and Earth Science and Technology, University of Hawai'I, 1680 East-West Rd, Honolulu, HI 96822, USA, Email: bbrooks@soest.hawaii.edu
*corresponding author
3 Center for Earthquake Research and Information, University of Memphis, 3876 Central Ave Ste 1, Memphis, TN, 38152-3050, USA, Email: rsmalley@memphis.edu
4 Instituto Geográfico Militar Argentina, Cabildo 301, Buenos Aires, Argentina. Email: elauria@igm.gov.ar
5 Instituto Nacional de Prevencion Sismica, Roger Balet Norte 47. 5400 San Juan, Argentina, Email: maraujo@inpres.gov.ar
6 Instituto Geográfico Militar Chile, Dieciocho No 369, Santiago, Chile. Email: hparra@igm.cl
ABSTRACT
We present GPS measurements of the crustal velocity field in the southern Central Andes between the Santa Cruz corner and the Malargüe fold and thrust belt, and model this interseismic velocity field as the combination of an ephemeral, elastic signal associated with locking of the main plate boundary, and a steady and non-reversing component of displacement associated with localized backarc convergence and growth of the mountain belt. We find that this second component, i.e. the ongoing and permanent displacement of the forearc and the high Andes relative to the craton, can be modeled very well as a steady clockwise rotation of an Andean microplate about a pole located in southern Argentina. Near the Malargüe Basin, this microplate (or block) is moving nearly parallel to the strike of the orogen, transporting material towards the bend in the central Andes. Farther north, in the southern limb of the Central Andes, the motion of this same crustal block is directed nearly perpendicular to the strike of the mountain belt. Our results suggest that permanent deformation rates in the backarc range from a maximum of ~ 6-7 mm/yr in the Bolivian Subandes to less than ~ 3 mm/yr in the Argentine Precordillera and Malargue fold and thrust belt. It is likely that most active backarc deformation is accruing in a narrow zone (~ 50 km wide) associated with the backarc boundary (usually defined as the thrust front) though at this stage it is impossible to distinguish whether specific backarc structures are actively accruing strain.
Keywords: Crustal velocity field; Interseismic velocity; Deformation rates; GPS geodesy; Central Andes.
RESUMEN
Orogenia activa de los Andes centro-australes estudiada mediante geodesia de GPS. Se presentan mediciones GPS del campo de velocidad en los Andes centro-australes entre el extremo norte de Santa Cruz y la faja plegada de Malargüe. Se modela el campo de velocidad intersísmico como la combinación de una señal elástico/efímera asociada con el anclaje del límite principal de placas, y una componente constante, no reversible de desplazamiento asociada con una convergencia localizada en el retroarco y crecimiento del cinturón montañoso andino. Se encuentra que esta segunda componente, por ejemplo en el desplazamiento actual relativo al cratón del antearco y los altos Andes, puede ser modelada muy bien como una rotación horaria constante de la microplaca andina alrededor de un polo de Euler localizado en el sur de Argentina. Cerca de Malargüe, esta microplaca (o bloque) se mueve subparalelamente al rumbo del orógeno, transportando material hacia la inflexión de los Andes Centrales. Más al norte, en el sector austral de los Andes Centrales, el movimiento de este bloque es casi perpendicular al rumbo de la cadena montañosa. Se sugiere que las tasas de deformación permanente en el retroarco varían entre un máximo de ~ 6-7 mm/año en el Subandino Boliviano y menos de ~ 3 mm/año en la Precordillera Argentina y en la faja plegada de Malargüe. Es probable que la deformación activa más importante esté ocurriendo en una delgada faja (~ 50 km de ancho) asociada con el límite del retroarco (usualmente definido como el frente orogénico). En esta etapa, es imposible distinguir si estructuras específicas del retroarco está acumulando deformación.
Palabras clave: Campo de velocidades corticales; Velocidad intersísmica; Tasas de deformación; Geodesia GPS; Andes Centrales.
INTRODUCTION
It has long been recognized that great mountain belts are built, in large part, by contractional processes (Argand 1924, Schiller 1912). In the Andes, for example, much of the crustal thickening due to the most recent phase of Neogene orogenesis is attributed to tectonic shortening of the South American plate (Allmendinger et al. 1997, Isacks 1988, Kley and Monaldi 1998, Ramos 1988, Ramos et al. 1996). Although there is some question as to how much contraction has occurred in the internal portions of the mountain belt (Cristallini and Ramos 2000, McQuarrie 2002, Ramos et al. 1996) and the relative contribution of thinor thick-skinned structures to crustal shortening is still uncertain (Kley and Monaldi 1998), it is clear that during the last 10 Myr at least, the contractional belts along the eastern margin of the Andes (e.g. Baby et al. 1997, e.g. Zapata and Allmendinger 1996b), referred to as either the foreland or the backarc, have accommodated most of the shortening that has occurred between the Pacific coast and the stable interior of the South American plate. Localized backarc shortening continues today as evidenced by the concentration of shallow crustal seismicity (Smalley and Isacks 1990) (Fig. 1a) and the fact that the easternmost backarc contractional structures are usually the ones with evidence for most recent geological movements (Brooks et al. 2000, Chiaramonte et al. 2000, e.g. Costa et al. 2000, Siame et al. 2002, Zapata and Allmendinger 1996a). However fundamental questions regarding the kinematics and geodynamics of Andean orogenesis still remain. For instance, what is the distribution of anelastic deformation across the mountains and in the backarc? At any given time, is deformation uniform or is it focused on specific structures that may be seismically active? How does shortterm deformation contribute to the longterm growth of the mountains and how do long-, intermediate-, and short-term rates compare to one another? This is also a question of substantial practical importance, particularly for seismic hazard assessments in the backarc, which has been the site of large and/or damaging earthquakes (Castano 1995, Funning et al. 2005, Kadinsky- Cade et al. 1985).
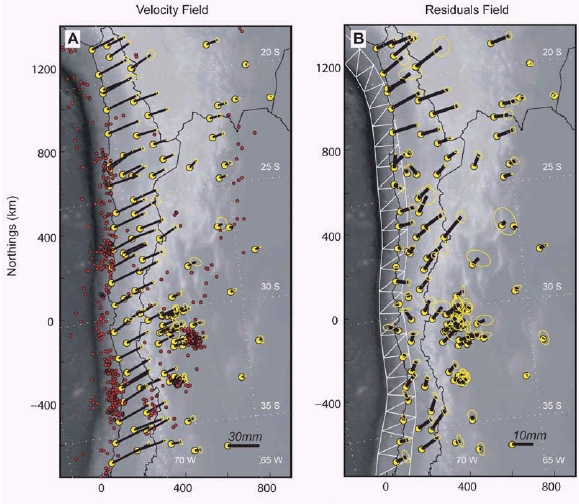
Figure 1: a) GPS velocity field superimposed on Andean topography. Yellow dots represent station locations; black lines, velocity vectors; yellow ellipses, 95% confidence ellipses; red dots, shallow crustal seismicity (< 30km ) from the catalog of Engdahl (Engdahl et al. 1998). The map (and those following) is presented in a transverse mercator projection with an origin chosen at 30°S, 70°W. b) Residual velocity field when the displacement field from a fully locked Nazca boundary is removed from the data in A. White triangles are the dislocation elements used to approximate the plate boundary locking displacement field with the upper (-10 km) and lower (-50 km) boundaries constrained by earthquake catalogs (Cahill and Isacks 1992).
Over the past decade, the growth and maturation of large regional GPS geodetic networks, such as CAP (Central Andes Project) (Bevis et al. 2001, Bevis et al. 1999, Brooks et al. 2003, Kendrick et al. 2001, Kendrick et al. 2003, Kendrick et al. 1999, Smalley et al. 2003), SAGA (South American Geodyamic Activities) (Angermann et al. 1999, Khazaradze and Klotz 2003, Klotz et al. 1999, 2001), and to a lesser degree SNAPP (South America - Nazca Plate motion Project) (Norabuena et al. 1998, Norabuena et al. 1999), has illuminated the active deformation of the Andes from the Santa Cruz bend in Bolivia to the southern tip of South America. Coastal GPS stations near the Nazca-South America plate boundary move towards the stable craton at rates of 30 - 40 mm/yr while stations in the backarc move towards the craton at a third of this rate, or even more slowly (Fig. 1a). The interpretation of the GPS measurements is greatly complicated by the fact that the interseismic velocity field is (in very large part) the superposition of two distinct modes of deformation: (1) ephemeral, elastic earthquake-cycle deformation caused by locking at the Nazca-South America plate boundary, and (2) ongoing accumulation of permanent deformation including back-arc contractional processes. Most geophysicists agree that the elastic component of deformation dominates the present day crustal velocity field within the forearc, but in the backarc the permanent component of deformation accounts for more than half of the observed velocity field (Bevis et al. 2001, Brooks et al. 2003, Liu et al. 2000).
Whereas the SNAPP group has inferred that the main plate boundary is only partially locked during the interseismic phase of the earthquake deformation cycle (Norabuena et al. 1998), both the CAP and the SAGA teams have concluded independently that the main plate boundary is fully locked, which is hardly surprising given the extremely high rate of seismic energy release along this plate interface (Bevis et al. 2001, Brooks et al. 2003, Khazaradze and Klotz 2003).
Different models have been proposed for the ephemeral and non-ephemeral (or 'permanent') modes of deformation. Liu et al. (2000) modeled the SNAPP data from the central Andes with a viscoelastic rheology driven by different velocity boundary conditions (32-35 mm/yr and 12 mm/yr) at different time-scales (< 102 and >106 years) and additional forces associated with topography. In this model the instantaneous crustal velocity field, which declines linearly with distance from the trench, manifests elastic strain accumulation which is eventually released in earthquakes. In contrast, the long-term behaviour of the system is that of a viscous fluid. This long term deformation field involves arc-normal contraction of the submarine forearc region, arc-normal extension of the Altiplano, and arc-normal contraction of the foreland (or backarc) fold and thrust belt. According to Liu et al.'s (2000) model the geological or permanent stretching rate in the Altiplano is comparable in magnitude to the rate of foreland shortening, a finding that many geologists would find hard to accept. We see two additional difficulties. First, Liu et al. (2000) compared their model velocities with the geodetic velocity solution of Norabuena et al. (1998) which was shown by Kendrick et al. (2001) to have a large ~7.5 mm/yr eastward velocity bias. Second, shortening of the foreland in Liu et al.'s model is achieved by bulk or pervasive shortening of the entire plate. But there is a large body of geological evidence indicating that shortening within the foreland is dominated by shearing localized on a regional detachment surface or decollement that underlies a thrust belt or wedge. Naturally, no model in which a plate is acting as a fluid is capable of reproducing a discontinous subsurface velocity field of the kind associated with a decollement. Liu et al's (2000) mathematical model is sophisticated, but it ignores and is inconsistent with the established tectonic framework of the foreland fold and thrust belt.
Lamb (2000) recognized that this heterogeneity of deformation in a vertical section through the lithosphere violated the condition of homogeneity assumed when applying a thin viscous sheet model (England and McKenzie 1983) of deformation to the Neogene-modern velocity field in the Bolivian Andes. He suggested that vertical and horizontal lithospheric viscosity variations could be invoked to better explain the late Miocene-recent velocity field. Additionally, in forming his Late Miocene-recent velocity field for the Bolivian Andes from a combination of geologic and space geodetic data, Lamb (2000) acknowledged both the velocity bias in the Norabuena et al. (1998) data as well as the plate boundary locking contribution to the geodetically determined velocities. His method, however, removed geodetic reference frame issues by considering relative velocities in a triangular network of points and, at the time, the reported 1-sigma errors in the velocity data were large enough (± 5 mm/yr) so that the elastic effect, especially in the backarc, was within the errors.
Using more recently collected data with longer occupation times, we have modeled the composite velocity fields of the central (Bevis et al. 2001) and south-central Andes (Brooks et al. 2003) without invoking viscous behaviour in the lithosphere. We have assumed that the interseismic velocity field arises through the superposition of two quite distinct patterns of motion and deformation: ephemeral elastic signals driven by locking of the main plate boundary superimposed on asteady velocity field associated with progressive backarc convergence (described by the kinematics of rigid microplates or blocks). Our earlier models cited above, which can certainly be criticized as simplistic, were able to mimic the GPS velocity field with RMS misfits of a few mm/yr or less, despite being equipped with relatively few degrees of freedom. Our results suggest that the permanent component of deformation within presently accumulate in this plate boundary zone is consistent with a rigid Andean block overthrusting the South American craton at rates on the order of ~3-6 mm/yr. These results broadly agree with the analysis of the SAGA data set (Khazaradze and Klotz 2003) as well as with some estimates of the most recent geological shortening rates in the Argentine Eastern Precordillera (Zapata and Allmendinger 1996a) although, generally, reported geological shortening rates across the entire backarc contractional belts tend to be higher (~10-12 mm/yr) (Echavarria et al. 2003, Sheffels 1990, Zapata and Allmendinger 1996a). Our analysis implies that active deformation in the backarc is focused on a narrow zone (< ~50 km wide) near the backarc thrust frontal zone; in other words, it does not appear that out of sequence deformation of more hinterland thrust sheets is currently detectable with GPS in the regions studied.
In this paper, in order to test if the conclusions of rigid Andean block motion and deformation accomodated in a narrow zone at the thrust front are applicable across large portions of the entire Andes mountain chain, we extend our earlier analyses and model the geodetic velocity field from the Santa Cruz bend in the Central Andes to the Malargue fold and thrust belt. The model domain is close to 2000 km long (along strike) and over 800 km wide.
GPS DATA & NAZCA BOUNDARY LOCKING
It is worthwhile here to review briefly the most pertinent aspects of GPS geodesy in the above context of imaging permanent deformation associated with Andean orogenesis. The GPS data from the Andes to date comprise two main types: CGPS (continuous GPS) and SGPS (survey GPS). CGPS sites operate on a continuous basis, while SGPS sites are occupied only occasionally (typically every 2 or 3 years) for periods of one to several days. The CGPS sites form the reference backbone with respect to which we position the SGPS sites using a strategy called MOST (Multimodal Occupational Strategy) (Bevis et al. 1997). Because of their massive temporal averaging, CGPS data are more accurate than SGPS data. Once a CGPS station has been established for 4 years or more, its horizontal velocity estimates are accurate at 1-2 mm/yr level, though the uncertainties associated with vertical velocity estimates are 2- 3 times larger. Most published studies, however, cite mainly SGPS data because CGPS costs are so high that SGPS networks are far denser. SGPS data quality are more variable because of their short occupation times and they are more susceptible to error sources such as equipment setup, atmospheric anomalies that may be spatially or temporally correlated over the time periods of observation, and annual deformation components related to hydrological loading effects (Bevis et al. 2005).
Accordingly, in the Andes, when interpreting interseismic deformation (i.e. not the large cm-m scale coseismic motions that attend large earthquakes, Klotz et al. 1999) we only consider SGPS data that have three or more occupations and a total time span greater than 3 years. Furthermore, with SGPS data, we have to date only considered horizontal displacements because the error sources in the vertical (particularly the hydrologic ground noise) are currently too poorly constrained and time series too short to establish reliable average rates. As we note below, for regions of high-angle basement faulting such as the Sierras Pampeanas, the vertical signal could be particularly illustrative. We are not aware, however, of contemporaneous geophysical studies aimed at resolving short-term vertical motions using more traditonal techniques such as leveling (Kadinsky-Cade et al. 1985). We installed the network of SGPS and CGPS stations presented here between 1993 and 1997. SGPS measurements were carried out from 1993 to 2001 in sessions of at least 40 hours over consecutive days. Our field, processing, and velocity analysis methods have been described previously (Bevis et al. 1997, Bevis et al. 2001, Kendrick et al. 2001). We realize a craton-fixed frame nominally attached to stable South America (Fig.1, inset) with a root mean square (RMS) residual velocity of better than 1.0 mm/yr.
The principal characteristic of the GPS field is its smoothness, both across- and along-strike, yet one of the fundamental characteristics of Neogene Andean backarc geology south of the Arica bend is that it is strongly heterogeneous in terms of shortening style, inherited structures, and inferred geodynamic controls (e.g. Kley and Monaldi 1998). Generally, velocities are directed eastwards towards the craton (Fig. 1). They are largest (~35 mm/yr) near the coast, closer to the Nazca boundary, and decline towards the craton. South of the Santa Cruz bend, backarc vectors tend to be rotated clockwise with respect to those in the forearc (Bevis and Martel, 2001). As we noted previously (Brooks et al. 2003), the velocity field shows no obvious or abrupt change in character associated with the changing dip of the subducted Nazca plate (Fig.1).
We estimate the ephemeral elastic displacements driven by locking of the plate interface in the subduction boundary using an elastic dislocation model. It is assumed that these displacements will be fully recovered by the major plate boundary earthquakes that frequently occur along the Chile trench (Klotz et al. 1999). This model is based on the backslip formalism of Savage (1983) and it is implemented using triangular dislocations as discussed in Bevis et al. (2001) (Fig. 2). The principal source of error in this type of modeling is that the calculations are carried out in an elastic half-space with no earth-like horizontal boundaries such as the base of the lithosphere and crust. Nonetheless, close to the plate boundary, the half-space and other more sophisticated modeling techniques such as Finite Element Models (FEM) (Williams and McCaffrey, 2001) yield similar results; the main differences occur farther from the trench.
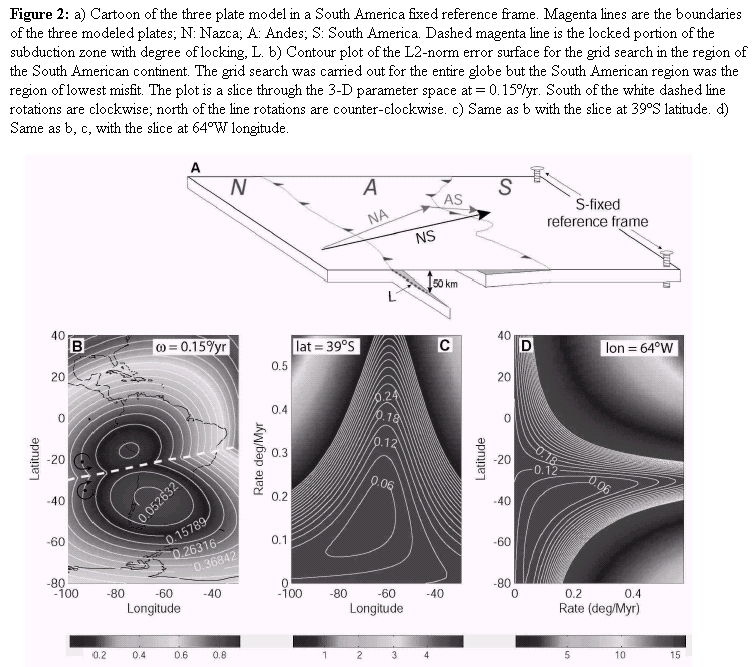
Figure 2: a) Cartoon of the three plate model in a South America fixed reference frame. Magenta lines are the boundaries of the three modeled plates; N: Nazca; A: Andes; S: South America. Dashed magenta line is the locked portion of the subduction zone with degree of locking, L. b) Contour plot of the L2-norm error surface for the grid search in the region of the South American continent. The grid search was carried out for the entire globe but the South American region was the region of lowest misfit. The plot is a slice through the 3-D parameter space at = 0.15º/yr. South of the white dashed line rotations are clockwise; north of the line rotations are counter-clockwise. c) Same as b with the slice at 39ºS latitude. d) Same as b, c, with the slice at 64ºW longitude.
We assume that the plate interface is fully locked all along the Nazca plate boundary to a depth of 50 km, as we inferred in our previous studies (Bevis et al. 2001, Brooks et al. 2003), a conclusion also made by Khazaradze et al. (2003) in their analysis of the SAGA network. Lamb and Davis (2003) have suggested that this high degree of coupling, i.e. nearly complete and perfect locking of the plate interface, has arisen because of the sediment-starved condition of the trench since 20 Ma. The lower limit of ~50km for the coupling zone is broadly agreed upon by various seismological studies (Pacheco et al. 1993, Petersen et al. 1996). Whether locking is constant down dip or not is a subject of some debate, but for the purposes of our analyses it is a second order effect and one which does not change the fundamental nature of our conclusions.
In Figure 1b we present the residual velocity field obtained by removing the velocity component due to full locking of the Nazca boundary. Because the component due to locking is an ephemeral signal that will be recovered by Chile trench earthquakes, we argue that this field describes the general kinematics of the permanent component of deformation captured over the ~8 years of GPS data. The residual field is characterized by ~north-directed vectors in the southern Andes and east-directed vectors in the central Andes. Peak magnitudes reach ~13 mm/yr near the Chilean coast. Qualitatively, this pattern mimics either a clockwise horizontal rotation of material about a pole in Argentina or flow of material from the south towards the north and east. We claim that this residual field is a fundamental characteristic of current Andean deformation. Local details of the field will surely be dependent on the choice of a model used to describe Nazca boundary locking, but the general clockwise rotational character will remain. In order to more quantitatively investigate this residual field we explicitly model it in the following section.
INVERTING THE GPS VELOCITY FIELD
METHODOLOGY
As in our earlier papers, we consider the crustal velocity field in the Andes in a frame of reference attached to the stable interior of the South American plate, and assume that it is composed of an elastic signal (driven by locking of the main plate boundary) that eventually reverses itself in major earthquakes (e.g. Savage 1983), plus a steady component of motion due to ongoing, continuous convergence of the Andes and the craton (achieved by creep of the decollement). This second, 'geological' component never self-reverses, but constitutes permanent relative displacement. We model the ephemeral component as an elastic perturbation superimposed on steady plate convergence. We model the geological component using the kinematical theory of plate (or microplate or block) motion on a spherical earth (Bevis et al. 2001, McCaffrey 2002). We note, as an aside, that because of some confusion about our earlier terminology, we now use the word block instead of plate motion to describe the long term average motion of the Andes relative to the craton. The difference is semantic: there is no difference in the way we are modeling the kinematics of a block and a plate (we use Euler's theorem). Nonetheless, we acknowledge that the term plate may suggest to some readers that the Andean block discussed here has been rigid for tens of millions of years, which is something that we do not claim in this context.
To find the elastic component (Ue) of the model displacement field we implement our calculations using triangular dislocation elements in an elastic half-space (Bevis et al. 2001). Triangular dislocations best reproduce the smoothly curving geometry of the subduction zone in this ~2000km long stretch of the Andes. To find the permanent component (Up) of the model we define an Andean block (A) located between the Nazca (N) and South America (S) plates. We assume that the A-S boundary creeps continuously at a constant rate on what we envision as a sub-horizontal décollement rooted at deeper crustal levels beneath the Andean arc, though as noted by Bevis et al. (2001), this subsurface geometry does not enter into the calculations themselves. Up is then the surface velocity for the A block which we calculate using Euler vectors (w,Cox and Hart, 1986) subject to the constraint that:
wNS = wNA + wAS (1).
When we superpose Ue and Up the velocity field in A is the combination of elastic loading and steady A-S plate convergence, whereas in S all motion is due to elastic loading.
The eastern boundary of the A block is subjectively chosen to correspond to our best knowledge of the position of the active Andean thrust front (e.g. Costa et al. 2000). Moreover, the calculations do not depend on, nor imply, vergence of specific structures at the thrust front. Because the thrust front stretches for such a long distance and well-defined Quaternary deformation rates are only available from a small number of sites along this distance, the geometry of the boundary may be poorly constrained in sections. Where GPS station spacing is dense we have taken care define the boundary as precisely as possible. Where station spacing is sparse, however, the precise location of the surface trace does not affect the model results. Moreover, the point of our analysis is not to attempt to solve for the spatial location of the thrust front at the current time; rather, it is to try to assess issues such as the partitioning of ephemeral and permanent modes of motion and deformation, and the lateral variations of the deformation field. We employ a simple grid search for our inversion. By using the assumptions described in section 2 of full-locking to 50 km depth and by fixing the value of wNS (61.1° N, 93.6° W, 0.57°/Myr) from our previous GPS-based analysis of Nazca-South America convergence (Kendrick et al. 2003) we can reduce the number of unknown parameters in the inversion to the three parameters describing wAS and it becomes computationally feasible to use a grid search as the inversion approach. Grid searches are always preferable to other inversion methods because of their complete examination of parameter space and their ability to address resolution and uniqueness a posteriori.
At each grid point in the 3-dimensional parameter space, the inversion comprises the following steps: (1) assign wAS and its corresponding Up; (2) solve for wNA in equation 1; (3) use wNA to define the Burger's vectors (direction and magnitude of slip) on the dislocations defining the Nazca boundary; (4) from the Burger's vectors in (3) evaluate the forward problem to find Ue; (5) estimate misfit using an L2 norm; (6) proceed to the next grid point.
INVERSION RESULTS
The grid search finds a well-defined global minimum with a best-fit AS pole at 39°S and 64°W in south-central Argentina and a clockwise rotation rate of 0.15°/Myr (Fig. 2a). There is also a local minimum associated with counterclockwise rotation and an AS pole north of the Arica bend. Slices through the best model position in wAS longitude/ wAS rate space (Figure 2b) as well as wAS rate/wAS longitude space (Fig. 2c) confirm the uniqueness of the best solution. Further, geological data demonstrating counterclockwise rotations north of the bend and clockwise rotations south of it (e.g. Allmendinger et al. 2005, e.g. Lamb 2000) give added preference to the southern solution.
In figure 3a we plot along with the data, the predicted horizontal vectors from the best model, which we call NAS-3. NAS-3 captures all of the first order features of the horizontal velocity field including the magnitude of decrease with distance from the trench as well as the more eastward-directed displacements with distance from the trench. The latter phenomenon, as described in Bevis and Martel (2001), is an effect of oblique convergence that can be explained by a more rapid decay towards the backarc of trench parallel displacement in comparison to trench perpendicular displacement.
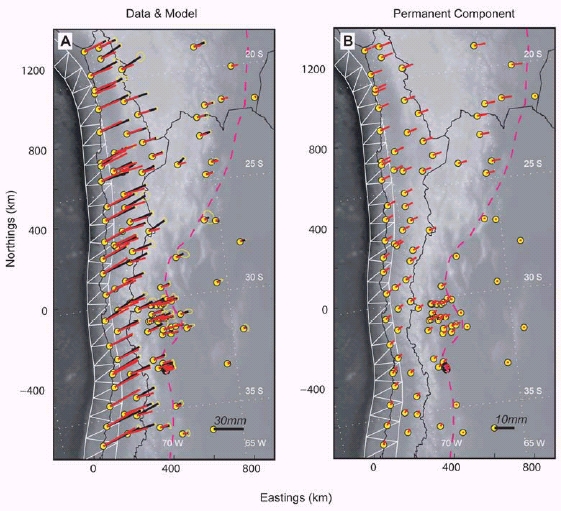
Figure 3: a) GPS velocity field from NAS-3, data (black vectors), best 3-plate model (red vectors) superimposed on Andean topography. Magenta line denotes the eastern boundaries of the modeled 'Andean' plate, with the hachures on the overthrusting plate. The green circle represents the position of the NAS-3 pole from the grid search (described in Fig. 2). b) Plot of predicted permanent component of deformation (Up) from the NAS-3 model.
Figure 3b shows just the permanent component, Up, of the NAS-3 model. In a similar fashion to the residuals from the trenchlocking elastic model (Fig. 1b) the predicted Up field displays clockwise rotation of points about a pole indicated in the lower right-hand corner of Figure 3b. Total predicted horizontal velocity magnitudes range from 1.6 to 6.7 mm/yr, while trench perpendicular components range from 0.6 mm/yr in the south to 6.3 mm/yr in the north (Fig. 5).
DISCUSSION
IMPLICATIONS FOR ANDEAN EVOLUTION
In figure 4 we compare the latitudinal variation (normalized by the maximum value) of our modeled backarc permanent shortening rate, Up, with Kley and Monaldi's (1998) compilation of geologic estimates of backarc shortening from balanced cross-sections and the equivalent shortening curve based on the crustal cross-sectional area from Isacks (1988). Both the equivalent shortening and the NAS-3 predicted Up decrease monotonically from a maximum near 16ºS and both curves strongly coincide with one another, except for a small deviation in the equivalent shortening curve between 20º and 25º S. In apparent contrast to this, the shortening profile derived from geological balanced cross-sections does not follow the same trend as the model Up or crustal cross-section curves; rather, it decreases towards the south where it reaches a minimum at 25º S and then increases again near 30º S.
Figure 4: Normalized magnitude versus latitude for: grey line, equivalent shortening curve derived from crustal cross-sectional area (from Kley and Monaldi 1998; after Isacks 1988); yellow dots, predicted trench perpendicular component from the NAS-3 model; red dots, Neogene shortening estimates from balanced cross-sections (compiled by Kley and Monaldi 1998).
We find it unlikely that the agreement between the modeled Up and the equivalent shortening curve is pure coincidence. While the Up curve is not sensitive to changes in AS rotation rate (changes in rotation rates will not change the slope of the curve) it is sensitive to changes in the AS pole position, particularly its latitude. AS pole latitude changes of ~ 1 degree and longitude changes of ~10 degrees will alter the predicted Up curve enough so that there is visual disagreement with the equivalent shortening curve. In order for the two curves to be causally related, however, there must be minimal pre-Neogene contribution to the cross-sectional area. In support of this, in a review of paleoelevation data from the Central Andes, Gregory-Wodzicki (2000) concludes that the Altiplano-Puna plateau had attained no more than a third of its 3700 m current elevation by 20 Ma.
Isacks (1988) argued that the growth of topography that constitutes the modern Central Andes was very largely achieved by crustal shortening, and that latitudinal variation in the rate of shortening imposed the curvature of this orocline and the vertical axis rotations preserved in the paleomagnetic record (see also Allmendinger et al. 2005). Practically all writers agree that the fundamental driver of this crustal shortening was Nazca - SoAm plate convergence. Clearly this is not a complete explanation. Three additional factors are frequently cited: (i) the average rate of subduction at this boundary since 25 - 20 Ma has been unusually high for a continental arc (Pardo- Casas and Molnar, 1987) (ii) major weake - ning of the leading edge of the SoAm plate by its long history of subduction (Isacks, 1988), and (iii) consistently strong coupling across the plate interface (Dewey and Bird 1970). Lamb (2003) proposed that strong interplate coupling has been controlled by climatic conditions that have starved the trench of sediments, thereby ensuring that the plate interface is very poorly lubricated. The position of the Euler pole describing Nazca-South America convergence (and, accordingly, the direction of convergence at the boundary) have changed very little (Gephart 1994, Kendrick et al. 2003, Pardo- Casas and Molnar 1987, Somoza 1998) (Fig. 5a). The convergence rate, however, has steadily declined from ~150 mm/yr between 20 and 25Ma to between 60-65 mm/yr currently (Angermann et al. 1999, Kendrick et al. 2003, Norabuena et al. 1999, Somoza 1998) (Fig. 5b). While the magnitude of the maximum subduction rate has declined with time, at any given epoch the maximum rate of Nazca-SoAm plate convergence has always occurred near the middle of the Central Andes Kendrick et al. 2003). If Andean deformation is fundamentally driven by plate convergence, it is reasonable to expect that along-strike variation of backarc deformation also peaks towards the central portion of the Central Andes (although climate conditions could perturb this coincidence to a certain degree).

Figure 5: a) Euler pole positions from NUVEL-1A; the finite rotations obtained by Somoza (1998) and Pardo-Casas and Molnar (1987) (PC&M87) for 4.9-0 Ma (Somoza only) and 10.8-0 Ma; and derived from GPS measurements from Kendrick et al. (2003). b) The Nazca-SoAm rotation rate versus time, after Kendrick et al. (2003). The average rotation rates implied by the various stage poles of Somoza (1998) and Pardo-Casas and Molnar (1987) are plotted at the midpoint of the averaging interval. The horizontal lines indicate the associated time intervals. Also shown are the NUVEL-1A rate and the GPS rate from Kendrick et al. 2003. The error bars for the Kendrick et al. 2003 solution are too small to be easily visible at the scale of the plot.
So while the latitudinal variation of Up and the shortening curve are very simlar once the two curves are suitably normalized, neither of these curves looks anything like the balanced cross-section curve (no matter how it is normalized) since it has great departures from linearity (Fig. 5). We consider the most likely explanations either: (1) the uncertainties or error bars associated with the balanced cross-section measurements may be so large that the discrepancy with the other curves is not statistically significant, or (2) there are significant contributions to permanent deformation on geological timescales accommodated by processes other than thrusting and folding in backarc contractional belts (after Kley and Monaldi 1998). We suggest that it is more probable that most of the discrepancy lies in the balanced cross-section reconstructions for two reasons. It is very difficult to determine formal estimates for the measurement errors or uncertainties associated with shortening estimates derived from balanced cross-sections, even when there is a wealth of complementary geophysical data (e.g. Brooks et al. 2000). The technique of balanced cross sections often involves difficult-to-justify or difficult-to-quantify assumptions such as the lack of transport in the direction perpendicular to each section, how the subsurface dip of a decollement varies with depth (using thin-skinned or thick-skinned models), or how much shortening is underestimated when a minimum shortening value is reported (e.g. Woodward et al. 1989). Because Kley and Monaldi's compilation included estimates from multiple authors each using distinct techniques and assumptions, actually tracking and propagating the errors associated with each balanced cross-section is not really viable, especially considering that realistic estimates of uniqueness and uncertainty were not reported in the original references. Second, the strong agreement between our modeled Up and the equivalent shortening curves (after normalization) adds support to the notion that time-integrated shortening within the Bolivian Subandes varies quite smoothly south of the Santa Cruz corner.
IMPLICATIONS FOR BACKARC ACTIVE TECTONICS
Because of the GPS technique's generally stated horizontal resolution of a 1-3 mm, it is tempting to try and interpret the data in terms of activity in particular backarc regions or on particular structures. This is difficult at this stage, however, because of the relative sparseness of the GPS stations and because of the relatively slow backarc rates in comparison to the resolving power of GPS measurements.When we consider that total backarc horizontal velocities (including the plate-boundary ephemeral signal, i.e. Ue) are of order < 10 mm/yr, then the maximum velocities related to backarc deformation are likely less than ~ 5 mm/yr and velocity differences (those related to backarc strain) are of the order of less than a few mm/yr which approaches the resolution of the technique itself. Of course, the situation will improve: the longer we observe using GPS, the lower the error levels associated with our velocity measurements. In light of this, the most important implications of the NAS-3 model in terms of backarc active tectonics are: (1) active deformation in the backarc is focused in a very narrow zone near the boundary between the 'Andean' region and the South Ame-rican craton and there is little permanent shortening accumulating west of the Boli-vian Subandes and Precordillera; (2) backarc shortening rates increase from ~1 mm/yr in the south to ~ 6mm/yr in the north; (3) the permanent component of the relative displacements across the backarc zone of deformation implies transpressive straining within the southern portion of this zone, and coaxial straining farther north; and (4) other 'active' regions, such as the Sierras Pampeanas, do not exhibit any currently detectable signals of (horizontal) strain accumulation.
Of these implications, the first and second essentially agree with geological and geophysical results to within an order of magnitude, which we contend is the appropriate scale of comparison at this time. As noted previously (Brooks et al. 2003), recorded backarc crustal earthquakes occur predominantly in a narrow band associated with the eastern foothills of the Andes, and this is also the area of the most focused Quaternary deformation (Fig. 1a) e.g. Costa et al. 2000, Siame et al. 2002). Over geologic time scales, most workers would agree that the dominant portion of backarc deformation has been focused at the thrust front such as Argentina's Precordillera during the Neogene (e.g Zapata and Allmendinger 1996b). Furthermore, although there is a suggestion that GPS-determined permanent shortening rates are slightly lower than geologically determined ones (e.g. Hindle et al. 2002) we consider the uncertainties in both data sets (particularly the difficult-to-quantify geologic data sets) to be too large to place much certainty on a rate discrepancy, at least today.
The predicted varying of strain conditions in the backarc is one that can be compared with large data sets of fracture orientations, fault slip indicators, and detailed studies of backarc earthquake focal mechanisms. For instance, Dewey and Lamb (1992) show that co-seismic backarc shortening directions in our region of study are roughly coaxial with the plate convergence direction. However, as demonstrated by the GPS velocity field and discussed by us previously (Bevis et al. 2001, Bevis and Martel 2001, Brooks et al. 2003) backarc velocities are rotated clockwise by more than 10 degrees from the Nazca-South America convergence direction. The Dewey and Lamb (1992) study had a regional focus, and in order to best evaluate latitudinal variation in back-arc strain accommodation more focused and up-to-date studies need to be undertaken.
The fourth implication, that the Sierras Pampeanas show no detectable signs of pemanent deformation, is perhaps the most interesting and enigmatic. In the past 150 years, several earthquakes greater than M 6 have occurred across the Sierras Pampeanas (1944 Ms 7.4 San Juan, 1977 M 7.7 Caucete, 1936 San Martin and 1934 M 5.5, 6.0 Sampacho) (Costa, 1995, Costa et al. 2000, 1999; Costa and Vita-Finzi 1996). Moreover, the Sierras Pampeanas have certainly been the site of large finite strains since their initial deformation ~ 6-10 Ma (Costa and Vita-Finzi 1996, Coughlin et al. 1998). Yet, our GPS results suggest that Sierras Pampeanas strain rates are close to an order of magnitude less than the neighboring Precordillera to the west: across the entire Sierras Pampeanas (distance of ~400 km), trench-perpendicular velocity differs by less than 2mm whereas the displacement gradient at the Mendoza Precordillera thrust front is ~3-4 mm/yr of trench-perpendicular velocity over ~20-30 km. Moreover, when considering that essentially none of the Sierras Pampeanas sites have velocities greater than their errors when the plate boundary locking signal is removed (Fig. 1b), the entire Sierras Pampeanas horizontal velocity field can be explained as an ephemeral elastic effect from a fully-locked Nazca plate boundary. Perhaps modern displacements associated with the high angle faults of the Sierras Pampeanas (Costa and Vita-Finzi 1996) are largely vertical in nature, and thus are not manifested in the horizontal velocity field obtained using GPS.
We suggest that understanding if the Sierras Pampeanas are currently deforming, and if that deformation is truly contemporaneous with Precordillera deformation, is a fundamental question in lithospheric deformation that has important implications for seismic hazards assocated with some of Argentina's population centers. For instance, one expects to need a very powerful vice to compress a craton so strongly that the entire crust fails as in the Sierras Pampeanas, and competing mechanisms have been proposed: one is that a fully locked subduction boundary, such as the Nazca boundary for the Andes, transmits end-load compressional stresses across the mountain belt and into the craton as implied by geometric models (e.g. DeCelles 2004); another is that tractions associated with the interface between a flat slab and the base of the overriding lithosphere produce the necessary compressional stresses (Bird 1998). In the Andes, the apparent contemporaneity of both thin- and thick-skinned shortening, at least over geological timescales (Jordan and Allmendinger 1986), creates a further mechanical conundrum: would not the shortening in the thin-skinned region alleviate the significant compression needed to form the thick-skinned ranges? This is an avenue of future research that is best addressed by densifying the GPS networks and by installing continuous GPS stations so that vertical signals may be studied. Additionally, SAR Interferometry (InSAR) (e.g. Euillades et al. 2005, Pritchard and Simons 2002) studies covering wide swaths will be invaluable to determining if the Sierras Pampeanas are actively deforming or not.
ACKNOWLEDGEMENTS
Funding provided by NSF grants EAR- 9115576 and EAR-9615393. We gratefully acknowledge the many people whose work with us in in the field made this paper possible. These include but are not limited to: A.A. Garcia, B. Knight, R. Barriga, W. Rubio, P. Gallardo, J. Baron, M. Blanco, P. Euillades, L. Euillades, V. Bonfils, G. Cabrera, C. Gardini, J. Argento, S. Bea, J. Yu, M. Burns, and M. Patrick. Additionally we thank C. Vita-Finzi and E. Cristallini for thorough reviews which significantly improved the manuscript.
WORKS CITED IN THE TEXT
Allmendinger, R.W., Smalley Jr., R., Bevis, M., Caprio, H. and Brooks, B. 2005. Bending the Bolivian orocline in real time. Geology, 33 (11): 905-908. [ Links ]
Allmendinger, R.W., Jordan, T.E., Kay, S.M. and Isacks, B.L. 1997. The evolution of the Altiplano- Puna plateau of the Central Andes. Annual Review of Earth and Planetary Sciences 25: 139-174. [ Links ]
Angermann, D., Klotz, J. and Reigber, C. 1999. Space-geodetic estimation of the Nazca- South America Euler vector, Earth and Planetary Science Letters 171: 329-334. [ Links ]
Argand, E. 1924. La tectonique de l'Asie. In Comptes Rendu 3º Congress International Geologie (Liege) edited by A. V. Carozzi, 218 p., Hafner Press, New York. [ Links ]
Baby, P., Rochat, P., Mascle, G. and Herail, G. 1997. Neogene shortening contribution to crustal thickening in the back arc of the Central Andes. Geology 25: 883-886. [ Links ]
Bevis, M., Alsdorf, D., Kendrick, E., Fortes, L., Forsberg, B., Smalley Jr., R., and Becker, J. 2005. Seasonal fluctuations in the weight of the Amazon River system and Earth's elastic response: Geophysical Research Letters 32: 32. [ Links ]
Bevis, M., Bock, Y., Fang, P., Reilinger, R., Herring, T., Stowell, J., and Smalley, R.J. 1997. Blending Old and New Approaches to Regional Geodesy: Eos, Transactions, American Geophysical Union 78(61): 64-66. [ Links ]
Bevis, M., Kendrick, E., Smalley, R.J., Brooks, B., Allmendinger, R., and Isacks, B. 2001. On the strength of interplate coupling and the rate of back arc convergence in the central Andes: An analysis of the interseismic velocity field. Geochemistry, Geophysics, Geosystems 2. [ Links ]
Bevis, M., Kendrick, E.C., Smalley Jr., R., Herring, T., Godoy, J., and Galban, F. 1999. Crustal motion north and south of the Arica deflection: Comparing recent geodetic results from the Central Andes: Geochemisty, Geophysics, Geosystems 1. [ Links ]
Bevis, M., and Martel, S. (2001). Oblique plate convergence and interseismic strain accumulation, Geochemistry, Geophysics, Geosystems 2. [ Links ]
Bird, P. 1998. Kinematic history of the Laramide Orogeny in latitudes 35 degrees-49 degrees N, Western United States. Tectonics 17: 780-801. [ Links ]
Brooks, B., Bevis, M., Smalley, R.J., Kendrick, E., Manceda, R., Lauria, E., Maturana, R., and Araujo, M. 2003. Crustal Motion in the Southern Andes (26-36S): Do the Andes Behave Like a Micro-plate? Geochemistry, Geophysics, Geosystems 4(10): 14 p. [ Links ]
Brooks, B.A., Sandvol, E., and Ross, A. 2000. Fold style inversion: Placing probabilistic constraints on the predicted shape of blind thrust faults. Journal of Geophysical Research 105: 13281-13302. [ Links ]
Cahill, T., and Isacks, B. L. 1992. Seismicity and shape of the subducted Nazca plate. Journal of Geophysical Research 97: 17503-17529. [ Links ]
Castano, J. C. 1995. Microzonificación Sismica del Gran Mendoza. Instituto Nacional de Prevención Sísmica, 156 p., San Juan. [ Links ]
Chiaramonte, L., Ramos, V., and Araujo, M. 2000. Estructura y sismotectónica del anticlinal Barrancas, cuenca Cuyana, provincia de Mendoza. Revista de la Asociación Geológica Argentina 55: 309-336. [ Links ]
Costa, C. 1995. Análisis Neotectónico en Las Sierras De San Luis y Comechingones: Problemas y Métodos. Congreso Geológico Argentino, Actas 2: 285-300. [ Links ]
Costa, C. H., and C. Vita-Finzi 1996. Late Holocene faulting in the southeast Sierras Pampeanas of Argentina, Geology 24: 1127- 1130. [ Links ]
Costa, C.H., Giaccardi, A.D., and Diaz, E.F. 1999. Palaeolandsurfaces and neotectonic analysis in the southern Sierras Pampeanas, Argentina. Geological Society, Special Publications 162, London. [ Links ]
Costa, C., Machette, M.N., Dart, R.L., Bastias, H.E., Paredes, J.D., Perucca, L.P., Tello, G.E., and Haller, K.M. 2000. Map and database of Quaternary faults and folds in Argentina, U. S. Geological Survey, 00-0108, 81 p. [ Links ]
Coughlin, T.J., O'Sullivan, P.B., Hohn, B.P., and Holcombe, R.J. 1998. Apatite fission-track thermochronology of the Sierras Pampeanas, central western Argentina: implications for the mechanism of plateau uplift in the Andes. Geology 26: 999-1002. [ Links ]
Cox, A., and R. B. Hart (1986), Plate Tectonics How it Works, Blackwell Science, 392 p., Cambridge. [ Links ]
Cristallini, E. O. and V. A. Ramos 2000. Thickskinned and thin-skinned thrusting in the La Ramada fold and thrust belt: crustal evolution of the High Andes of San Juan, Argentina (32°SL). Tectonophysics 317: 205-235. [ Links ]
DeCelles, P. G. 2004. Late Jurassic to Eocene evolution of the Cordilleran thrust belt and foreland basin system, western U.S.A.. American Journal of Science 304: 105-168. [ Links ]
Dewey, J. F., and J. M. Bird 1970. Mountain belts and the new global tectonics. Journal of Geophysical Research 75: 2625-2647. [ Links ]
Echavarría, L., Hernández, R., Allmendinger, R.W., and Reynolds, J. 2003. Subandean thrust and fold belt of northwestern Argentina: Geometry and timing of the Andean evolution. American association of Petroleum Geologists, Bulletin 87: 965- 985. [ Links ]
Engdahl, E.R., van der Hilst, R.D., and Buland, R.P. 1998. Global teleseismic earthquake relocation with improved travel times and procedures for depth determination. Bulletin of the Seismological Society of America 88: 722-743. [ Links ]
England, P., and D. McKenzie 1983. Correction to: A thin viscous sheet model for continental deformation, Geophysical Journal of the Royal Astronomical Society 73: 523-532. [ Links ]
Euillades, P.A., Brooks, B.A., Blanco, M., and Euillades, L. 2005. Preliminary results of differential interferometry in West-Central Argentina: FRINGE 2005 Workshop. [ Links ]
Funning, G.J., Barke, R.M.D., Lamb, S.H., Minaya, E., Parsons, B., and Wright, T.J. 2005. The 1998 Aiquile, Bolivia earthquake: A seismically active fault revealed with InSAR. Earth and Planetary Science Letters, v. 232, p. 39-49. [ Links ]
Gephart, J. W. 1994. Topography and subduction geometry in the central Andes: Clues to the mechanics of a noncollisional orogen. Journal of Geophysical Research 99, 12279-12288. [ Links ]
Hindle, D., J. Kley, J., Stein, S., Dixon, T., and Norabuena, E. 2002. Consistency of geologic and geodetic displacements during Andean orogenesis: Geophysical Research Letters 29, 10.1029/2001GL013757. [ Links ]
Isacks, B. L. 1988. Uplift of the Central Andean Plateau and Bending of the Bolivian Orocline. Journal of Geophysical Research 93: 3211-3231. [ Links ]
Jordan, T. E., and Allmendinger, R. W. 1986. The Sierras Pampeanas of Argentina: a modern analogue of Laramide deformation. American Journal of Science 286: 737-764, New Haven. [ Links ]
Kadinsky-Cade, K., Reilinger, R., and Isacks, B.L. 1985. Surface deformations associated with the November 23, 1977, Caucete, Argentina, earthquake sequence. Journal of Geophysical Research 90: 12,691-12,700. [ Links ]
Kendrick, E., Bevis, M., Smalley, R.J., and Brooks, B. 2001. An integrated crustal velocity field for the central Andes. Geochemistry, Geophysics, Geosystems 2. [ Links ]
Kendrick, E., Bevis, M., Smalley, R.J., Brooks, B., Vargas, R.B., Lauría, E., and Fortes, L.P.S. 2003. The Nazca-South America Euler Vector and its Rate of Change. Journal of South American Earth Sciences 16: 125-131. [ Links ]
Kendrick, E.C., Bevis, M., Smalley, R.F., Jr., Cifuentes, O., and Galban, F. 1999. Current rates of convergence across the Central Andes; estimates from continuous GPS observations. Geophysical Research Letters 26: 541-544. [ Links ]
Khazaradze, G., and J. Klotz (2003), Short- and long-term effects of GPS measured crustal deformation rates along the south central Andes. Journal Geophysical Research 108: 2289. [ Links ]
Kley, J. and C. R. Monaldi 1998. Tectonic shortening and crustal thickness in the Central Andes: How good is the correlation. Geology 26: 723-726. [ Links ]
Klotz, J., Angermann, D., Michel, G.W., Porth, R., Reigber, C., Reinking, J., Viramonte, J., Perdomo, R., Rios, V.H., Barrientos, S., Barriga, R., and Cifuentes, O. 1999. GPSderived Deformation of the Central Andes Including the 1995 Antofagasta Mw= 8.0 Earthquake. Pure and Applied Geophysics 154: 709-730. [ Links ]
Klotz, J., Khazaradze, G., Angermann, D., Reigber, C., Perdomo, R., and Cifuentes, O. 2001. Earthquake cycle dominates contemporary crustal deformation in Central and Southern Andes. Earth and Planetary Science Letters 193: 437-446. [ Links ]
Lamb, S. 2000. Active deformation in the Bolivian Andes, South America. Journal of Geophysical Research, B, Solid Earth and Planets, 105: 25,627-625,653. [ Links ]
Lamb, S. and Davis, P. M.2003. Cenozoic climate change as a possible cause for the rise of the Andes. Nature 425: 792-797. [ Links ]
Liu, M., Yang, Y., Stein, S., Zhu, Y., and Engeln, J. 2000. Crustal shortening in the Andes:Why do GPS rates differ from geological rates? Geophysical Research Letters 27: 3005-3008. [ Links ]
McCaffrey, R. 2002. Crustal block rotations and plate coupling, in Plate Boundary Zones. En Stein, S. and Freymueller, J. T. (eds) Plate Boundary Zones, American Geophysical Union, Geodynamics Series 30: 101-122. [ Links ]
McQuarrie, N. 2002. The kinematic history of the central Andean fold-thrust belt, Bolivia: Implications for building a high plateau, Geological Society of Amrica, Bulletin 114: 950-963. [ Links ]
Norabuena, E., Leffler-Griffin, L., Mao, A., Dixon, T., Stein, S., Sacks, I.S., Ocola, L., and Ellis, M. 1998. Space Geodetic Observations of Nazca-South America Convergence Across the Central Andes. Science 279: 358-362. [ Links ]
Norabuena, E.O., Dixon, T.H., Stein, S., and Harrison, C.G.A. 1999. Decelerating Nazca- South America and Nazca-Pacific plate motions. Geophysical Research Letters 26: 3405-3408. [ Links ]
Pacheco, J.F., Sykes, L.R., and Scholz, C.H. 1993. Nature of Seismic Coupling Along Simple Plate Boundaries of the Subduction Type. Journal of Geophysical Research 98: 14,133- 14,159. [ Links ]
Pardo-Casas, F., and P. Molnar 1987. Relative motion of the Nazca (Farallon) and South American Plate since Late Cretaceous time. Tectonics 6: 233-248. [ Links ]
Petersen, M.D., Bryant, W.A., Cramer, C.H., Cao, T., Reichle, M.S., Frankel, A.D., Lienkaemper, J.J., McCroy, P.A., and Schwartz, D.P. 1996. Probabilistic seismic hazard assessment for the State of California. US Geological Survey, Open-File Report. [ Links ]
Pritchard, M. E., and Simons, M. 2002. A satellite geodetic survey of large-scale deformation of volcanic centres in the central Andes. Nature 418: 167-171. [ Links ]
Ramos, V. A. 1988. The tectonics of the Central Andes; 30° to 33° S latitude. En Clark, Jr., S. P., Burchfiel, C. and Suppe, J. (eds.) Processes in Continental Lithospheric Deformation, Geological Society of America, Special Paper 218: 31-54. [ Links ]
Ramos, V.A., Cegarra, M., and Cristallini, E. 1996. Cenozoic tectonics of the High Andes of west-central Argentina (30-36° latitude). Tectonophysics 259: 185-200. [ Links ]
Savage, J. C. 1983. A dislocation model of strain accumulation and release at a subduction zone. Journal of Geophysical Research 88: 4984-4996. [ Links ]
Schiller, W., 1912, La Alta Cordillera de San Juan y Mendoza y parte de la provincia de San Juan, Anales del Ministerio de Agricultura, Sección Geología, Mineralogía y Minería 7: 1-68. [ Links ]
Sheffels, B. 1990. Lower bound on the amount of crustal shortening in the central Bolivian Andes. Geology 18: 812-815. [ Links ]
Siame, L.L., Bellier, O., Sebrier, M., Bourles, D.L., Leturmy, P., and Perez, M. 2002. Seismic hazard reappraisal from combined structural geology, geomorphology and cosmic ray exposure dating analyses: the Eastern Precordillera thrust system (NW Argentina). Geophysical Journal International 150: 241-260. [ Links ]
Smalley, R., Jr. and Isacks, B. L. 1990. Seismotectonics of Thin- and Thick- Skinned Deformation in the Andean Foreland from Local Network Data: Evidence for a seismogenic Lower Crust. Journal of Geophysical Research 95: 12,487-412,498. [ Links ]
Smalley, R., Jr., Kendrick, E., Bevis, M.G., Dalziel, I.W.D., Taylor, F., Lauría, E., Barriga, R., Casassa, G., Olivero, E. and Piana, E. 2003.Geodetic determination of relative plate motion and crustal deformation across the Scotia-South America plate boundary in eastern Tierra del Fuego. Geochemestry, Geophysics, Geosystems 4: 1070. [ Links ]
Somoza, R. 1998. Updated Nazca (Farallon)-South America relative motions during the last 40 My; implications for mountain building in the Central Andean region. Journal of South American Earth Sciences 11: 211-215. [ Links ]
Williams, C., and R. McCaffrey 2001. Stress rates in the central Cascadia subduction zone inferred from an elastic plate model. Geophysical Research Letters 28: 2125-2128. [ Links ]
Woodward, N.B., Boyer, S.E., and Suppe, J. 1989 Balanced Geological Cross-Sections: An Essential Technique in Geological Research and Exploration. En Woodward, N. B., et al. (eds.) American Geophysical Union, 132 p., Washington DC. [ Links ]
Zapata, T. R., and Allmendinger, R. W. 1996a. Growth stratal records of instantaneous and progressive limb rotation in the Precordillera thrust belt and Bermejo basin, Argentina. Tectonics 15: 1065-1083. [ Links ]
Zapata, T. R., and Allmendinger, R. W. 1996b. Thrust-Front Zone of the Precordillera, Argentina: A Thick-Skinned Triangle Zone. American Association of Petroleum Geologists Bulletin 80: 359-381. [ Links ]
Recibido: 30 de junio, 2006
Aceptado: 15 de noviembre, 2006

