


Servicios Personalizados
Revista

Articulo
 Inglés (pdf)
 Articulo en XML
 Referencias del artículo
 Enviar articulo por email
Indicadores
-
 Citado por SciELO
Links relacionados
-
 Similares en
SciELO
Similares en
SciELO  uBio
uBio
Compartir

 Permalink
Darwiniana, nueva serie
versión impresa ISSN 0011-6793versión On-line ISSN 1850-1699
Darwiniana, nueva serie vol.6 no.1 San Isidro jul. 2018
http://dx.doi.org/10.14522/darwiniana.2018.61.785
PALINOLOGÍA
10.14522/darwiniana.2018.61.785
Pollen dispersal and deposition in an agroecosystem at Province of Buenos Aires, Argentina
Dispersión y deposición de polen en un agrosistema de la Provincia de Buenos Aires, Argentina
Nora Madanes1,2 & Celina A. Fernández1,3
1 Departamento de Ecología, Genética y Evolución, Facultad de Ciencias Exactas y Naturales, Universidad de Buenos Aires, Intendente Güiraldes 2160, 1428 Ciudad Universitaria, Ciudad Autónoma de Buenos Aires, Argentina; noram@ege.fcen.uba.ar (author for correspondence).
2 Instituto de Ecología y Genética de Buenos Aires, Facultad de Ciencias Exactas y Naturales, CONICET, Intendente Güiraldes 2160, 1428 Ciudad Universitaria, Ciudad Autónoma de Buenos Aires, Argentina.
3 Comisión de Investigaciones Científicas de la Provincia de Buenos Aires, Calle 526 entre 10 y 11, 1900 La Plata, Argentina.
Original recibido el 26 de diciembre de 2017, aceptado el 18 de junio de 2018
Editor Asociado: Manuel J. Belgrano 35
Abstract. The aim of this study is to analyze factors and mechanisms involved in dispersal and deposition of airborne pollen captured with Tauber type traps in a 20 x 20 m plot of Helianthus annus cultivation and accompanying weeds and to investigate the relation of these processes with the vegetation structure and dynamics from cultivation to its senescence over a 14 week period. Weekly samples obtained with pollen traps showed a significant change in the deposition due to a filter effect and dispersal patterns due to source variations during the time elapsed. A conceptual and interpretative model for both processes and its relation to pollen sources is proposed. Our results showed that in the study site, the leaves development of Helianthus annus produced a pollen filter effect. Furthermore the cultivation and weeds phenology was linked to deposition and dispersal of pollen, whose sources were the study plot, local or extralocal distances. Three periods could be characterized according to the presence of pollen contents coming from different pollen sources. The first period was characterized by deposition of local and extralocal pollen types such as Caryophyllaceae, t. Physalis, etc, the second by pollen originate from the study plot (such as Helianthus annus) and the third by a combination of all three sources.
Keywords. Airborne pollen; Phenology; Helianthus annus; Weeds.
Resumen. Los objetivos de este estudio fueron analizar los factores y mecanismos implicados en la dispersión y depositación del polen aéreo capturado con trampas tipo Tauber en una parcela de 20x20 m cultivada con Helianthus annus y acompañada por sus malezas e investigar la relación de estos procesos con la estructura y dinámica de la vegetación desde la fecha de siembra hasta la senescencia del cultivo en un periodo de 14 semanas. Se tomaron muestras semanales del polen capturado en las trampas. Se registraron cambios en la depositación debido al efecto de filtro y en los patrones de dispersión debido a la variación de las fuentes durante el lapso de tiempo estudiado. Se propuso un modelo conceptual e interpretativo de ambos procesos y su relación con las fuentes de polen. Nuestros resultados mostraron que en el sitio de estudio, el desarrollo de las hojas de Helianthus annus produce un efecto de filtro. Además la fenología del cultivo y de las malezas fue relacionada con la depositación y dispersión del polen. Las fuentes de polen fueron clasificadas en in situ, local o extralocal .Se caracterizaron tres periodos de acuerdo a la presencia del polen contenido proveniente de diferentes fuentes polínicas. El primer periodo caracterizado por la depositación de tipos polínicos locales o extralocales tales como Caryophyllaceae, t. Physalis, etc., el segundo caracterizado por el polen originado a partir de la parcela de estudio (Helianthus annus) y el tercer periodo por la combinación de las tres fuentes de polen.
Palabras clave. Fenología; Helianthus annus; Malezas; Polen aéreo.
INTRODUCTION
Airborne pollen studies in present agroecosystems, contribute to the knowledge of palaeo-environments due to the fact that pollen records of archaeological sites can contain evidence of environmental modifications by land use (Faegri & Iversen, 1992; Broström et al., 1998; Mazier et al., 2006; Medina et al., 2008; Brun, 2011; Pang et al., 2011; Hjelle et al., 2015). One of the applications of pollen/vegetation relationship is linked to the interpretation of past human activity. For example, natural and agro-ecosystem can be characterized by its pollen assemblages and specific combinations of pollen taxa abundances. Such studies are important to understand changes in the landscape and human impact in a spatial scale of high resolution (Brun et al., 2007; Hjelle, 1999 a, 1999 b; Pang et al., 2011)
The importance of research upon modern analogues by investigating present pollen spectra and its relationship to its vegetation sources, has already been pointed out by Birks and Birks (1980), D´Antoni (1991), Madanes & Fernández (2000), D´Antoni (2008). Furthermore, only few studies have investigated the relationship between pollen and vegetation in cultivated fields (Madanes & Millones, 2004; Mazier et al., 2006; Brun et al., 2007; Brun, 2011; Pang et al., 2011). The concept of anthropogenic indicators relies on the occurrence of particular pollen taxa, which are closely correlated with human activities, e.g., cultivated plants and weeds (Behre, 1981; Brun, 2011). Fossil pollen sequences are interpreted qualitatively with the help of these pollen indicators of different human activities such as cultivation, grazing, trampling, settlement and mowing. This so-called "indicator species" approach is the most widely used method for tracing the history of habitation and its changing intensity over time (Court Picon et al., 2006; Brun, 2011)
Factors and mechanisms that influence deposition and dispersal of pollen grains allow us to make inferences about vegetation characteristics that include both spatial and temporal components. Thus, the surrounding vegetation can be reflected by airborne pollen emitted from sources at different distances (Janssen, 1966; Wright, 1967; Madanes & Fernández, 2000; Madanes & Millones, 2004). The relationship between pollen dispersed and deposited over time in a given site and its surrounding source of vegetation is strengthened by phenological data of species at the site. Both phenological and aerobiological sets of data should be as similar as possible (Estrella et al., 2006; Jato et al., 2007; Tormo et al., 2011)
Several approaches have been made in order to explore qualitative and quantitative relations between vegetation and its pollen representation (Moore et al., 1991; Brun et al., 2007; Hjelle et al., 2015). Many papers concerning these comparisons deal with types of vegetation subjected by different anthropogenic land-uses (Behre, 1981; Gaillard et al., 1992; Hicks & Birks 1996; Hjelle 1997, 1999 a, 1999 b; Hjelle et al., 2015; Broström et al., 1998; Court Picon et al,. 2005, 2006; Mazier et al., 2006). Furthermore, Heim (1970), Vuerela (1973), Hall (1989), Madanes & Millones (2004), Brun et al. (2007) mentioned papers that analyze pollen/vegetation relationship of cultivated fields and in turn they study this relationship upon local scale, using moss samples in land crops and fallows as pollen traps.
The aim of this study is to analyze factors and mechanisms involved in dispersal and deposition of airborne pollen and to investigate the relation of these processes with the vegetation structure and dynamics in different crops of the Pampas. Three pollen emission sources were defined for this study (Madanes & Millones, 2004: Madanes, 1999) according to its distance from the deposition site: 1) plot (site dispersed by Helianthus annus L. environment) 2) local (includes three immediate surrounding environments defined as relictual, landscaped, and agroproductive, this last one containing the plot of H. annus cultivation and 3) regional (vegetation surrounding EEA-INTA Balcarce station)
STUDY AREA
The study took place at the Agriculture Experimental Station of INTA Balcarce (EEA-INTA), south of Buenos Aires province (37°45'40.2"S 58°17'55.1"W) located in the transition zone between Pampa Deprimida and Pampa Austral (Solbrig & Morello, 1997) (Fig. 1).
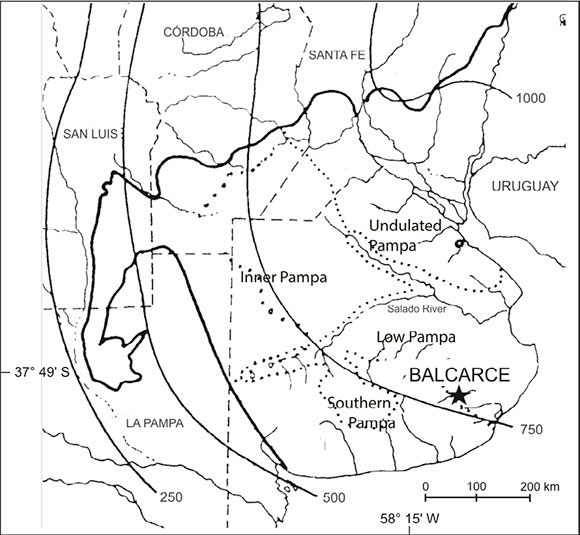
Fig. 1. Map showing the site of the study area in the transition zone between Pampa Deprimida and Pampa Austral. Isohietas from 250 mm to 1000 mm are indicated.
Natural vegetation is composed mainly by grasslands with several species of Stipa and Piptochaetium genera (Cabrera & Zardini, 1978). However, the present landscape is deeply modified by cattle and agricultural activities developed since the XVIII century. At present, the climate is mesothermal, subhumid with none or scarce water deficiency and a 48% summer concentration of thermic efficiency (Vervoorst, 1967). Annual mean temperature is 13o-17o C, mean annual precipitation is 960 mm, 63% of precipitations occur during the warm season (October to March) (Vervoorst, 1967). Figure 2 shows hydric balance for the period studied. The mean period free of frost is 231 days and the extreme is 166 days (Andrade et al., 1996)
MATERIAL AND METHODS
Pollen
Pollen was captured in 4type Tauber traps placed on the angles and one in the center of the Helianthus annus cultivation and accompanying weeds (Helianthus annus/weeds) plot of 20 × 20 at ground level. Traps were exposed during a 7 to 10 days period after which traps were collected, washed, emptied and replaced. This procedure was repeated all along the time elapsed between the emergence of the cultivation until its senescense (98 days). Samples were collected fourteen times. Observations were made from late October to early March. Samples´ treatment was performed according to the following sequence: 10% KOH at 100 ºC during 10 minutes followed by distilled water washings. HCL acid in 10% water solution, cold HF 70% for 24 hours, 30% HCL 60ºC, washed with distilled warm water, and 12 minutes acetolysis at 100ºC washed with glacial acetic acid and distilled water. Finally, the samples were included in 5 ml glycerine in residue tubes. The minimum volume was 60 µl determined by the Cain method (Mueller-Dombois & Ellenberg 1974) reaching average sums in each date from 111 to 2763.8 pollen grains. Slides were observed with an Olympus BH 2 light photomicroscope in immersion 1000 X. The pollen reference collection of the Palynology Laboratory UNMDP was used for identification control as well as published descriptions given in Erdtman (1969, 1972), Heusser (1971), Huang (1972), Markgraf & D' Antoni (1978), Morbelli (1980) and Madanes (1999). Furthermore, identification of pollen grains was made to the least possible taxonomic hierarchy.
For each date pollen counts corresponding to five Tauber traps were averaged and percentages for each pollen type were calculated in respect to the total pollen sum. Only taxa over 2% or equal were considered for the data calculation. The pollen diagram was constructed by means of TGView version 2.0.2 (Grimm, 1992). Program CONISS was used for restricted cluster analysis including Euclidian distance (Grimm, 1992). Percentage data were transformed using the function arc sen Ѵx in order to normalize data and stabilize variance (Zar, 1984).
Pollen sources and environmental units
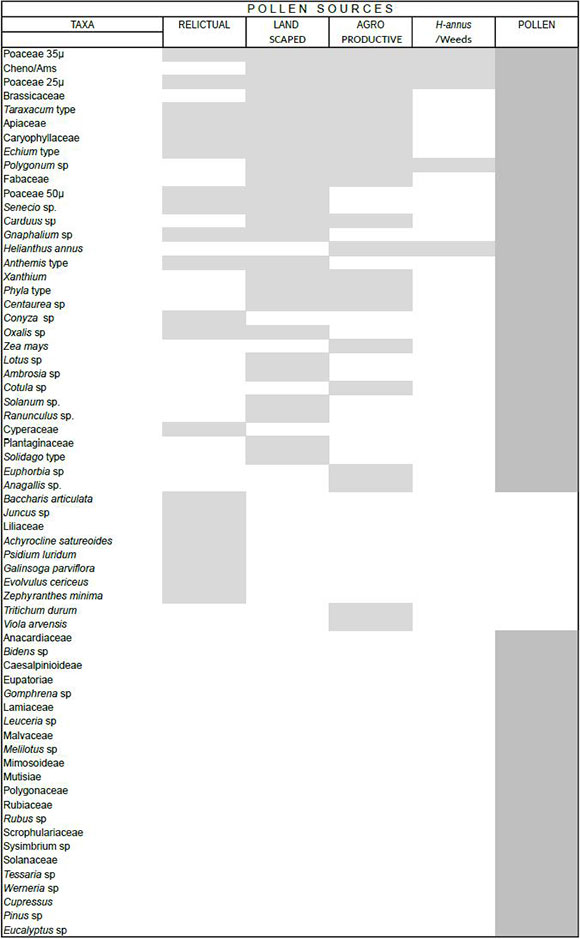
Pollen sources from EEA-INTA were identified (Madanes, 1999; Madanes & Millones, 2004). Pollen and surrounding vegetation were sampled simultaneously. Zonation of the study area EEA-INTA was done in order to delimit and characterize the environmental units on the basis of vegetation structure. Environments were classified according to their origin (anthropic/natural) and its use (frequency and intensity) (Madanes, 1999; Madanes & Millones, 2004). Envirenmental units were: Helianthus annus/weeds, agroproductive and relictual. A floristic list for the environments mentioned above was compiled and analogue to its pollen types list (Table 1).
Table 1. Total floristic list of vegetation analogued to its pollen types Table shows presence/absence in four pollen sources and pollen captured in Tauber traps.
Vegetation sampling of Helianthus annus cultivation and accompanying weeds community
The Helianthus annus/weeds cultivation is found within the agroproductive environment. Conventional tillage was carried out in October and sowing took place in December. Plant community samples were taken in six times during the course of crop development, each 7 or 10 days synchronous with pollen sampling. Censuses within the plot Helianthus annus/ weeds. Vegetation sampling was carried out according to a design of 25 sq cm subplots at random. Five repetitive samplings were made. In each subplot the floristic composition was determined and the number of individuals for each population was counted and density estimated. As measures were taken from the emergence it was possible to identify the ramets (Harper, 1981) of Poaceae considered in this work as individuals. Agroproductive and relictual environmmental were made according to Braun-Blanquet methodology (Mueller-Dombois & Ellenberg, 1974).
Species phenology of H. annus cultivation and accompanying weeds community species phenology
Phenophases of different populations of Setaria sp. weeds (Setaria viridis + Setaria verticillata), Digitaria sanguinalis, Chenopodium album, Amaranthus quitensis, Portulaca oleracea, Brassica campestris) and H. annus were determined according to the dominant ramet (sensu Harper, 1981) type: vegetative (juvenile, caulinar), pre-flowering, flowering, maturation, dispersal and senescence) and the period when these were registered (dates in which phenophase were recorded). Phenophases were defined as follows: vegetative development I, vegetative development II, pre-flowering period, flowering, maturation dispersal of fruits and seeds and senescence. A data matrix with 140 observations and 42 variables was constructed (Madanes, 1999), where for each observation, the percentage of population in either one phenological phase was considered. For each species, ten individuals per date were phenologically analyzed. Data were analyzed by Detrended Correspondence Analysis DCA using CANOCO version 3.12 (Ter Braak & Smilauer, 1998).
Climate and phenology
On the basis of climatic data provided by the Experimental Station a water balance for the time of study was calculated according to Thornthwaite (1948) in order to detect periods of deficit and hydric excess, and it was related to the community phenology (Fig. 2).
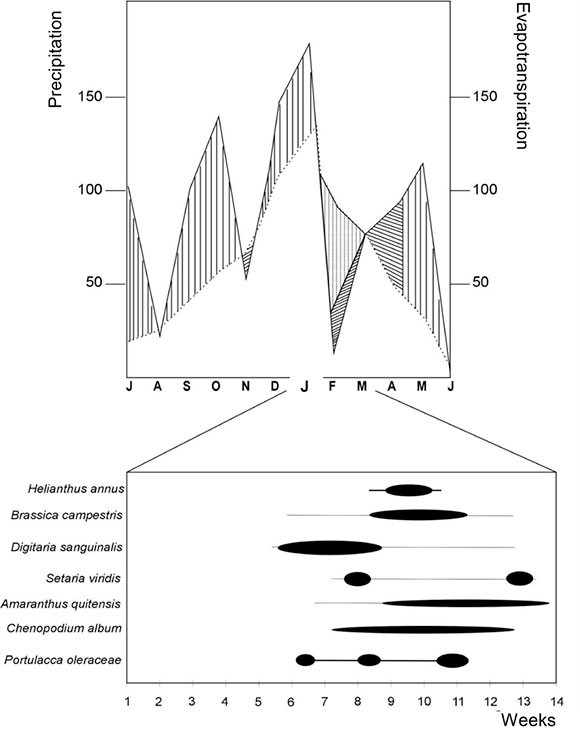
Fig. 2. Hydric Balance according to Thornthwaite 1948. Source: Metheorologic Station at the Experimental Station of INTA BALCARCE, Buenos Aires Province. Intensity and duration of the flowering season for weeds and cultivation is indicated.
Airbone pollen and vegetation relationship at the cultivation site
Pollen grains are described as pollen types, frequently including several plant species, indistinguishable on the basis of pollen morphology. Therefore, the difference in taxonomic resolution may cause bias in the relationship between vegetation and pollen. In order to compare pollen and vegetation data, plant taxa were grouped according to pollen types (Table1).
In order to analyze the relationship between airborne pollen dispersed and deposited in the cultivation site, a data matrix of 14 observations and 71 cases was constructed. In addition to species of the site´s density and intensity values of the flowering species, phenological phases were included in the matrix. Height and foliar area index (FAI) (Saugier, 1976) of the cultivation were also included. All variables were analyzed by means of Principal Component Analysis (PCA) using Statistica program version 6.0. Original data were expressed as percentages with subsequent (arc sen Ѵ proportion) angular transformation in order to normalize data and stabilize variance (Zar, 1984).
RESULTS
Pollen sources and environmental units
In a field of 420 hectares EEA-INTA different environmental units were identified. An agroecosystem that includes Helianthus annus, Zea mays, Triticum durum crops and weeds, subjected to regular and intensive management for agricultural purposes. The study site (plot) with Helianthus annus/weeds is located in this environment. The second unit (landscaped) comprises the surrounding areas where the Station´s facilities are found, and is designed for outdoor recreation practices and installations. This unit is characterized by two strata: an arboreal containing a Eucalyptus plantation carried out for ornamental purposes and as barrier against winds, and an herbaceous plantation subjected periodically for mowing. The third unit is a zone containing a relictual community mosaic. In the past, this unit was subjected for grazing, while at present the anthropogenic impact is scarce. The shrub stratum of this unit is dominated by Baccharis tandilensis and B. articulata and the herbaceous stratum by Paspalum quadrifarium (Madanes & Millones, 2004).
The Helianthus annus/weeds community in the study plot was characterized by the Setaria species dominance (Setaria viridis plus Setaria verticillata) and a group of co-dominant species all within the taxonomical group of Poaceae which was the most represented family and contributed up 37% of total species richness (Madanes, 1999). In the plot, structural changes in the weed´s community were given by density variations of Setaria species and not by replacement of plant species. Species identified Portulaca olearacea, Amaranthus quitensis and Chenopodium album (pollen type Cheno-Ams), Digitaria sanguinalis, Setaria sp. (pollen type Poaceae 25 µm) and Brassica campestris (pollen type Brassicaceae) are very frequent in summer season agroecosystems at the study area (Madanes & Millones, 2004).
Vegetation and climate
Fig. 2 also shows that the emergence of cultivation and weeds occurs, when the soil contains excess of water and water balance is positive. The species reproductive phase develops with higher intensity when precipitation was below the requirements of potential evapotranspiration. Anthesis of H. annus takes place when soils have water capacity. Finally, fructification/maturation and senescense phenophases takes place when water balance is favourable once again
Phenology
Fig. 3 shows the distribution of different phenophases as a function of the first two axes obtained by DCA, which explains 69.54 % of the total variance. The first axis shows a gradient of groups characterized by species abundance in each phenophases. Groups with high values of relative abundance of vegetative phenophases in all species are located towards the lowest values of the positive axis while groups formed by presence and abundance of reproductive, fructification maturation and senescense phenophases are located on the highest values of the positive axis, except for Che DVI (Chenopodium development vegetative I ) The second DCA axis explains little of the variance since it was used in the detrend process
The first axis indicates a phenophase replacement gradient with three different phenological periods: 1) vegetative, 2) reproductive, and 3) reproductive-senescent. The first one comprises samples from weeks 1 to 7 and is characterized by phenophases in vegetative activity I and II. The second is composed by weeks 8 to 12 and showed preflowering and flowering phenophases in every species with less proportion of fructification maturation. The upper limit of the period is marked by the flowering of H. annus and fructification of B. campestris. A partial overlapping of vegetative and vegetative/reproductive phenophases between species can be observed. The third period corresponding to weeks 13 to 14 is characterized by reproductive and senescent phenophases.
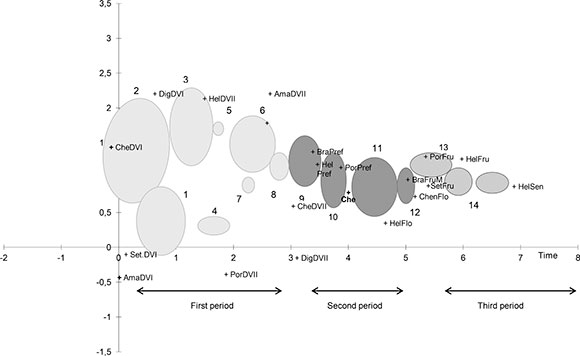
Fig. 3. Biplot of the phenologic development process of cultivation and weeds community. Arrows indicate the direction of phenophases replacement.VDI: Vegetative Development I, VDII. Vegetative Development II, PF Pre-flowering, Flo: Flowering, Fru-M: Fructification-Maturation, Sen: senescence, Ama. Amaranthus quitensis, Bra: Brassica campestris, Che: Chenopodium album, Hel: Helianthus annus, Por: Portulaca oleraceae, Set: Setaria spp., Dig: Digitaria sanguinalis.
Pollen analysis
A total of 54 pollen types were identified from samples taken through the period of 14 weeks (Table 1). Only 19 pollen types were included in the data matrix and displayed in the pollen diagram, which were represented by values higher than 2% or more.
The pollen diagram (Fig. 4) shows that deposition of airborne pollen took place throughout the entire period of 14 weeks, while dispersal and deposition within the Helianthus annus / weeds plot began on the fifth week and extended towards fourteenth week The dendrogram at the end of the pollen diagram in figure 4 shows the groups obtained by cluster analysis. Two main groups A and B were differentiated. Abundant taxa in group A, showed a continuous pattern throughout the entire period or from the first to sixth week of observation (early). In contrast, taxa of group B, represented by H. annus, showed a marked seasonality between seventh and fourteenth week. Within these groups different periods were differentiated by subgroups (late). Subgroup AI includes abundant taxa in the first observations: Brassicaceae, Poaceae 35 µm and Cheno-Ams were recorded throughout the entire period, with high values throughout the study. Anthemidae, Lotus and Solanum were present in the first period. In the study, size classes of family Poaceae allows to separate Setaria sp. and Digitaria sp. (analogous to Poaceae 25 µm) taxa from the rest of Poaceae pollen grains. In particular, Lotus reaches high values during the fourth week. Subgroup AII as high values of Poaceae 25 µm in the fifth and sixth weeks. Helianthus annus dominates in subgroup BI which comprises weeks 7 to 11 together with Poaceae de 35 µm and Poaceae de 25 µm. Subgroup BII comprises weeks 12 and 13 an d is characterized by taxa, which showed high values at the beginning and the end of the study, such as Poaceae 35µm and Cheno-Ams and those present only in those weeks, like Centaurea and Gnaphalium. Subgroup BIII only consists of week 14 and is characterized by Poaceae 35 µm, Cheno/Ams, Brassicaceae and Ambrosia.
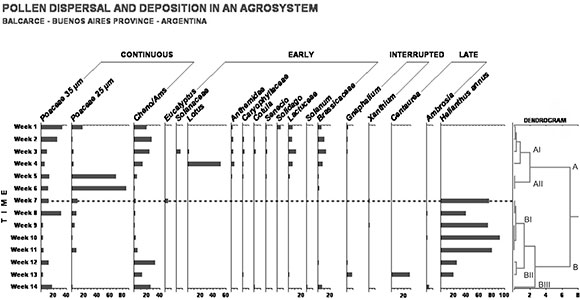
Fig. 4. Pollen diagram of taxa with relative values equal or higher than 2 % of total pollen sum. Dendrogram on the right side of the diagram shows the results of cluster analysis.
Pollen -Vegetation relationship
In the Helianthus annus/weeds environment, 8 species were identified and linked to 5 taxa at the pollen hierarchical level. The species identified were Setaria spp, Digitaria sanguinalis (polynically analogue as Poaceae 35µm, Portulaca oleracea, Chenopodium album, and Amaranthus quitensis (polynically analogated as Cheno/Ams), Agro-pyron repens (polynically analogated as Poaceae 25µm), Brassica campestris (polynically analogated as Brassicaceae) and Polygonum convolvulus (polynically analogated as Polygonaceae). From this plot, Portulaca oleracea was not recorded in the pollen set, instead, pollen of Polygonum convolvulus appeared in pollen samples although it had not bloomed.
Fig. 5 shows the distribution of weeks over the first two PCA axes which explains 51.36 % of the total variance. Samples 1,2,3,4, 5, 6 and 14 were placed on the third quadrant while samples 7, 12, 13 were located in first one. Samples 9, 10 and 11 were placed on the second one. Sample 8 was located on the botton of first quadrant. In this way, towards the negative values of the axis 1, the samples that are only deposited in the site are distributed, while the dispersed and deposited in the site samples are distributed to the positive values. Although it was not possible to observe a gradient in the distribution of samples along the axes, discontinuities seem to be related to the second axis regarding intensity and duration of Helianthus annus/weeds and Poaceae 35 µm flowering phenophases. For example on the seventh week, even though every weed started its flowering did not account for H. annus which started its flowering from week 8 to week 11 (Figure 2). In weeks 12 and 13, once again Poaceae and Cheno-Ams reached high values of intensity regarding flowering.
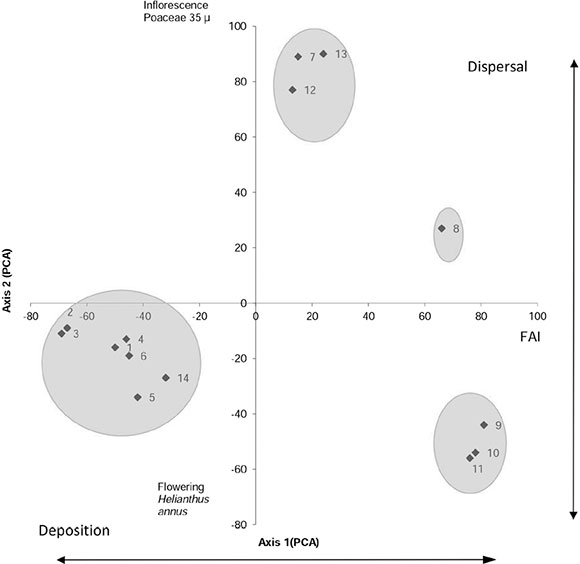
Fig. 5. Biplot of the environmental variables determined in the association of pollen -vegetation samples.
DISCUSSION
The presence of pollen grains of dominant taxa such as Poaceae, Asteraceae and Brassicaceae in the pollen spectra generally characterizes crop vegetation in France (Brun et al., 2007). Moreover, relevees made by Alonso (1984) at southeast of Buenos Aires province and those made by Requesens et al. (1989) points out that Poaceae and Asteraceae constitute 56% of botanic families in cultivated areas. Hodgson (1986) found the same relationship for an agricultural region in Sheffield, England. From the pollen calendar we can tell that the 3 taxa are important. But Poaceae as well as Asteraceae and Brassicaceae are characteristic families of Pampean plains. This means that in these taxa we are including not also native species but also exotic ones. So, the fact of inferring an anthropogenic environment is difficult to achieve. Nevertheless, the presence of species found in the pollen record such as Cotula, Xanthium and Centaurea, which are exotic in Southamerica may be considered indicators of anthropic environments.
Except for Eucalyptus and Helianthus annus, pollen types, the pollen diagram correspond to r-strategy species (generalists) of ruderals (Grime, 1979; Brun, 2011) and presented a spring-summer life cycle. For the phenological community analyses it was considered that plants comprise metapopulations (Harper, 1981). In this way individuals were represented by a set of ramets each one corresponding to a specific phenophase (Arana et al., 1985). The spatial distribution of phenophases shown in figure 3, allows us to interpret the first axis as a temporal variable through which the distribution of phenophases is determined by the life cycle of metapopulations that define the system´s temporal function. In this model the cultivation does not deviate of the weed´s temporal behavior, where both phenophases are synchronized indicating complementation in the use of time resources.
The pollen diagram (Fig. 4) showed that the Helianthus annus /weeds system was exposed to deposition of pollen combination of different origin (Table 1). Weeds abundant in the environment were well represented in the pollen record all along the cultivation period. Moreover, Portulaca oleracea was not recorded because its flowers are cleistogamus under reduced light intensity (Miyanishi & Cavers, 1984). It should be noted that the high values reached by Lotus sp. is due to the fact that this is abundant species in Paspalum quadrifarium grasslands, frequent in the region (Ortega et al., 2000)
The sample´s spatial distribution shown on Figure 5 could be interpreted towards the origin of the pollen type (Table 1). Thus, in the third quadrant, samples formed by local and regional pollen types with low foliar area index (FAI) and pollen dispersed during dominant vegetative phenophases were placed (samples 1,2,3,4,5 and 6) or senescent (sample 14). First quadrant (samples 7, 12, 13) were located in groups whose pollen contribution was mainly from the study parcel due to Cheno-Ams and Brassicaceae and in less proportion local and regional pollen grains. Samples 9, 10 and 11 are placed on the second quadrant of the figure. In this case airborne pollen was originated entirely by the parcel plants, coinciding with the cultivation flowering phenophase and maximum FAI. Sample 8 was located on the 1st quadrant of the figure. At this time the whole system was in flowering process, showing a maximum for weeds with high FAI. These results coincide with those of Brun et al. (2007) who found that pollen samples collected in arable fields contain part of extra-local pollen which belong to the surrounding vegetation.
The probable origin of pollen is reflected in the spatial distribution of samples through principal component analysis (Fig. 5), where the filter effect, caused by leaves size, that affects dispersal and deposition generates, variations in the first axis. While the cultivation was developing, the leaves size, vegetation height increased as well as the FAI. This situation decreased the wind speed within the cultivation and caused particles to be transported, so sunflower plants and weeds acted as filters, slowing down pollen deposition.
Thus, variations in height and foliar area of the cultivation can explain the distortion between composition of the captured pollen set and that of airborne pollen. The second axis is associated with intensity and duration of the community flowering phenophases and would explain dispersal in the study parcel.
Considering dispersal along the three periods already described, the pollen set recorded in the second period (weeks 7 to 13) shows when sunflower reached senescence and therefore with loosing filter efficiency so that the system recovered its local dimensions.
Pollen records shown in the pollen diagram belong to species abundant in the area, with asynchronic development, thus causing overlapping of its flowering periods. Pollen belonging to those species was deposited before and after their flowering in the study site. The greatest deposition of these pollen types occur when there is no deposition in the study site. At the same time the greatest proportion of regional pollen took place at the beginning and end of the study.
The pollen diagram reflects the cyclic and microsuccessional character of the Helianthus annus weeds system owing to pollen contribution of local and regional vegetation even when there was no flowering in the study site.
CONCLUSIONS
The relationship between modern pollen and vegetation in the Ha/ w plot took into account attributes of the community´s dynamic aspects (development of the Helianthus annus/crop and weeds as wells as phenology analysis). Through a cultivated parcel of 20x20 m during 14 weeks, life cycle, it was possible to evaluate structural and dynamics variables such as phenology.
It´s also useful as a basis for interpretation of fossil pollen spectra in quaternary palaeoecological and archaeological studies since the pollen diagram can be compared (given the analysis scale) with deposit pollen spectra which represent many annual and seasonal cycles.
In spite of the cultivation-weed development during 14 weeks and the filter effect in pollen dispersion and deposition, it was possible to identify an anthropic landscape. Therefore, the presence of indicators such T. Lactucaceae, Carduus, Lotus in quaternary sediments would evidence land use.
The study of vegetation, phenology and airborne pollen in an agroecosystem of Buenos Aires province provided important information to interpret past pollen assemblages and leads to the following conclusions:
The pollen diagram showed distinctively three periods that reflected the dynamics of Helianthus annus/weeds community.
Lactucaceae, Carduus, Centaurea, Cotula, Lotus are pollen indicators, of cultivated areas in SE of Buenos Aires Province could be identified This study had important implications for defining modern vegetation of arable fields according to their qualitative pollen representation and displayed analogues for comparison with fossil pollen.
This analysis is a first approach to the problem. However, future results would be expected with the addition of meteorological variables such as wind, precipitation, measurement of FAI, capture devices at cultivation height.
ACKNOWLEDGEMENTS
To the INTA AGRICULTURAL EXPERIMENTAL STATION at Balcarce for authorizing the field work of this Project. Our gratitude is direct to the Dr. Héctor D´Antoni for his help and Dr. Piedad Cristiano for the critical reading of the manuscript.
REFERENCES
[other standard="nd" count="54"]1. Alonso, S. I. 1984. Período de emergencia de las principales malezas del sudeste bonaerense. INTA -Estación Experimental Agropecuaria Balcarce, Informe para Extensión, Producción Vegetal, Vol. 2: 4. [ Links ]
2. Andrade, F. A.; A. Cirilo, S. Uhart & M. Otegui. 1996. Ecofisiología del cultivo de maíz. Editorial La Barrosa. Delkab Press y EEA INTA-Balcarce, CERBAS. Buenos Aires. 292 pp. [ Links ]
3. Arana, S. C.; N. H. Mailland, S. I. Alonso, N. O. Maceira & C. A. Verona. 1985. Crecimiento y Fenología de poblaciones vegetales en un pastizal natural. Su significado adaptativo. Revista de Investigaciones Agropecuarias INTA, Buenos Aires, República Argentina . XX: 105-134. [ Links ]
4. Behre, K. E. 1981. The interpretation of anthropogenic indicators in pollen diagrams. Pollen et Spores 23: 223-245. [ Links ]
5. Birks, H. J. B & H. H. Birks. 1980. Quaternary Palaeoecology. University Park Press. Baltimore. 289 pp. [ Links ]
6. Broström, A.; M. J. Gaillard, M. Ihse & B. Odgaard. 1998. Pollen-Landscape relationships in modern analogues of ancient cultural landscapes in Southern Sweden -a first step towards quantification of vegetation openness in the past. Vegetation History and Archaeobotany 7: 189-201. [ Links ]
7. Brun, C.; F. Dessaint, H. Richard & F. Bretagnolle. 2007. Arable-Weed Flora and its Pollen Representation: A Case Study from the Eastern part of France. Review of Paleobotany and Palynology 146: 1-24. [ Links ]
8. Brun, C. 2011. Anthropogenic indicators in pollen diagram in eastern France: a critical review. Vegetation History and Archaeobotany 20: 135-142. [ Links ]
9. Cabrera, A. L. & E. Zardini. 1978. Manual de la Flora de los alrededores de la Provincia de Buenos Aires-ACME. Buenos Aires. [ Links ]
10. Court-Picon, M.; A. Buttler & J. L. De Beaulieu. 2005. Modern pollen vegetation relationships in the Champsaur valley (French Alps) and their potential in the interpretation of fossil pollen records of past cultural landscapes. Review of Paleobotany and Palynology 135: 19-39 [ Links ]
11. Court-Picon, M.; A. Buttler & J. L. De Beaulieu. 2006. Modern pollen-vegetation land use relationships in mountain environments: an example from the Champsaur Valley (French Alps). Vegetation History and Archaeobotany 15: 295-315. [ Links ]
12. D´Antoni, H. L. 1991. Modern pollen dispersal in southern Argentina. Bamberg Geographische Schritien 11: 209-227. [ Links ]
13. D´Antoni, H. L. 2008. Arqueología Sistémica y Caótica. Consejo Superior de Investigaciones Científica. Textos Universitarios nº 41. Madrid. 278 pp. [ Links ]
14. Erdtman, G. 1969. A Pollen Morphology and Plant Taxonomy. Angiosperms. (An Introduction to Palynology I). 2a edition. Hafner Publishing Company, New York. [ Links ]
15. Erdtman, G. 1972. Pollen and Spores Morphology/Plant Taxonomy. Gymnosperme, Pteridophyta, Bryophyta. (An introduction to Palynology II). Hafner Publishing Company, New York. [ Links ]
16. Estrella, N.; A. Menzel, U. Kramer & H. Behrendet. 2006. Integration of flowering dates in phenology and pollen counts in aerobiology: analysis of their spatial and temporal coherence in Germany (1192-1999). International Journal of Biometeorology 51: 49-59. [ Links ]
17. Faegri, K. & J. Iversen. 1992. Textbook of pollen analysis (4th. ed. K. Faegri, P. E. Kaland, K. Krzywinski). J. Wiley & Sons, Chichester. [ Links ]
18. Gaillard, M. J.; H. J. B. Birks, U. Emanuelsson & B. E. Berglund. 1992. Modern pollen land-use relationships as an aid in the reconstruction of past land uses and cultural landscapes: an example of South Sweden. Vegetation History and Archaeobotany 1: 3-17. [ Links ]
19. Grime, J. P. 1979. Plant strategies and vegetation processes. J. Wiley & Sons. Chichester. [ Links ]
20. Grimm, E. 1992. Tilia and Tilia graph. Illinois State Museum. Illinois [ Links ]
21. Hall, V. A. 1989. A study of the modern pollen rain from a reconstructed 19th Century farm. Irish Naturalist Journal 23: 82-92. [ Links ]
22. Harper, J. 1981. The concept of population in modular organisms. In: R. May. (ed). Theorical Ecology: principles and applications. Sinauer Assoc. 2nd. Blackwell Sci. Publ. [ Links ]
23. Heim, J. 1970. Les relations entre les spectres polliniques récents et la vegetation actuelle en Europe occidentale. Thesis.Université de Louvain, Belgique. [ Links ]
24. Heusser, C. 1971. Pollen and Spores of Chile. University of Arizona Press. Tucson. [ Links ]
25. Hicks, S. & J. H. B. Birks. 1996. Numerical Analysis of modern and fossil pollen spectra as a tool for elucidating the nature of fine scale human activities in boreal areas. Vegetation History and Archaeobotany 5: 257-272. [ Links ]
26. Hjelle, K. L. 1997. Relationships between pollen and plants in human-influenced vegetation types using presence-absence data in western Norway. Review of Paleobotany and Palynology 99: 1-16. [ Links ]
27. Hjelle, K. L. 1999a. Modern pollen assemblages from mown and grazed vegetation types in western Norway. Review of Paleobotany and Palynology 107: 55-81. [ Links ]
28. Hjelle, K. L. 1999b. Use of Modern Pollen Sampled and Estimated Pollen representation factors as aids in the interpretation of cultural activity in local pollen diagrams. Norwegian Archaeological Review 32: 19-39. [ Links ]
29. Hjelle, K. L.; I. K. Mehl, S. Sugita & G. L. Andersen. 2015. From pollen percentage to vegetation cover: evaluation of the Landscape Reconstruction Algorithm in western Norway. Journal Quaternary Science 30: 312-324. [ Links ]
30. Hodgson, J. G. & J. M. LMackey. 1986. The ecological specialization of dicotyledonous families within a local flora: some factors constraining optimization of seed size and their possible evolutionary. New Phytologist 104: 497-515. [ Links ]
31. Huang, T. C. 1972. Pollen Flora of Taiwan. Ching-Hwa Press. [ Links ]
32. Janssen, C. R. 1966. Recent pollen spectra from the deciduos and coniferous-deciduos forests of north-eastern Minnesota: a study in pollen dispersal. Ecology 47: 804-825. [ Links ]
33. Jato, V.; J. Rodriguez-Rajo & M. J. Aira. 2007. Use of phenological and pollen-production data for interpreting atmospheric birch pollen curves. Annals of Agricultural Environmental Medicine 14: 271-280. [ Links ]
34. Madanes, N. 1999. Análisis de la dispersión y depositación polínica en un agroecosistema en el sudeste de la Provincia de Buenos Aires (Argentina). Tesis Doctoral, Facultad de Ciencias Exactas y Naturales. Universidad de Buenos Aires, Argentina. [ Links ]
35. Madanes, N & C. A. Fernández. 2000. Estudio comparativo entre el espectro polínico recuperado de un agroecosistema y su vegetación de origen. Provincia de Buenos Aires. Argentina. Actas del Tenth Meeting of Paleobotanists and Palynologists. Universidad de Guarulhos. Revista Universidade Guarulhos, Geociencias 5(número especial): 205-207. [ Links ]
36. Madanes, N. & A. Millones. 2004. Estudio del polen aéreo y su relación con la vegetación en un agroecosistema. Darwiniana 42(1-4): 51-62. [ Links ]
37. Markgraf, V. & H. L. D´Antoni. 1978. Pollen Flora of Argentina. Modern Spore and Pollen Types of Pteridophyta, Gymnospermae and Angiospermae. The University of Arizona Press. Tucson. Arizona. [ Links ]
38. Mazier, F.; D. Galop, C. Brun & A. Buttler. 2006. Modern pollen assemblages from grazed vegetation in the western Pyrenees, France: a numerical tool for more precise reconstruction of past cultural landscapes. Holocene 16: 91-103. [ Links ]
39. Medina, M. E.; S. C. Grill & M. L. López. 2008. Palinología Arqueológica: su implicancia en el estudio del prehispánico tardío de las sierras de Córdoba (Argentina). Intersecciones en Antropología 9: 99-112. Facultad de Ciencias Sociales UNCPBA. Argentina. [ Links ]
40. Miyanishi, K & P. B. Cavers. 1984. The Biology of Canadian weeds. Portulaca oleracea L.The biology of Canadian weeds. Canadian Journal of Plant Science 60: 953-963. [ Links ]
41. Moore, P. D.; J. A. Webb & M. E. Collinson. 1991. Pollen Analysis. 2 a edition. Blackwell Scientific Publications. Oxford. [ Links ]
42. Morbelli, M. A. 1980. Morfología de las especies de Pteridophyta presentes en la región Fuego-Patagónica. República Argentina. Opera Lilloana 28: 1-138. [ Links ]
43. Mueller-Dombois, D. & E. Ellenberg. 1974. Aims and methods of vegetation ecology. John Wiley and Sons, New York. [ Links ]
44. Ortega, E.; P. Vergara, O. Vignolio & P. Laterra. 2000. Efectos de la densidad de Lotus tenuis sobre la emergencia, supervivencia y cobertura de Cirsium vulgare. Ecología Austral 10: 143-149. [ Links ]
45. Pang, R.; Q. Xu, W. Ding & S. Zhang. 2011. Pollen assemblages of cultivated vegetation in central and southern Hebei Province. Journal of Geografic Science 21(3): 549-560. [ Links ]
46. Requesens, E.; N. Madanes & L. Montes. 1989. Composición florística y dinámica de dos comunidades estacionales de malezas en Balcarce (Argentina). Revista de la Facultad de Agronomía (La Plata) 64: 53-60. [ Links ]
47. Saugier, B. 1976. Vegetation and the atmosphere. Vol II. ED. J. L. Monteith. [ Links ]
48. Solbrig, O. T. & J. Morello. 1997. Reflexiones generales sobre el deterioro de la capacidad productiva de la Pampa Húmeda argentina. In: J. Morello, O. T. Solbrig (eds.), Argentina granero del mundo: hasta cuándo? La degradación del sistema agroproductivo de la Pampa Húmeda y sugerencias para su recuperación. Orientación Gráfica Editora. Buenos Aires, Argentina. [ Links ]
49. Ter Braak, C. J. F. & P. Smilauer. 1998. CANOCO Reference manual. User´s Guide to Canoco for Windows Software for canonical community ordination Centre for Biometry Wagening in Netherlands. [ Links ]
50. Thornthwaite, C. W. 1948. An approach towards rational classification of climate. Geography Review 83: 55-94. [ Links ]
51. Tormo, R.; I. Silva, A. Gonzalo, A. Moreno, R. Pérez & S. Fernández. 2011. Phenological records as a complement to aerobiological data. International Journal of Biometeorology 55: 51-65. [ Links ]
52. Vervoorst, F. B. 1967. Las comunidades vegetales de la Depresión del Salado (Provincia de Buenos Aires). Serie Fitogeográfica. La vegetación de la República Argentina. VIII. Instituto Nacional de Tecnología Agropecuaria. INTA. Buenos Aires, Argentina. [ Links ]
53. Vuerela, I. 1973. Relative pollen rain around cultivate fields. Acta Botanica Fennica 102: 1-27. [ Links ]
54. Wright, H. E. 1967. The use of surface samples in Quaternary pollen research. Review of Paleobotany and Palynology 2: 321-330. [ Links ]
55. Zar, J. 1984. Biostatiscal analysis. 2a edition. Prentice-Hall, Inc. New Jersey. [ Links ]

