


 Inglés (pdf)
 Articulo en XML
 Referencias del artículo
 Enviar articulo por email
 Citado por SciELO
  Similares en
SciELO
Similares en
SciELO  uBio
uBio 
 Permalink
INTRODUCTION
The Neotropical dry forest has undergone significant transformation and conversion, primarily into agricultural and pasture lands (Banda et al., 2016). This forest represents one of the most threatened ecosystems in the world, and it is currently experiencing a great biodiversity loss (Miles et al., 2006; Banda et al., 2016). In remnant forest fragments, timber logging is one of the main economic activities (Shearman et al., 2012). Currently, unsustainable and intensive logging is the main global threat to the tree species categorized globally as threatened (Shearman et al., 2012). In this context, phenological information can contribute to adequate planification and decision-making for the conservation and sustainable use of timber tree species, especially for threatened species (Buisson et al., 2016).
Plant reproductive events are crucial to species’ reproductive success and population regeneration (Vasconcelos et al., 2010; Morellato et al., 2016). Studies of reproductive plant phenology assess periodic events of the plant life cycle and how these variations are correlated with regulatory factors (Borchert et al., 2015; Morellato et al., 2016; Mendoza et al., 2017). These events are essential for both plant and consumer species maintenance (Sakai, 2001). Several studies have demonstrated that reproductive phenology influences the abundance and diversity of herbivores, pollinators, frugivorous animals and plants, as well as the structure of trophic networks (Ollerton et al., 2011; Encinas et al., 2012; Abernethy et al., 2018; Gonçalves da Silva et al., 2020).
The high diversity of plant species in the Neotropics has revealed different phenological patterns, with diverse reproductive strategies occurring throughout the year and being specific to habitat type (Staggemeier et al., 2020). Plant species have developed response mechanisms to abiotic and biotic signals that induce the development of reproductive structures (Elzinga et al., 2007; Palacio et al., 2021). Both factors act individually or together to generate community-level patterns, where species coincide in their time of reproduction, to increase the likelihood of reproduction (Jazen, 1967; Cortés-Flores et al., 2019). Regarding abiotic factors, phenology in seasonal tropical forests is mainly regulated by precipitation, temperature, and photoperiod (Luna Nieves et al., 2017; Mendoza et al., 2017; Muller et al., 2019; Valentin-Silva et al., 2019). Several studies have reviewed and discussed the factors regulating the periodicity of reproductive events in plants (e.g., Luna Nieves et al., 2017; Mendoza et al., 2017; Perina et al., 2019). These studies showed the relative importance of each factor in changing the reproductive phenology according to the ecosystem studied.
The Yungas Piedmont Forest in Argentina is a subtropical and seasonal forest holding the highest percentage of species unique to the Southern Yungas (Brown & Malizia, 2004; Brown, 2009) and part of the Neotropical dry forest (Prado, 2000). The floristic richness is estimated to be around 278 woody species (Blundo & Malizia, 2009), 104 of which are trees and at least 12 have timber value (Brown & Malizia, 2004). Currently, this habitat represents a fragmented landscape with few remaining pristine forest relicts, poorly represented in the system of protected areas (Brown & Malizia, 2004; Politi et al., 2021). In addition, the Yungas Piedmont Forest is under intense timber extraction. This activity will probably increase in the future due to the increasing demand for wood without sustainable forest management (Tejedor-Garavito et al., 2012; Schaaf et al., 2020). The 12 mentioned valuable timber species have different economic value including two species of low value (Enterolobium contortisiliquum (Vell.) Morong and Parapitadenia excelsa (Griseb.) Burkart), seven species of intermediate value (Anadenanthera colubrina Griseb, Calycophyllum multiflorum Griseb, Handroanthus impetiginosus (Mart. ex DC.) Mattos, Handroanthus ochraceus (Cham.) Mattos ssp. ochraceus, Jacaranda mimosifolia D. Don, Myracrodruon urundeuva Allemão and Phyllostylon rhamnoides Taub.), and three species with high value (Amburana cearensis (Allemão) A.C. Sm., Cedrela angustifolia DC., and Myroxylon peruiferum L. f.,) (Humano, 2013). Historically, the 12 timber species had been intensively and inadequately exploited for timber production in the Argentinian Yungas, leading to severe reductions in population sizes (Humano, 2013; Humano et al., 2020). Four of the twelve species (A. cearensis, C. angustifolia, H. impetiginosus, J. mimosifolia) are listed as under threat on the IUCN Red List and another four are not yet categorized (H. ochraceus, C. balansae, C. multiflorum, and P. rhamnoides) (IUCN, 2022). Furthermore, a recent study has shown that four species categorized as Least Concern by the IUCN could be recategorized (Nazaro et al., 2021).
Considering that the Yungas Forest is one of the biodiversity hotspots in Argentina (Myers et al., 2000; Brown et al., 2009) mainly threatened by unsustainable logging (Tejedor-Garavito et al., 2012; Tallei et al., 2023), we need biological and ecological studies at the species level to better comprehend the ecosystem functions, especially for threatened species or species of forestry interest (Justiniano & Fredericksen, 2000; Morellato et al., 2016, Muñoz Chila, 2023). For this reason, a detailed description of reproductive phenological patterns of economically important tree species is essential for making management decisions (Buisson et al., 2016; Luna-Nieves et al., 2017). In the present study, we described the reproductive phenological patterns of eight timber tree species in the Argentinian Yungas Piedmont Forest. We tested whether local climatic variables modulate reproductive phenological patterns, addressing the following questions: (1) Is the reproductive phenology of each species seasonal? (2) Are there any differences in the flowering and fruiting patterns between species? (3) Are phenophases modulated by climatic variables?
MATERIALS AND METHODS
Study areas
The present study was carried out in the Piedmont Forest, the lower altitudinal belt of vegetation in the Southern Andean Yungas Forest (Cabrera & Willink, 1973; Arana et al., 2021). This region has been identified as one of the most important hotspots of global biodiversity (Myers et al., 2000). The Piedmont Forest is limited by the Yungas Mountain Forests to the west and the Chaco Dry Forests to the east (Brown et al., 2001). The Piedmont Forest is between 400 and 700 m a.s.l. and has a marked rainfall seasonality with concentrated precipitation in the summer (December to March) (Brown et al., 2001; Mogni et al., 2015) although seasons can be divided into wet (October to March) and dry (April to September). The Piedmont Forest has a high density of endemic woody species, with 40 out of the 104 tree species mentioned being endemic to the northern sector of the Yungas (Salta y Jujuy, Humano et al., 2020). This forest is also one of the most seasonal forest systems in South America, where approximately 70 % of the tree species are deciduous during the dry season (Sarmiento, 1972; Brown et al., 2009; Banda et al., 2016). The dominant tree species form a canopy with a height of 25 to 35 m (Brown et al., 2009). The Piedmont Forest has been severely transformed and about 90 % of its original surface has been converted into urban, agricultural, and pasture areas, among others (Brown et al., 2009). Furthermore, this ecosystem’s remaining forests (approximately 908,000 ha) are exploited by selective extraction of timber species (Brown et al., 2009; Humano et al., 2020). The sites selected for this study are located in the province of Jujuy, north-western Argentina (Finca Yuchán: 23º 56’S-64º 54’W and Parque Nacional Calilegua: 23º 38’S - 64º 35’W, Fig. 1). These sites have not been subjected to anthropogenic disturbance for at least the past 45 years.
Species Selection
We selected the study species according to their presence/absence and abundance. We fixed a minimum of five individuals to characterize phenological patterns. A preliminary assessment of the study area failed to detect two species (Enterolobium contortisiliquum and Handroanthus ochraceus) and showed two species with low numbers of individuals (Amburana cearensis and Handroanthus impetiginosus). From the 12 timber tree species mentioned, we selected eight based on our criteria of presence and abundance: Anadenanthera colubrina (n=119), Calycophyllum multiflorum (n=33), Cedrela angustifolia (n=6), Jacaranda mimosifolia (n=7); Myracrodruon urundeuva (n=28), Myroxylon peruiferum (n=5), Parapiptadenia excelsa (n=22), and Phyllostylon rhamnoides (n=113). All species are deciduous, fruits have anemochorous dispersal (Blundo et al. 2015), and small flowers, generally inflorescences, which are pollinated by insects and, to a lesser extent, by the wind. (Gimenez & Moglia, 2003; Teixeira de Moraes et al., 2004; Kiill & da Silva, 2016; Mendez et al., 2016; Torres & Pereira, 2018). The exception is J. mimosifolia with large flowers pollinated by insects and birds (Alves et al., 2010). Nomenclature follows Zuloaga et al. (2016).

Phenological observations
We established 20 phenology transects of 100 × 6 m (10 in each site) to determine the trees reproductive phenology. To determine reproductive phenology, we marked at least five individuals of each tree species, with diameter at breast height >10 cm, as trees of this size or larger have a high probability of being reproductive (Bullock & Solís-Magallanes, 1990). All trees were mapped and marked with an aluminum tag to facilitate relocation. We carried out the phenological observations from June 2014 to May 2016, from the ground and using binoculars, and always within the same period of each month. We recorded the phenophases flowering and fruiting in which we measured the intensity using Fournier’s (1974) semi-quantitative scale of five categories (0-4) with an interval of 25 % between each other. This scale registers the percentage of the crown occupied by flowers (flowering) and fruits (fruiting) in each marked individual tree.
Climatic variables
We obtained a monthly value of climatic data for each site (minimum and maximum temperature and mean rainfall) from the global database WorldClim (Hijmans et al., 2005) and calculated the photoperiod following Fernández-Long et al. (2015). We used the average value of the two sites (Appendix 1) to characterize the study area due to the small differences between sites.
Statistical analysis
We analyzed the observations at the species level in both sites. Preliminary analyses have shown that sites’ identity has no influence on the phenodynamics of plant species, thus, all calculations considered the entire study area. For each phenophase, we estimated intensity, duration, and seasonality. Intensity was based on Fournier’s (1974) index to evaluate the proportion of flowering and fruiting within species and month (values lower than 25 % indicate a low intensity, between 25 and 50 % medium intensity; and higher than 50 %, high intensity). Intensity values were averaged over individuals for each species by month and used as a phenological index of intensity (Bencke & Morellato, 2002). We estimated phenophase duration using the mean number of months (± SD) in which flowers or fruits were observed and classified it as short (< 2 months), intermediate (2-5 months), or extended (> 5 months) (Newstrom et al., 1994). Finally, we evaluated seasonal patterns for each species using circular statistics to test the null hypothesis that flowering and fruiting were evenly distributed around the year. Circular statistics estimate the mean vector length (r) and mean angle (μ). The mean angle indicates the mean date (month) in which the largest number of individuals of a given species presented a phenophase. Each month corresponds to an angle: January 0°, February 30°, and so on. The r vector estimates the degree of dispersion or concentration of the observations around the main angle, and range from 0 (data totally homogeneous distributed around the year) to 1 (all data are concentrated in a single angle) (Morellato et al., 2010). The Rayleigh test was used to determine whether phenology was randomly distributed (p > 0.05) or not (p < 0.05) (Morellato et al., 2010). These analyses were performed using Oriana software (Kovach, 2004).
We analyzed the relationship between reproductive phenology and climatic variables through the Generalized Additive Model for Location, Scale, and Shape (GAMLSS) (Stasinopoulos & Rigby, 2007). This modeling approach works with a wide range of distributions and link functions to the model the response variable (Stasinopoulos & Rigby, 2007). Another advantage of GAMLSS models accounts for data autocorrelation (Stasinopoulos & Rigby, 2007; Hudson et al., 2010). The GAMLSS models have been used in phenological studies due to temporal autocorrelation inherent to phenological series (Hudson et al., 2010; Muller et al., 2019; Vogado et al., 2022). The presence/absence of flowers and fruits were set as response variables and the climatic factors as explanatory variables. Before running the models, we evaluated the correlation between independent variables and excluded those with high collinearity (Spearman’s correlation > 0.7, Appendix 2). The climatic variables were standardized (mean 0, variance 1) before their inclusion in the full model to obtain comparable parameter estimates. We selected final models based on the Akaike’s information criterion (AIC) (Burnham & Anderson, 2004) and also calculated CraggUhler´s pseudo R-squared values for each model.
Analyses and graphs were performed in R software (R Core Team, 2021) using the MuMIn (Burnham & Anderson, 2002), gamlss (Rigby & Stasinopoulos, 2007) and ggplot2 (Wickham et al., 2016) packages.
RESULTS
Phenological patterns
Our study of eight timber tree species showed that the reproductive phenophases occurred with intermediate intensity (30 %). Flowering occurred from August to January and showed two peaks: one during the dry season and another at the beginning of the wet season. Most species showed flowering intensity peaks at the beginning of the wet season, but only Myracrodruon urundeuva, Myroxylon peruiferum, and Parapiptadenia excelsa, showed intensity peaks during the dry season (Fig. 2). All species showed a short Flowering duration ranging from one to three months (1.62 ± 0.59).

Fig. 2 Monthly mean values of flowering intensity (expressed as percentage) over a two-year period for eight timber tree species in the Yungas Piedmont Forest of Jujuy, Argentina. Color version at https://www.ojs.darwin.edu.ar/index.php/darwiniana/article/view/1098/1303
Almost all species showed at least a two months lag between the presence of flowers and fruits, except for Anadenanthera colubrina, M. peruiferum, and Phyllostylon rhamnoides, which overlapped both phenophases. Fruiting, however, was observed throughout the year, with most species showing intensity peaks in the dry season except for three species having intensity peaks during the wet season (M. urundeuva, M. peruiferum, and P. rhamnoides) (Fig. 3). The beginning and duration of the fruit production period varied among species, but fruiting was usually longer than the flowering period, ranging from one to six months (3.5 ± 1.73).
The circular analyses showed that both reproductive phenophases were highly seasonal in all tree species (Appendix 3), in which the largest number of individuals presented an intensity peak of both phenophases around one or few months. For most species, flowering was concentrated in the wet season (Appendix 3). Fruiting showed the opposite pattern, as fruiting occurred during the dry season for most species (Appendix 3).
Relationship between reproductive phenology and climatic variables
The GAMLSS model indicated that the photoperiod was the best predictor for both flowering and fruiting phenophases in almost all species, although the sign of the relationships differed between species (Table 1, Appendix 4). For all the studied species, except Myracrodruon urundeuva and Calycophyllum multiflorum, flowering was significantly related with photoperiod (Table 1). The flowering of M. urundeuva was negatively related with precipitation, while C. multiflorum flowering was positively related with precipitation (Table 1). The fruiting of M. urundeuva, Myroxylon peruiferum, and Phyllostylon rhamnoides was positively related with photoperiod (Table 1), while the fruiting of Anadenanthera colubrina, C. multiflorum, Jacaranda mimosifolia, and Parapitadenia excelsa was negatively related with photoperiod (Table 1). The only species in which precipitation was negatively related with fruiting was Cedrela angustifolia (Table 1).
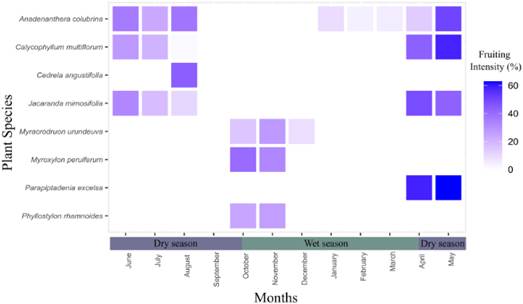
Fig. 3 Monthly mean values of fruiting intensity (expressed as percentage) over a two-year period for eight timber tree species in the Yungas Piedmont Forest of Jujuy, Argentina. Color version at https://www.ojs.darwin.edu.ar/index.php/darwiniana/article/view/1098/1303

Table 1 Results of the GAMLSS models constructed to assess the relationship of flowering and fruiting with climatic variables for eight timber tree species in the Yungas Piedmont Forest of Jujuy, Argentina. The table contains the values obtained for the Cragg Uhler’s pseudo R-squared (R²), estimator (β), standard error (SE), t, and p-value.
DISCUSSION AND CONCLUSIONS
Our results revealed that the reproductive phenology of timber trees in the Yungas Piedmont Forest presented an intermediate intensity (< 40 %), and flowering showed a short duration episode each year (< 3 months). The reproductive phenophases were seasonal and mainly modulated by photoperiod. Studies on flora carried out in the Piedmont Forest were mainly focused on the vegetation composition and structure (Aragón & Morales, 2003; Malizia et al., 2009a; Malizia et al., 2009b; Blundo, 2013; Humano, 2013). Thus, the present study will provide valuable information for the management of timber tree species and serve as a starting point for future studies on plant phenology at the species level in this region. Knowledge of flowering and fruiting times marks the months in which they occur, facilitating the appropriate planning of seed collection, and supporting conservation and restoration actions (Justiniano & Fredericksen, 2000; Morellato et al., 2016; Muñoz Chila, 2023). This information is relevant, especially for species with low natural density, which is accentuated by tree extraction activities (Martínez-Peralta et al., 2022).
In our study region, flowering and fruiting occurred during both dry and wet seasons but showed different patterns between tree species. According to the reproductive phenology patterns, we can classify the tree species as follows: (1) flowering in the dry season and fruiting in the wet season (Myracrodruon urundeuva and Myroxylon peruiferum); (2) flowering during the wet season and fruiting in the dry season (Anadenanthera colubrina, Calycophyllum multiflorum, Cedrela angustifolia, Jacaranda mimosifolia and Parapiptadenia excelsa); (3) flowering and fruiting in the wet season (Phyllostylon rhamnoides).
Differences in time at flowering and fruiting between species can be explained by abiotic factors in conjunction with tree functional traits that allow optimal use of water and nutrient reserves necessary for physiological processes related to reproduction (Rivera et al., 2002; Borchert et al., 2004). Tree flowering during the late dry season up to early wet season has been observed in other Neotropical seasonal forests (Justiniano & Fredericksen, 2000; Batalha & Martins, 2004; Luna-Nieves et al., 2017; Lacerda et al., 2018; Corredor-Londoño et al., 2020). In addition, our results showed that trees’ reproductive intensity may be triggered by photoperiod, which has been considered an important factor for flowering (Borchert et al., 2004, Borchert et al., 2005; Souza & Funch, 2017). Most of the studied species began to flower after the spring equinox, which requires a photoperiod of more than 12 hours to initiate flowering (Jackson, 2009; Calle et al., 2010), and the increase in daylength activate molecular processes that can break the dormancy of flower buds (Borchert & Rivera, 2001). Precipitation was negatively related to the flowering of M. urundeuva, thus, water stress would be a trigger for flowering in this species. This pattern for M. urundeuva has also been observed in a seasonal forest in Brazil (Ferreira Nunes et al., 2008). For the rest of the studied species, flowering and precipitation were unrelated. Most species flowered during the wet season, whereby variation in rainfall and soil water could regulate the tree flowering periodicity in the Yungas Piedmont Forest. Higher precipitation during the wet season would promote anthesis, which is sensitive to water stress (Borchert, 1994).
The observed flowering seasonality has been interpreted as a response to pollinators (Batalha & Martins, 2004; Bentos et al., 2008). Since tree species in tropical forests are mainly pollinated by insects (Hilje et al., 2015), flowering registered during the dry and wet seasons might be a mechanism to maximize pollination success which coincides with a higher abundance of pollinators (Sakai, 2001). In our study area, the timber tree species studied are deciduous (Brown et al., 2001; Malizia et al., 2012) and flowering of almost all species corresponds with leaf fall. Leaf loss decreases photosynthetic activity and may result in stem rehydration for flowering (Singh & Kushwaha, 2016), and can facilitate flower visibility for pollinators (Lima & Damasceno-Junior, 2020).
Fruiting was mainly concentrated in the driest period of the year, which is explained by the type of fruit dispersal of these species (Perina et al., 2019). All studied species have anemochoric diaspores, and this strategy indicates a clear adaptation to forests with a marked seasonality (Malizia et al., 2012). During the dry season, wind dispersal is improved due to stronger winds and the lower number of tree leaves (Griz & Machado, 2001; Perina et al., 2019). Furthermore, anemochory syndrome involves little investment in fruits and seeds (Janzen, 1980). Even though fruiting phenology is strongly related to precipitation in seasonal forests (Morellato et al., 2013; Lunes-Nieves et al., 2017; Mendoza et al., 2017; Perina et al., 2019), we found that fruiting was modulated mainly by photoperiod. In addition, although the statistical relationships between fruiting and photoperiod were not strong, we found that tree species with the fruiting peak in the dry season were negatively associated with photoperiod, and the opposite occurred in species with the fruiting peak in the wet season. A possible interpretation of this pattern would be related to atmospheric conditions. Thus, the driest atmospheric conditions could favour fruit ripening and seed dispersal of species with fruiting peaks in the dry season, reinforcing the role of seed dispersal strategies in reproductive phenology (Van Schaik et al., 1993; Perina et al., 2019). On the other hand, the different patterns would be related to the optimization of seed germination rates (Van Schaik et al., 1993; Perina et al., 2009).
In conclusion, the reproductive phenological patterns of the timber tree species observed in the Yungas Piedmont Forest were seasonal, conditioned by climatic variables where the photoperiod was the main modulating factor. The interspecific variation in reproductive phenological strategies observed in this study highlights the importance of plant functional traits and biotic factors together with environmental cues in shaping the phenological strategies of each species. We emphasize that understanding phenological patterns is critical for improving our comprehension of the ecosystem functioning and for supporting conservation and restoration efforts for threatened and economically important species in Andean forests.

