Inglês (pdf)
 Artigo em XML
 Referências do artigo
 Enviar este artigo por email
 Citado por SciELO
  Similares em
SciELO
Similares em
SciELO 
 Permalink
KEY POINTS
• Obesity disparities by region and socioeconomic status can provide insight into local drivers of obesity rates and inform public health policy.
• This study found that regional differences in obesity prevalence were relatively small but that disparities by SES status were large.
• This study also found that disparities in obesity by socioeconomic status were more pronounced for women (than for men) and that the Patagonian region had the highest obesity prevalence for both men (36%) and women (37%).
Obesity prevalence and incidence rates con tinue to rise across most countries, especially in low- and middle-income nations1. With mul tiple drivers and an often-complex epidemiol ogy, obesity proves to be a challenge for govern ments and public health officials trying to create a structured approach to prevention and treat ment. In Latin America -notably, the most un equal region of the world2 -obesity rates are not only rising across the board but are also becom ing increasingly associated with lower socioeco nomic status3. However, while increasing socio economic health disparities have been noted in many countries, this trend is not uniform across the region, furthering the difficulties of one-size-fits-all public health measures3.
Shaped by distinct histories and economic development patterns, drivers of obesity may vary by country, region, population group, and local customs, resulting in geographic variance in obesity prevalence. In the United States, for example, regional differences in obesity are very large, in the order of 6 absolute percent age points, with the poorer, southeastern and midwestern parts of the country having a prev alence of obesity of 34%4. Disparities between individual states are even larger, reaching as high as 15 percentage points4. In both England and Spain, significant health disparities across an array of metrics have been recorded between the Northern and Southern regions5,6.
In Argentina, obesity has increased for both men and women in the last decades3,7. In addi tion, the gap in obesity rates between the low est and highest income groups has increased from 7.6 percentage points to 10.2 for women from 2005 to 20133. Overall increases in national socioeconomic disparities in obesity rates may obscure important regional differences in this county, which is characterized by a Northern re gion with an strong indigenous culture; a cen tral region that includes the most populated cities and richest agricultural territories; and a Southern region that was colonized less than 200 years ago and remains the least densely populated area of the country8.
We leveraged data from the latest Argentine National Survey of Risk Factors to examine the relationships between socio-economic status, gender, regions and provinces, and obesity rates in Argentina.
Materials and methods
National Risk Factor Survey
This study used data from Argentina’s 4th National Survey of Risk Factors, conducted in 2018 (ENFR 2018), which was designed and administered by the Argentin ian National Institute of Statistics and Census and the Ministry of Health and Social Development of the Nation7. The ENFR is a nationally representative survey study that samples from all adults living in localities with 5000 or more inhabitants7. The ENFR gathers participant reported demographic and health data including tobacco use, diet, and alcohol consumption, and measures blood pressure and cholesterol levels in a sub sample. Body mass index (BMI) is calculated using height and weight recorded by trained staff at the time of survey administration. See Table 1 for sample size breakdown by region and gender. More information on the methodology of ENFR data collection can be found in official reports7. In this study, we defined obesity as BMI greater than or equal to 30 for both men and women.

Socioeconomic status definition
There is no broadly accepted way to measure socio economic status (SES) in middle-income countries such as Argentina9. Many studies use either education or in come alone, or some combination of these and other fac tors10-13. We chose a combined approach, considering both education and household income -the two most com mon measures- to create a dichotomous SES categoriza tion (low SES, or middle/high SES).
According to data from the ENFR 2018, more than 88% of 18-64 year old Argentine adults finished elementary school (this number increases to more than 90% among adults younger than 55), while only 42.8% finished sec ondary school (equivalent to 12 years of education)7. Thus, secondary education completion was chosen as the cutoff point in this study to best capture educational disparities.
We followed the protocol on measuring poverty by in come described in 2018 by the Economic Commission for Latin America. Their report established ‘not low income’ as the first quintile whose percentage of households with unsatisfied basic needs does not exceed 10%14. In Argen tina, this happens from the third quintile onwards. Given this, we categorized people in the lowest two quintiles as low SES.
Therefore, participants in this study were categorized as having low SES if they did not finish high school and/ or reported a household income in quintiles 1 or 2. This combined dichotomization allows us to capture both a life-standing proxy of SES -education level- while also capturing potential recent changes in SES status due to income.
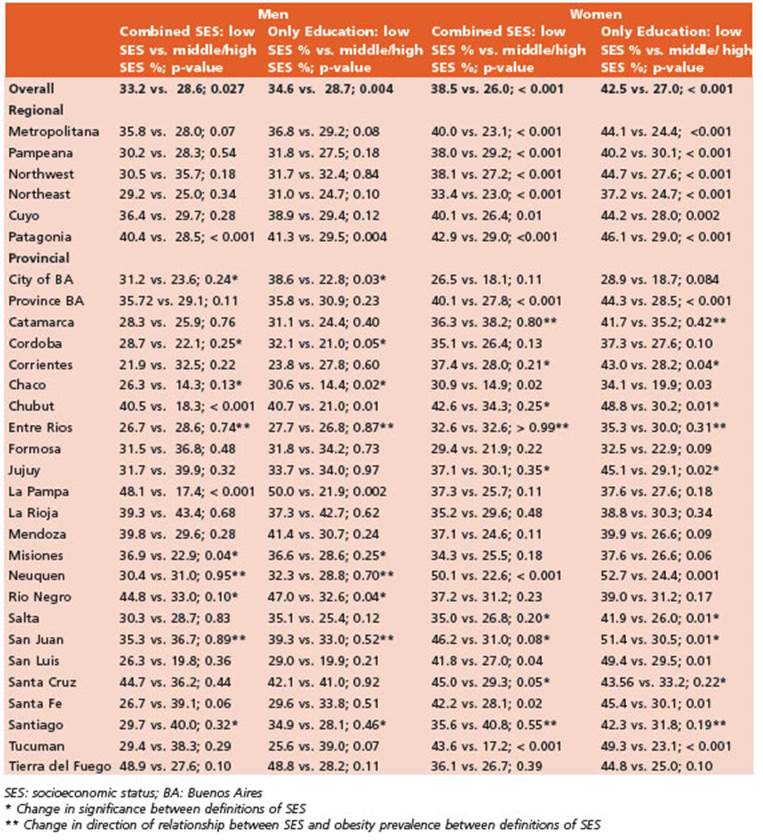
We performed a sensitivity analysis comparing our primary combined income and education definition of SES and an alternative definition including only educa tion (Appendix). We looked at significance and direction of the relationship between SES and obesity prevalence across regions and provinces with each of the two defini tions of SES for both men and women.
Geographic variation
We defined the Metropolitan area as consisting of Buenos Aires City and the surrounding metropolitan area that belongs to the province of Buenos Aires; Pam peana as the rest of the province of Buenos Aires, and the provinces of Cordoba, Entre Rios, La Pampa and San ta Fe; Northwest (NOA) as provinces Catamarca, Jujuy, La Rioja, Salta, Santiago, and Tucumán; Northeast (NEA) as Corrientes, Chaco, Formosa, and Misiones; Patagonia as Chubut, Neuquén, Rio Negro, Santa Cruz, and Tierra del Fuego; and Cuyo as Mendoza, San Juan, and San Luis (Fig. 1).

Data analysis
Data analysis was conducted using STATA software version 13 (STATA Corp LP; College Station, Texas, EE. UU.). Mean and standard deviation are reported for continu ous variables. For categorical variables, we report n and corresponding percentages. Statistical significance was defined with a two-sided alpha of 0.05 (p-values < 0.05). Descriptive analysis stratified the sample by sex and compared obesity rates by socioeconomic status, prov ince and region using Chi-square test for categorical vari ables. Logistic regression models adjusted for age and SES (model 1) and age, SES and region (model 2) explored the association between obesity, socioeconomic status, and region - both overall and stratified by sex.
Results
Table 1 shows the population distribution by gender and region evaluated in the 4th National Risk Factors Survey. The total sample popula tion used was n = 29,226-52% female, 48% male, with an average age of 43.9 years (SD 17.8) over all - 44.1 (SD: 18.7) for women and 43.8 (SD: 16.7) for men. In 2018, Argentina had an overall adult obesity rate of 32.4%: 31.4% for men and 33.4% for women (Fig. 2).
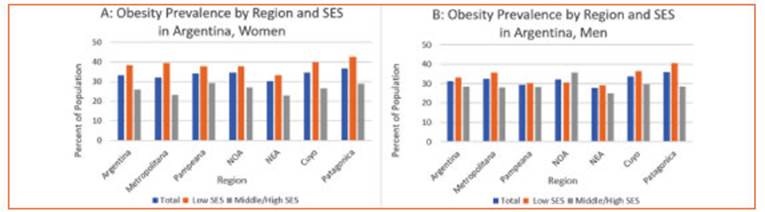
Table 2 presents results of obesity prevalence by gender, SES status, region and province. Aver age BMI for the population was 28 (SD: 5.8) overall and 28 for both women (SD: 6.6) and men (SD: 4.9). Analysis by region showed that, for men, regional obesity rates were lowest in NEA (27.8%), followed by Pampeana (29.5%), NOA (32.0%), Metropolitana (32.3%), and Cuyo (33.7%); the highest obesity rate for men was in Patagonia (Southern region) (35.9%) (Fig. 2). Rates for women were higher than for men in all regions but followed similar spatial trends. Rates for women by increasing prevalence were as follows: NEA (30.3%), Metropolitana (32.3%), Pam peana (34.2%), NOA (34.8%), Cuyo (34.8%) and Pata gonia (36.9%) (Fig. 2).

Bivariate analysis showed that country-wide differences in obesity rates between individuals of low SES compared to middle/high SES were significant for both men and women. Among men, the national obesity rate for those with low SES was 33.2% versus 28.6% for those with middle/high SES (p = 0.0274); national rates for women were 38.5% for low SES and 26.0% for middle/high SES (p < 0.001). The prevalence of obesity was highest among women of low SES in all regions. The biggest SES disparities in women were seen in the regions of Metropoli tana (39.6% prevalence of obesity in low SES vs. 23.1% in middle/high SES; p < 0.001), Patago nia (42.9% in low SES vs. 29.0% in middle/high SES; p = < 0.001) and Cuyo (40.1% in low SES vs. 26.4% in middle/high SES; p = 0.0092). Three ar eas: NOA (38.1% in low SES vs. 27.2% in middle/ high SES; p < 0.001), NEA (33.4% in low SES vs. 23.0% in middle/high SES; p = 0.004) and Pam peana (38.0% in low SES vs. 29.2% in middle/high SES; p = 0.004) had smaller disparities. Among men, by contrast, obesity disparities by SES were only significant in Patagonia, where the obesity rate was 11.9 percentage points higher for men of low SES compared to men of middle/high SES (p = 0.004) (Table 2). Provincial level results are also shown in Table 2.
Age adjusted logistic regression analyses with only SES as a co-variate showed that low SES was associated with increased likelihood of obesity in the country as whole (OR 1.43, 95% CI 1.26, 1.62). Sex stratification revealed that only disparities among women (OR 1.71, 95% CI 1.45, 2.02) by SES, and not those among men (OR 1.17, 95% CI 0.97, 1.42), were significant on a national scale (Table 3).
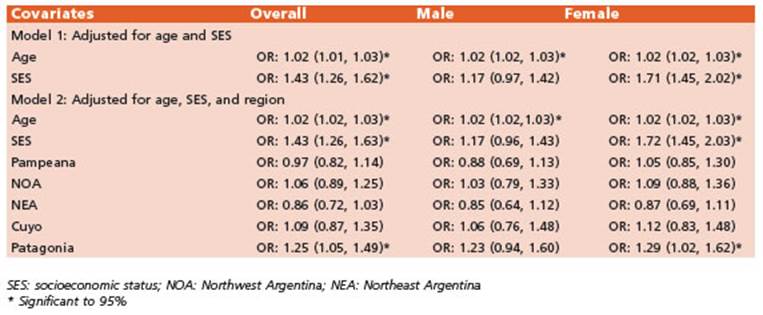
Table 3 Obesity association with age, SES, and region, overall and stratified by sex; Argentina, 2018
The addition of region as a co-variate in the model found that the Patagonian region was significantly associated with an increased risk of obesity for the population overall in age-ad justed analyses (OR 1.25, 95% CI 1.05, 1.49), as was SES (OR 1.43, 95% CI 1.26, 1.63). A gender-stratified analysis with region and SES showed that SES (OR 1.72, 95% CI 1.45, 2.03) and the Patagonian region (OR 1.29, 95% CI 1.02, 1.62) were the only significant predictors for women; among men, neither region nor SES were sig nificantly associated with increased risk of obe sity (Table 3).
A one-year increase in age was associated with a statistically significant marginal increase in risk of obesity in all regression analyses (OR 1.02, 95% CI 1.01, 1.03) (Table 3).
Sensitivity analysis results were robust for univariate regional analyses, showing no differ ence in significance or directionality between single or combined definitions of SES in any re gion. Significance differed in 6 provinces and di rectionality differed in 3 provinces for both men and women. In multivariate analyses, signifi cance only varied marginally in the Patagonian region for women. All other multivariate analy ses were robust in significance and directional ity between single and combined definitions of SES (Appendix).
Discussion
In this analysis of regional obesity rates by so cioeconomic status and gender, we found that regional differences were evident though not very pronounced. By contrast, differences by so cioeconomic status were large -particularly for women- and were robust to distinct definitions of SES.
Overall, we found that women of low socio economic status consistently have the highest rates of obesity in Argentina in both regional and provincial analyses. This is in accordance with prior literature focused only on provincial analy ses15. Disparities in disease burden for women by SES were found in all regions and six provinces. While our study did not investigate drivers of gender-based disparities, other authors have hypothesized that the stronger effects of SES on women’s BMI compared to men may be due to occupational differences stemming from higher prevalence of manual labor in men of low SES, or to sociocultural pressures to fit aesthetic stan dards faced in particular by women of middle/ high SES15,16. Child bearing, a driver of obesity in women, may also differ by SES17.
We found that the Patagonian region had both the highest rates of obesity and the high est rates of SES disparities in obesity. The Pa tagonian region is both more rural and prone to colder weather than the rest of the country; however, while these two factors have been as sociated with overall higher rates of obesity in other parts of the world due to lifestyle and biological factors18,19, associations with increased disparities due to urbanicity or climate in Argen tina are underexplored.
In countries such as the United States, region of inhabitance has been found to be a signifi cant predictor of obesity rates, even surpassing race or socioeconomic status20. However, in Ar gentina, we found that socioeconomic status is a more important predictor than region of residency. In Argentina, unlike the U.S, diet and exercise levels may not differ dramatically be tween regions. However, diet may differ within regions by socioeconomic stats due to access to healthy food or food cost, which may contribute to disparities in obesity by SES21. Our findings are in line with analyses from other countries that have reported socioeconomic disparities that surpass regional disparities in effect; one study in Spain found that differences in BMI between the Northern and Southern regions were driven mainly by women and by years of schooling (their proxy for SES), a pattern that was noted in our data as well6. This study noted an aver age north-south BMI difference of 0.55 kg/m2 for women and 0.128 kg/m2 for men6.
This study has a few limitations. Although the use of BMI to determine obesity is com monplace, BMI calculation does not take into account muscle mass, bone density, or body fat percentage, making its use as a measure of obe sity susceptible to misclassification22. Men are particularly susceptible to the flaws of BMI and are more often misclassified as obese than wom en22. Further, 2018 ENFR is only representative of areas of population 5000 or more, so results could differ in smaller towns. Nevertheless, it is estimated that 70% of Argentinean population live in one of the 31 biggest cities of the country, while only 8% is rural (lives in town of less than 2000 people)23. Lastly, our models do not account for possible mediating factors such as diet and exercise, or other comorbidities.
As obesity rates continue to increase for those of low socioeconomic status around the world and in countries such as Argentina, the need for comprehensive public health measures on national and regional levels are imperative. Although Argentina does count with a govern mental structure for the evaluation of obesity (including the Office for the Promotion of Health and Control of Non-communicable Diseases and a national data source)24, the country lacks regu lations present in other parts of Latin America such as taxes on sugar sweetened beverages, regulations of marketing on foods or foods in schools, and programs that promote physical activity, nutrition education, family agriculture, and healthier environments24.
These data should be used to guide both preventative and interventionist public health measures to address obesity. Policies should aim to address drivers of disparities considering not only regional differences, but also gender and SES in particular. Further research is needed to understand the drivers behind these disparities, with a specific emphasis on investigating why these disparities vary in size across regional and provincial boundaries as well as between men and women.