


Serviços Personalizados
Journal

Artigo
 texto em
  Inglês (pdf)
 Artigo em XML
 Referências do artigo
 Enviar este artigo por email
Indicadores
-
 Citado por SciELO
Links relacionados
-
 Similares em
SciELO
Similares em
SciELO
Compartilhar

 Permalink
Archivos argentinos de pediatría
versão impressa ISSN 0325-0075versão On-line ISSN 1668-3501
Arch. argent. pediatr. vol.114 no.6 Buenos Aires dez. 2016
http://dx.doi.org/10.5546/aap.2016.543
ORIGINAL ARTICLE
http://dx.doi.org/10.5546/aap.2016.eng.543
Blood lead levels in children aged between 1 and 6 years old in La Plata, Argentina. Identification of risk factors for lead exposure
Enrique Martins, Biochemist,a Ana Varea, Biochemist,a Karina Hernández, M.D.,a Marisa Sala, M.D.,a Ana Girardelli, M.D.,b Victoria Fasano, Doctoral Degree in Mathematics,a and Liliana Disalvo, Biochemista
Collaborators: Silvia Pereyras, Biochemist, Natalia Alvarez, Technician.
a. Pediatric Research and Development Institute (Instituto de Desarrollo e Investigaciones Pediátricas, IDIP) "Prof. Dr. Fernando E. Viteri". Hospital de Niños "Sor María Ludovica", La Plata. Ministry of Health/ Scientific Research Commission of the Province of Buenos Aires. La Plata.
b. Department of Toxicology. Hospital de Niños "Sor María Ludovica". La Plata.
E-mail address: Enrique Martins, Biochemist, enriqueflmartins@gmail.com
Funding: This study was funded by the Health Research Scholarship granted by the National Ministry of Health of Argentina, and a scholarship granted by the Argentine Society of Pediatrics (Sociedad Argentina de Pediatría).
Conflict of interest: None.
Received: 1-7-2016
Accepted: 6-8-2016
ABSTRACT
Introduction. Lead has neurotoxic effects in children, even at a very low level in blood. The risk factors (RFs) for lead exposure have not been adequately identified in La Plata. The objectives of this study were to determine mean blood lead levels and identify RFs in children aged 1 to 6 years old living in La Plata and the outskirts.
Population and methods. A cross-sectional study was conducted in children who attended primary health care centers for a health check-up. Blood lead levels were determined by atomic absorption spectroscopy, and a socioenvironmental survey was administered to outline RFs. The Mann-Whitney test was used to compare measurements. A multivariate statistical analysis was done to establish the most relevant RFs.
Results. A total of 319 children participated (51% were boys); the median (interquartile range) blood lead level was 2.2 pg/dL (1.1-3.6 pg/dL). Significant mean differences in blood lead levels were observed for age < 3 years old, anemia, pica behavior, overcrowding, dirt floors, and maternal education < 7 years. Age < 3 years old and pica behavior were both RFs with significant odds ratios (ORs). The OR as adjusted by logistic regression was significant only for age < 3 years old.
Conclusions. The median blood lead level in the studied population was 2.2 pg/dL. The main RFs identified for lead exposure were age < 3 years old and pica behavior. Other less relevant RFs included anemia, maternal education < 7 years, overcrowding, and dirt floors.
Key words: Lead; Children; Risk factors; Environmental risk exposure.
INTRODUCTION
Lead is a naturally occurring metal found in the earth's crust. The harmful effects of lead poisoning have been known since ancient times. Humans have used lead since the Industrial Revolution and, up to the early 20th century, lead poisoning was only considered to be an occupational disease.1 Its extended environmental distribution is mainly the result of its use as a gasoline anti-knock additive.2 The prohibition of lead-based anti-knock additives has reduced blood lead levels in the worldwide population. In Argentina, the mean blood lead level in children from Cordoba was observed to decrease from 7.70 pg/dL in 1995-1996, when the prohibition was established, to 2.58 pg/dL in 2009-2010.3 In spite of the effectiveness of all these prevention efforts, human exposure to lead is still ongoing because lead does not degrade and is strongly adsorbed to soil,2 making environmental dust one of its main sources.
Lead has neurotoxic effects in children, even at a very low level. It affects their intelligence quotient and behavior, and causes attention deficit disorder and a poor academic performance.4 Children are more susceptible to lead exposure than adults, mainly because of their exploratory activities, which increase their chance of swallowing lead-contaminated dust. In addition, gastrointestinal absorption of lead is greater in children than in adults, especially in children who have iron deficiency,5,6 a common nutritional deficiency in this region.7 Given that, in the past decade, sufficient evidence has demonstrated that blood lead levels below 10 pg/dL are harmful in children, in 2012 the United States Centers for Disease Control and Prevention (CDC) recommended reducing the reference value from 10 pg/dL to 5 pg/dL.4
Several social and environmental risk factors may be considered as determinants of blood lead levels of concern,8 including living with people with an occupational exposure to lead, being part of a socially vulnerable and poorly educated population, and the presence of lead pipes and household dust accumulation. Different circumstances contribute to the latter factor, such as a house with chipped paint, dirt floors, and living close to dirt streets or high-traffic roads or near industries that involve lead management.9,11
In addition, most studies conducted in Argentina have analyzed lead exposure in children from a specific source;9,12,13 only a few have approached this issue from the perspective of risk factors (RFs) for childhood lead exposure.3,14 A study done in 2006 in children from this region indicated that 1 out of every 10 clinically healthy children who attended a health check-up had a blood lead level > 10 pg/dL.15
Deepening the knowledge of this problem and identifying RFs will make it possible to design and establish prevention strategies. Therefore, the objective of this study was to determine mean blood lead levels and identify RFs for lead exposure in children aged 1 to 6 years old living in La Plata and the outskirts.
POPULATION AND METHODS
An observational, analytical, cross-sectional study was conducted in La Plata and the outskirts between 2009 and 2012. Participants were clinically healthy children aged 1 to 6 years old who attended a primary health care center (PHCC) for periodic check-ups in the city of Berisso and in two towns from La Plata: Arturo Segui and Los Hornos. All PHCCs were located in areas far away from heavily populated urban centers and industrialized sectors.
Children with a diagnosis of chronic disease, acute disease and/or infection at the time of the study or whose mothers (or legal tutors) refused to participate in the study were excluded.
The sample size was calculated to estimate the prevalence of a blood lead level > 5 pg/dL with a 95% confidence interval (CI) and a 0.05 margin of error. The estimated number of children was 283 children, with a 50% prevalence. The reason to use this value was that there were no previous estimations available given that the prevalence observed in the previous study15 had been estimated using the reference value recommended at that time (10 pg/dL).
A 5 mL blood sample was collected by venipuncture into two vials containing lithium heparin and K3 EDTA, respectively (BD Vacutainer, Franklin Lakes, NJ, USA). Heparinized tubes were kept at -70 °C until analysis. To determine the blood lead level, heparinized blood samples were diluted 1:10 in 15% nitric acid (Merck) and centrifuged; the supernatant was analyzed using an atomic absorption spectrophotometer with a graphite-coated furnace (Varian AA 240Z, Programmable Sample Dispenser 120, Zeeman-background correction, Mulgrave, Australia). The internal quality control (IQC) was done using the Lyphochek Whole Blood Metals Control from BIO-RAD Laboratories, 8.03 pg/dL, with a percent coefficient of variation (CV%) of 6.8% between runs. IQC materials prepared at the laboratory were also used based on whole blood added with lead nitrate Pb(NO3)2 (Merck), with a mean level of 5.1 pg/dL and a CV% of 8.8% between runs. In addition, we participated in an external quality control (EQC) program called G-EQUAS (German External Quality Assessment Scheme, Erlangen, Germany, Environmental Medical Field). The percent relative error at the level reported by our laboratory, compared to the consensus value, was at a range of 7.3%-11.0%, i.e. within the acceptability range of the EQC scheme. The limit of detection (LOD) with this method was 1.6 pg/dL, and the limit of quantification (LOQ) was 3.3 pg/dL. The blood lead level reference value used in this study was 5 pg/dL, as recommended by the CDC.4
Hemoglobin was determined using a hematology counter (ABX, Pentra 60, Montpellier, France). Children were considered to have anemia if they had an hemoglobin level below 11 g/dL.16
RFs for lead exposure in children were collected using a questionnaire administered by trained staff. Questions were grouped into five areas: sociodemographic characteristics, child habits, determinants of internal and external household lead exposure, and other RFs. The sociodemographic area included questions about the child's age and sex, the geographic location of the family house, family composition (number of members and their relationship), parental employment status (formally or informally active, inactive, unemployed), and parental level of education (number of years of education completed), housing conditions (building material, floor type, presence and/or location of a bathroom, number of rooms), access to water and health services. Based on these data, we also developed the unmet basic needs (UBNs) indicator according to the methodology described by the National Statistics and Censuses Institute of Argentina (Instituto Nacional de Estadísticas y Censos, INDEC).17 Questions included in the child habits area made it possible to record data on pica behavior and the habits of putting their fingers or objects in their mouths, playing on the floor, and washing hands before eating.
The determinants of internal lead exposure included chipped paint, lead pipes, property under construction or repair, dirt floors, and hobbies or home activities that may report lead exposure, such as battery refilling or the manufacture of lead or ceramic glaze objects.
The determinants of external lead exposure included the presence, less than 100 meters away, of a gas station (fuel distribution), a car repair and/or car paint shop, a blacksmith's workshop, bus stops, high traffic roads, dirt streets, garbage dumps, or polluted streams. Other RFs included in the study were anemia and living with smokers.
The research protocol was approved by the Institutional Research Protocol Review Committee (Comité Institucional de Revisión de Protocolos de Investigación, CIRPI) of the Pediatric Research and Development Institute of Hospital de Niños Sor María Ludovica from La Plata, and the parents and/or legal tutors of the children participating in the study signed an informed consent in the presence of a witness.
The SPSS 18 software for Windows was used for data analysis. Mean blood lead levels, standard deviations (SDs), and 95% CIs were estimated. Given that blood lead levels were not normally distributed, the median blood lead level and the interquartile range (IQR) were estimated. Blood lead levels below the LOD were replaced by the 1.13 pg/dL value, obtained from the following equation: LOD/(2)% (LOD divided by the square root of 2).18 Following a descriptive analysis of the family's sociodemographic characteristics, the Mann-Whitney test was used to compare mean blood lead levels corresponding to the groups with and without RFs. Children's age was separated into two categories; the cut-off point was set at 3 years old considering that most children at that age are past the need to explore objects with their mouths.19 The association between blood lead levels above 5 pg/dL and RFs was studied by estimating the odds ratio (OR) and the x2 test. Lastly, a logistic regression model was adjusted for > 5 pg/dL as a dependent outcome measure, and for RFs with a significant mean difference and confounding variables (sex and passive smoking) as independent outcome measures. Outcome measures were selected using the backward stepwise method, with the adjustment criterion based on the lowest number of parameters possible as per Akaike Information Criterion (AIC). A value of p < 0.05 was considered significant.
RESULTS
A total of 319 children aged 1 to 6 years old participated in the study. Table 1 shows the sociodemographic characteristics of children included in the study and their families. The prevalence of anemia among children was 24.6%, 47% of children were exposed to tobacco smoke, 47% lived in precarious housing conditions, and 12% lived in overcrowded conditions.
Table 1. Sociodemographic characteristics of children and their families. La Plata and Greater La Plata, 2009-2012

The mean ± SD blood lead level was 2.9 ± 2.4 pg/dL (95% CI: 2.6-3.2, range < LOD-14.7). The median value (IQR) was 2.2 pg/dL (1.13.6). As shown in Table 2, 12.6% of children had a blood lead level above 5 pg/dL, and 31.1% were above the LOQ.
Table 2. Blood lead level distribution among children in the study. La Plata and Greater La Plata, 2009-2012

Table 3 shows the median value and IQR of RFs with a significant mean difference: age < 3 years old, pica behavior, anemia, maternal education < 7 years, overcrowding, and dirt floors.
Table 3. No. of risk factors for lead exposure. La Plata and Greater La Plata, 2009-2012

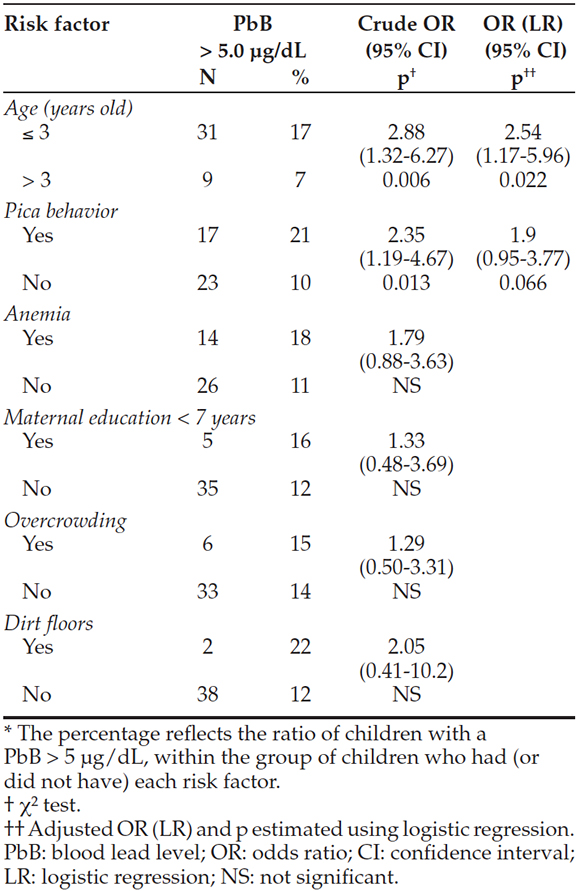
After studying the relationship between blood lead level > 5 pg/dL and the presence of RFs with a significant mean difference, a significant association was observed only with age < 3 years old and pica behavior. After completing the final logistic regression model, only age < 3 years old and pica behavior were left. Based on this model, the corresponding ORs and 95% CIs for age < 3 years old and pica behavior were estimated, and age < 3 years old was observed to be statistically significant (Table 4).
Table 4. Association between a blood lead level above 5yg/dL and risk factors with a significant mean difference in blood lead level. Result obtained from a logistic regression adjustment. La Plata and Greater La Plata, 2009-2012
DISCUSSION
The median blood lead level obtained in this study shows an exposure level similar to that published in developed countries, e.g., USA, France, and Japan.4,11,20 In Argentina, there are few ongoing studies that investigate blood lead levels in children. A study conducted in the city of Córdoba found a mean blood lead level of 2.96 pg/dL in children aged 2-3 years old, and 1.83 pg/dL in children aged 4-5 years old, similar to that observed in our study.3 Another study done in 2006 in a population with characteristics similar to those of La Plata and Greater La Plata showed that children aged between 6 months and 5 years old had a geometric mean blood lead level of 4.3 pg/dL.15 In that study, 10.8% of children had blood lead levels above 10 pg/dL, which was the level of concern at that time. A repeat assessment of data in light of the updated recommendation indicates that 47% of those children had blood lead levels above the new reference value (5 pg/dL) whereas, in this study, 13% of children had levels above the reference value. These results evidence a reduction in blood lead levels over the years. These findings are consistent with those of the study conducted by Martínez et al. in 2012,3 which compared lead levels in the city of Córdoba from 1999 and 2010 and showed a reduction following the regulation and prohibition of lead in fuels and paints.
However, according to our study, other factors may have contributed to the observed reduction. Specifically, the study conducted by Disalvo et al. in 200915 demonstrated that the factor most strongly associated with a blood lead level of concern was that related to activities involving lead handling as a source of household income. At that time, 20.4% of families who participated in the study were involved in polluting activities (e.g., collecting metals for sale, dismantling batteries, copper wire melting and burning) whereas in this study, only one family referred doing similar things. Such difference in working conditions may have contributed to reducing the household lead load.
In spite of the described reduction, and considering that there is no threshold for a blood lead level below which no adverse effects are observed,4,21,22 it is worth noting that 31% of children had quantifiable levels, and almost 13% were above the reference value.
In terms of RF analysis, in this study, age was the main determinant for a blood lead level of concern. The peak blood lead level is usually reached between 2 and 3 years old,23 which is consistent with our findings. Other factors associated with a blood lead level of concern included anemia and pica behavior. In turn, a significant association was observed between age < 3 years old and pica behavior and age < 3 years old and anemia, together with a significant association observed between pica behavior and anemia (data not shown). The interrelation among these outcome measures may account for the fact that only age < 3 years old was statistically significant after the multivariate analysis.
As described in the literature, the family socioeconomic level is a determinant factor of lead exposure.24 This study found an association between a blood lead level > 5 pg/dL and children living in a house with dirt floors, living in an overcrowded house, and whose mothers had completed less than 7 years of education.
In addition, we were not able to identify other RFs related to internal or external household lead sources, as reported in other studies.9,11 A possible explanation for this may be found in the hypothesis posed by Bernard and McGeehinn, who indicated that, in general, a blood lead level between 5 and 10 pg/dL is the result not of a specific lead source but of multiple factors.25 In this regard, a potential weakness of this study is that it did not consider diet as a major source of lead in children.26
Another limitation of this study was that results may not be generalized to the entire population of children in the region because participants may have specific sociodemographic characteristics given that they were invited to participate while attending a PHCC.
Beyond the above mentioned limitations, results indicate that children younger than 3 years old from a low socioeconomic level are at a greater risk for a blood lead level above 5 pg/dL. Considering that, in addition to environmental factors, there are other socioeconomic factors involved, it is clear that this problem should be addressed by public policymakers together with health care providers. On the one side, improving the socioeconomic conditions of the studied population may help to reduce lead levels; on the other side, a more direct prevention strategy should be considered, such as screening children who pose RFs for blood lead levels.
CONCLUSIONS
The median blood lead level in the studied population was 2.2 pg/dL. The main RFs identified for lead exposure in the studied population were age < 3 years old and pica behavior. Other less relevant RFs included anemia, maternal education < 7 years, overcrowding, and dirt floors.
Acknowledgments
The authors would like to thank the municipal authorities for granting their permission to conduct the study, the health team of each health facility who helped with children assessment, parents and caregivers, and children for participating in this study.
1. Committee on Measuring Lead in Critical Populations. Measuring lead exposure in infants children and other sensitive populations. Washington DC: National Academy Press; 1993. [ Links ]
2. Agency for Toxic Substances & Disease Registry. Toxicological profile for lead. Atlanta: ATSDR; 2007. [Acceso: 8 de junio de 2016]. Disponible en: http://www.atsdr.cdc.gov/toxprofiles/tp.asp?id=96&tid=22.
3. Martínez SA, Simonella L, Hansen C, Rivolta S, et al. Blood lead levels and enzymatic biomarkers of environmental lead exposure in children in Cordoba, Argentina, after the ban of leaded gasoline. Hum Exp Toxicol 2013;32(5):449-63. [ Links ]
4. Centers for Disease Control and Prevention. CDC response to Advisory Committee on Childhood Lead Poisoning Prevention. Recommendations in "Low Level Lead Exposure Harms Children: a renewed call of primary prevention" [Internet]. Atlanta: CDC; 2013. [Acceso: 8 de junio de 2016]. Disponible en: http://www.cdc.gov/nceh/lead/acclpp/CDC_Response_Lead_Exposure_Recs.pdf.
5. Bellinger DC. Lead. Pediatrics 2004;113(4 Suppl):1016-22. [ Links ]
6. Argentina. Ministerio de Salud de la Nación. Guía de Prevención, Diagnóstico, Tratamiento y Vigilancia Epidemiológica de las Intoxicaciones Ambientales Infantiles con Plomo. Buenos Aires: Ministerio de Salud de la Nación; 2013. [Acceso: 10 de junio de 2016]. Disponible en: http://www.msal.gob.ar/images/stories/bes/graficos/0000000293cnt-guia_intoxicaciones_con_plomo_2013.pdf.
7. Varea A, Malpeli A, Etchegoyen G, Vojkovic M, et al. Shortterm evaluation of the impact of a food program on the micronutrient nutritional status of Argentinean children under the age of six. Biol Trace Elem Res 2011;143(3):1337-48. [ Links ]
8. Lee MG, Chun OK, Song WO. Determinants of the blood lead level of US women of reproductive age. JAm Coll Nutr 2005;24(1):1-9. [ Links ]
9. De Pietri DE, García S, Rico O. Modelos geo-espaciales para la vigilancia local de la salud. Rev Panam Salud Publica 2008;23(6):394-402. [ Links ]
10. Roy A, Hu H, Bellinger DC, Palaniapan K, et al. Predictors of blood lead in children in Chennai, India (2005-2006). Int J Occup Environ Health 2009;15(4):351-9. [ Links ]
11. Oulhote Y, Le Bot B, Poupon J, Lucas JP, et al. Identification of sources of lead exposure in French children by lead isotope analysis: a cross-sectional study. Environ Health 2011;10:75. [ Links ]
12. Barberis S, Piñeiro A, López CM. Estudio sobre la contaminación ambiental por plomo en niños de la localidad de Abra Pampa (Jujuy-Argentina). Acta Toxicol Argent 2006;14(Supl):2-6. [ Links ]
13. Martínez Riera N, Soria N, Feldman G, Riera N. Niveles de plombemia y otros marcadores, en niños expuestos a una fundición de plomo en Lastenia, Tucumán Argentina. Retel 2006;11:12-22. [ Links ]
14. García SI, Mercer R. Experiencia Latinoamericana. Salud infantil y plomo en Argentina. Salud Pública Méx 2003;45(Supl 2):S252-5. [ Links ]
15. Disalvo L, Aab C, Pereyras S, Pattín J, et al. Plumbemia en niños de la ciudad de La Plata, Argentina y su relación con la deficiencia de hierro y los factores de exposición al plomo. Arch Argent Pediatr 2009;107(4):300-6. [ Links ]
16. Recommendations to prevent and control iron deficiency in the United States. MMWR Recomm Rep 1998;47(RR-3):1-29. [ Links ]
17. Instituto Nacional de Estadística y Censos. Mapa de necesidades básicas insatisfechas 2001. Buenos Aires: INDEC; 2003. [Acceso: 10 de junio de 2016]. Disponible en: http://www.indec.gov.ar/micro_sitios/webcenso/aquisecuenta/Aqui7.pdf.
18. Centers for Disease Control and Prevention. Blood lead levels in children aged 1-5 years - United States, 1999-2010. MMWR Morb Mortal Wkly Rep 2013;62(13):245-8. [ Links ]
19. Oiberman A, Mansilla M, Orellana L. Nacer y Pensar. Manual de la Escala Argentina de Inteligencia Sensorio-motriz (EAIS) de 6 meses a 2 años. Buenos Aires: Ediciones CIIPME-CONICET; 2002. [ Links ]
20. Yoshinaga J. Lead in the Japanese living environment. Environ Health Prev Med 2012;17(6):433-43. [ Links ]
21. Koller K, Brown R, Spurgeon A, Levy L. Recent developments in low-level lead exposure and intellectual impairment in children. Environ Health Perspect 2004;112(9):987-94. [ Links ]
22. Lanphear BP, Hornung R, Khoury J, Yolton K, et al. Low-level environmental lead exposure and children's intellectual function: an international pooled analysis. Environ Health Perspect 2005;113(7):894-9. [ Links ]
23. Hornung RW, Lanphear BP, Dietrich KN. Age of greatest susceptibility to childhood lead exposure: a new statistical approach. Environ Health Perspect 2009;117(8):1309-12. [ Links ]
24. Tong S, von Schirnding YE, Prapamontol T. Environmental lead exposure: a public health problem of global dimensions. Bull World Health Organ 2000;78(9):1068-77. [ Links ]
25. Bernard SM, McGeehin MA. Prevalence of blood lead levels ≥5 μg/dL among US children 1 to 5 years of age and socioeconomic and demographic factors associated with blood of lead levels 5 to 10 μg/dl, Third National Health and Nutrition Examination Survey, 1988-1994. Pediatrics 2003;112(6 PT 1):1308-13.
26. European Food Safety Authority. Lead dietary exposure in the European population. EFSA Journal 2012;10(7):2831. [ Links ]

