


Services on Demand
Journal

Article
 text in
  English (pdf)
 Article in xml format
 Article references
 Send this article by e-mail
Indicators
-
 Cited by SciELO
Related links
-
 Similars in
SciELO
Similars in
SciELO
Share

 Permalink
Archivos argentinos de pediatría
Print version ISSN 0325-0075On-line version ISSN 1668-3501
Arch. argent. pediatr. vol.115 no.2 Buenos Aires Apr. 2017
http://dx.doi.org/10.5546/aap.2017.125
ORIGINAL ARTICLE
http://dx.doi.org/10.5546/aap.2017.eng.125
Can soluble transferrin receptor be used in diagnosing iron deficiency anemia and assessing iron response in infants with moderate acute malnutrition?
Bahar Büyükkaragöz M.D.a, Necat A. Akgun M.D.b, Ayse D. Bulus M.D.c, Sultan Durmus Aydogdu M.D.d and Cengiz Bal M.D.e
a. Department of Pediatrics, Osmangazi University, Eskisehir, Turkey.
b. Department of Pediatric Hematology, Osmangazi University, Eskisehir, Turkey.
c. Department of Pediatric Endocrinology, Kecioren Research and Training Hospital, Ankara, Turkey.
d. Department of Pediatric Metabolism and Nutrition, Osmangazi University, Eskisehir, Turkey.
e. Department of Biostatistics, Osmangazi University, Eskisehir, Turkey.
E-mail address: Bahar Buyukkaragoz, M.D.: karamanbahar@yahoo.com
Funding: None.
Conflict of interest: None.
Received: 6-4-2016
Accepted: 10-13-2016
ABSTRACT
Objective. To evaluate the efficacy of soluble transferrin receptor (sTfR) in diagnosing iron deficiency anemia (IDA) and evaluating iron response in infants with moderate acute malnutrition (MAM).
Population and methods. Infants withhemoglobin (Hb) levels lower than threshold values for anemia for their ages and hypochromic/ microcytic anemia on peripheral smear were recruited. MAM was defined as weight/height z score < -2 to -3. Complete blood count (CBC), iron parameters and sTfR were compared among 41 infants with MAM and anemia (MA group), 32 infants with anemia without MAM (group A), and healthy controls (n= 30). Following anemia and malnutrition treatment, tests were repeated.
Results. Besides hematological indices compatible with IDA, serum iron (Fe) and transferrin saturation (TS) were significantly lower, while transferrin was significantly higher in MA and A groups compared to controls (p <0.001). Ferritin and C-reactive protein (CRP) were significantly higher in MA group (p <0.05 ferritin, p <0.01 for CRP). Mean sTfR was similar in both MA and A groups (p >0.05) and significantly higher than controls (p <0.001). Following iron treatment, sTfR decreased inboth MA and A groups (p <0.001) to similar values as controls. sTfR was negatively correlated to Hb throughout the study (for MA group, r= -0.350, p <0.05; for A group, r= -0.683, p <0.01).
Conclusions. As sTfR values in both MA and A groups decreased following iron treatment, we believe that this parameter was not influenced by MAM or inflammation; and it alone can be used to detect IDA and monitor treatment response in infants with MAM.
Keywords: Transferrin receptor; Iron deficiency anemia; Malnutrition; infants.
INTRODUCTION
Protein-energy malnutrition is manifested primarily by inadequate intakes of protein and calories.1 Being still a major health problem in developing countries, it is associated with 50%-60% of under-five mortality in these environments.2 In addition to stunting, wasting and underweight, micronutrient deficiencies, particularly deficiencies of vitamins and minerals are also important components of protein-energy malnutrition.1,3,4 Iron deficiency is the most common nutritional deficiency in all over the world; and besides anemia of inflammation, IDA can be observed in children with malnutrition.4-6
Currently, the classical tests used for diagnosing IDA are no sufficient.7 When used alone, none of them has enough sensitivity or specificity to diagnose IDA. Mean corpuscular volume (MCV) has low sensitivity and/whereas TS and total iron binding capacity (TIBC) low specificity.8 Moreover, they can also be influenced by certain conditions that make them inappropriate to be used in IDA diagnosis. Fe, TIBC, ferritin and transferrin are acute phase reactants that can be elevated depending on the presence of co-existing infectious or inflammatory processes.8-12
Increased number of studies investigated the utility of sTfR in differentiating anemia in children.13-16 sTfR is a truncated extracellular form of the transmembrane transferrin receptor (a glycoprotein primarily expressed in cells requiring iron) produced by proteolysis.17 The number of tissue receptors, mostly on erythroid cells, determines the
number of sTfR.18 Plasma sTfR concentration reflects the receptor density on cells and the number of cells expressing the receptor; and is closely related to cellular iron demands and erythroid proliferation rate.17 sTfR level increases parallel to the decrease in cellular iron levels,15 is not affected from inflammation, and suitable for monitoring erythropoietic response to treatment of IDA with iron.18-21
Up to date, no studies focused on the use of sTfR in the differential diagnosis of IDA in children with malnutrition. Our aim was to evaluate the efficacy of sTfR in detecting IDA and to assess the response to iron treatment in infants with MAM; and determine whether it has any superiority to classical markers of IDA in these patients.
POPULATION AND METHODS
Seventy three infants with anemia aged between 6-24 months who were followed in the Osmangazi University Department of Pediatrics in a one-year period were enrolled in this prospective study. Thirty infants at the same age interval (20 boys, 10 girls) without anemia and malnutrition were selected as the control group (group C). Hb level below the threshold value for anemia for the given age was considered as anemia.22 Only the patients with hypochromic/ microcytic anemia on at least two peripheral smear examinations evaluated by different operators were recruited. CBC, Fe, transferrin, TS, ferritin and sTfR levels were measured for making a proper IDA diagnosis and excluding other causes of hypochromic/microcytic anemia. MCV <70 fL, TS <15%, Fe <36 pg/dL and ferritin <10-12 ng/mL are considered as cut-off values for IDA diagnosis.6,22 Vitamin B12, folic acid and reticulocyte levels were also measured.
Anthropometric measurements (weight, height, head and mid-arm circumference) of the study groups were recorded. The patient group was further divided according to the presence of malnutrition. Infants with weight/height z score <-2 to -3 were considered to have MAM.1,23 There were 41 patients (18 boys, 23 girls) with anemia in MAM group (group MA) and 32 patients (27 boys, 5 girls) with anemia without MAM group (Group A).
Patients with the following conditions were excluded: dehydration or difficulties in feeding by oral route, history of acute hemorrhage or blood transfusions or intake of iron or erythropoiesis-stimulating agent within the last three months, severe malnutrition (weight/height z score <-3), well-defined malabsorption syndrome, other hypochromic/microcytic anemias (a-y-P thalassemias, sideroblastic anemia, anemia due to long-term inflammatory conditions), megaloblastic anemia due to vitamin B12 and folic acid deficiencies. The aim of the study was clearly explained to the parents before written consent was obtained. The study was approved by the local ethical committee of the hospital.
Risk factors for the development of IDA owing to prenatal period (presence of maternal anemia or bleeding, intake of iron preparations), natal period (gestational age and weight) and postnatal period (history of breastfeeding, contents of nutrition in the weaning period and prior use of iron supplements) were noted.
MA and A groups were treated with oral 6 mg/kg elementary iron (ferrous sulfate) preparations. Additionally, MA group was also supported with adequate energy and protein preparations, multivitamin, magnesium, zinc and folic acid supplementations. The patients had monthly check-ups for a three-month period. As 7 patients in the MA and 6 patients in the A group discontinued the controls, at the end of the followup period anthropometric measurements and blood tests were repeated in 34 and 26 patients in MA and A groups, respectively.
Blood sampling and laboratory analyses
Peripheral blood samples were obtained by aseptic technique using standard venipuncture. CBC testing was performed with Coulter Gen-S autoanalyzer using Beckman-Coulter kits. Vitamin B12, folic acid, Fe and ferritin were examined by Hitachi Roche autoanalyzer. Transferrin was analyzed in the IMAGE (Beckman-Coulter) autoanalyzer. TS (%) was calculated as follows: Fe/TIBC x 100; where TIBC is calculated as: 25.1 x transferrin. Sera of blood samples obtained for sTfR analysis were frozen and stored in 2 ml Eppendorf tubes at -20°C till the time of assay. sTfR was studied with sandwich enzyme immunoassay method in Diagnostic Grifols SA (Valles, Spain) ELISA autoanalyzer using human sTfR ELISA kits (BioVendor Laboratory Medicine Inc).
Statistical analysis
Continuous variables were presented as mean ± SD. The normality of the variables was tested with Kolmogorov-Smirnov test. For statistical analysis, independent samples t-test and
Mann-Whitney U test were used to compare two groups. Paired sample t test and Wilcoxon Sign Rank test were used in order to compare related samples. Categorical variables were summarized as counts (percentages) and compared using chi-square or Fisher exact test. Pearson's correlation analysis was used to determine the correlation between parameters. Data analyses were performed with the SPSS statistical software package, version 15.0 (SPSS Inc. Chicago, IL). Statistical significance was set at p <0.05.
RESULTS
Anthropometric measurements
As expected, at the beginning of the study, mean weight, weight/height z score, head and mid-arm circumference of MA group were significantly lower than A and C groups (p <0.001). After the three month follow-up period, although there was a significant rise in all anthropometric indices of MA group (p <0.05 for weight/height z score), the values were still significantly lower than A and C groups (data not shown). At this period, 14.7% of the patients in the MA group (n= 5) still remained to have MAM. On the other hand, the weight/height z scores of both A and C groups remained as similar at the end of the follow-up (data not shown) (Table 1). Despite the small number of patients remained to have MAM at the end of the follow-up period, the significant rise in the weight/height z scores of the MA group is mainly attributed to successful management of malnutrition rather than regular growth.
Table 1. Anthropometric measurements at the beginning and end of the study

Prenatal, natal and postnatal risk factors for IDA development
There were 8 and 2 infants with history of prematurity in the patients (5 cases in MA and 3 in A groups) and controls, respectively. Besides, 14 and 3 infants had low birth weight in the patients (LBW) (10 cases in MA and 4 in A groups) and controls, respectively (Table 2). Despite having lower values, preterm and LBW infants in the entire study population were not separately evaluated, as their anthropometric measurements did not statistically differ with the term and normal birth weight ones (data not shown).
Table 2. Risk factors for the development of IDA

Maternal anemia in the prenatal period were significantly higher in the patient group than the controls (p <0.001). Although the percentage of breastfeeding in the first 6 months of life was very high in the present study, early weaning was also common. Nutrients used for weaning were different. Transitional food that are not fortified with iron (especially food prepared with rice flour) and non-formula cow's milk were much more used in the patient group, whereas nutrition including meat products after the 6th month of life was significantly higher in the controls (p<0.05, Table 2).
At the time of admission, accompanying infections (respiratory tract infections, acute gastroenteritis, urinary tract infections, etc.) were present in 78.0%, 71.8% and 50.0% of MA, A, and C groups, respectively. There was underlying congenital heart disease in 24.4% (n=10) of the MA group. No accompanying chronic diseases were present in A or C groups.
Hematologic analysis of the study group
At the beginning of the study, Hb, hematocrit (Hct), MCV, mean corpuscular Hb (MCH), Fe and TS were significantly lower in MA and A groups than controls (p <0.001). Meanwhile, transferrin and red cell distribution width (RDW) were significantly higher in MA and A groups than controls (p <0.001). Despite being similar in Group A and controls, ferritin was significantly higher in the MA group than group A and controls (p <0.05) (data not shown). At this period, mean sTfR was similar both in MA and A groups (p >0.05) (data not shown) and significantly higher than controls (p <0.001). Hematological values and iron parameters are given in Tables 3-4.
Table 3. Hematological values at the beginning and end of the study

Table 4. Iron parameters at the beginning and end of the study
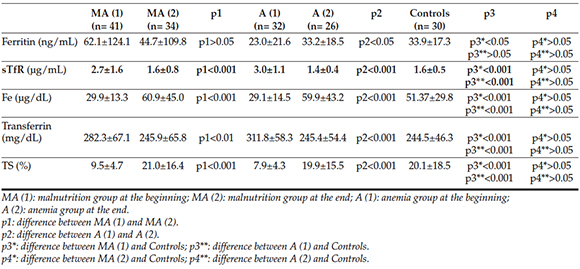
Other laboratory tests including hepatic and renal function tests, blood electrolytes, serum protein, albumin, vitamin B12 and folic acid levels and reticulocyte counts were similar (p >0.05) and normal in all groups. Meanwhile, C-reactive protein (CRP) was increased in MA (1.8±3.1 mg/ dL) and A (0.8 ± 1.3 mg/dl) groups and normal in controls (0.5 ± 1.7) (normal range: 0-0.5 mg/ dL). Moreover, it was significantly higher in MA group than the other groups (p <0.01).
At the end of three-month malnutrition and IDA treatment, Hb, Hct and TS significantly increased and sTfR significantly decreased in both MA and A groups (p <0.001). Except persistently high RDW, all hematologic parameters of MA and A groups were similar to controls at this time. Meanwhile, ferritin decreased in MA group (p >0.05) and increased in A group (p <0.05) at the end of follow-up period (Tables 3-4).
Although not showing a strong correlation, it was observed that sTfR negatively correlated with Hb in MA and A groups (for MA group, r= -0.350, p <0.05; and for A group, r= -0.683, p <0.01).
DISCUSSION
As yet, there is no single laboratory test to recognize iron deficiency.13 Currently, besides low Hb, MCV and MCH; decreased TS and ferritin were accepted as important useful diagnostic tools for IDA.24 However, classical tests used to detect iron deficiency remain insufficient and except ferritin have low diagnostic reliability. Concerning their overall cost, there are also reports favoring against their use.8
To our knowledge, studies assessing the validity of classical iron parameters for IDA diagnosis in children with malnutrition are lacking. Moreover, some parameters like transferrin or ferritin may be altered by coexisting hypoproteinemia or inflammation in children with protein-energy malnutrition.11,25 Therefore, use of more reliable and easy-to-perform markers would be a better strategy for detecting IDA in patients with malnutrition.
In the present study, traditional parameters used as markers of IDA including Hb, Hct, serum Fe and TS were significantly lower in MA and A groups than controls at the beginning of the study. However, all can also decrease in anemia of inflammation. At this period, CRP levels elevated in both groups. On the other hand, after three-month iron supplementation, all iron parameters reached similar values as controls. With these findings, it is concluded that combined anemia (IDA + anemia of inflammation) was present in MA and A groups at the beginning of the study.
The patient group consisted of infants with hypochromic/microcytic anemia. Although anemia of inflammation is most commonly normochromic/normocytic, it is well-known that hypochromic/microcytic anemia can also develop in long-term inflammatory conditions.26 In the present study, no patients with chronic inflammatory conditions were recruited (such as renal, rheumatologic or gastrointestinal diseases). Ten patients in the MA group had underlying acyanotic congenital heart disease, but all were under good control and none had congestive heart failure necessitating medications. Therefore, we believe that patients with hypochromic/ microcytic anemia due to long-term inflammatory conditions were not included in our study.
Although not routinely being used in the diagnosis of IDA due to high costs, increased transferrin level is a common finding in IDA. Meanwhile, it can be lowered in patients with malnutrition due to hypoproteinemia.10,25 In our study, despite being within normal limits, transferrin was significantly higher in the MA group than controls (p <0.001). MA group didn't have hypoproteinemia (total protein level: 6.6 ± 0.73 g/dL) and transferrin levels were able to identify IDA.
Decreased ferritin level is the initial finding of IDA. However, it can be as high as 30-50 ng/ mL in IDA associated with infectious diseases or inflammatory conditions.27 In the present study, ferritin was significantly higher in the MA group than both A and C groups. As CRP was also higher in the MA group than the other groups, increased ferritin in the MA group was interpreted as the result of co-existing infections. Therefore, ferritin was not helpful for IDA diagnosis in the MA group. Moreover, despite iron supplementation, ferritin level decreased in the MA group at the end of the follow-up. We attribute this finding mainly to the improvement in their clinical condition rather than the ineffectiveness of iron treatment.
Soluble transferrin receptor is useful for evaluating tissue iron deficiency as well as the conditions with stimulated erythropoiesis such as hemolytic anemia, hereditary spherocytosis, sickle cell anemia, megaloblastic anemia or ineffective erythropoiesis.15,19,28-32 At the onset of the study, all patients had hypochromic/ microcytic anemia and normal folic acid, vitamin B12 and reticulocyte levels. sTfR was quite similar in MA and A groups, while significantly higher than controls. Moreover, it was negatively correlated to Hb values. Therefore, we believe that sTfR alone is effective in demonstrating IDA in the patient group.
In an adult study, it was shown that malnutrition had no effect on the sTfR level regardless of the iron status.33 In our study, the patient group (MA and A groups) had very close sTfR values regardless of the presence of malnutrition. However, as a group of patients with MAM and accompanying hypoproteinemia was not enrolled, we may only conclude that sTfR was unaffected in infants with malnutrition and normal protein levels.
Previous reports indicated that sTfR decreases in response to iron treatment, and therefore, can be used for monitoring the erythropoietic response to iron supplementation.19,34 Likewise, at the end of three-month iron therapy, sTfR decreased in both MA and A groups, and reached similar values as controls. Therefore, we believe that it is also useful in demonstrating the effectiveness of iron treatment regardless of unresolved malnutrition in some infants.
Serum transferrin receptor was reported to be not influenced by the co-existing acute infections, inflammations or chronic diseases.19 In the present study, although CRP was significantly higher in the MA group than the other groups, sTfR was similarly increased as A group. This finding further supports the knowledge that sTfR was not affected by the presence of acute inflammatory conditions.
Children with IDA can have elevated RDW even 4 weeks following the start of iron supplementation.35 In our study, all hematological indexes of the MA and A groups became similar to controls at the end of three-month iron treatment, except the persistently higher RDW value. As we can't definitely explain the reason of elevated RDW values at the end of the followup, we believe that probably longer time than previously reported is needed for normalization of RDW.
Our study has some limitations. A pure IDA group (with frankly decreased ferritin levels and without inflammation) and patients with MAM and hypoproteinemia were not included. Besides, due to the limited age range of the study groups, the results can't be extrapolated to the entire pediatric population. We believe that studies including all these patient groups would reveal better results.
CONCLUSION
In the present study, sTfR level is not influenced by the presence of malnutrition and accompanying inflammation. Besides, with the correction of IDA, sTfR level decreased to similar levels as controls. As a result, we believe that sTfR can be used as a reliable marker of IDA in infants with MAM. Instead of using classical parameters of IDA, we suggest that sTfR alone can be measured in order to diagnose IDA and evaluate the effectiveness of iron treatment in children with MAM. Further studies with increased sample sizes should be performed in order to confirm our results.
1. Alderman H, Shekar M. Nutrition, food security and health security. En: Kliegman RM, Stanton BF, ST. Geme JW, Schor NF, Behrman RE, eds. Nelson Textbook of Pediatrics. 19th ed. Philadelphia: Elsevier Saunders; 2011.Págs.170-9. [ Links ]
2. Ubesie A, Ibeziakor N. High burden of protein-energy malnutrition in Nigeria: beyond the health care setting. Ann Med Health Sci Res 2012;2(1):66-9. [ Links ]
3. Bhutta ZA. Micronutrient needs of malnourished children. Curr Opin Clin Nutr Metab Care 2008;11(3):309-14. [ Links ]
4. Grover Z, Ee LC. Protein energy malnutrition. Pediatr Clin North Am 2009;56(5):1055-68. [ Links ]
5. Fondu P, Hariga-Muller C, Mozes N, Neve J, et al. Protein-energy malnutrition and anemia in Kivu. Am J Clin Nutr 1978;31(1):46-56. [ Links ]
6. Özkale M, Sipahi T. Hematologic and bone marrow changes in children with protein-energy malnutrition. Pediatr Hematol Oncol 2014;31(4):349-58. [ Links ]
7. Lopez A, Cacoub P, Macdougall IC, Peyrin-Biroulet L. Iron deficiency anaemia. Lancet 2016;387(10021):907-16. [ Links ]
8. Burns ER, Goldberg SN, Lawrence C, Wenz B. Clinical utility of serum tests for iron deficiency in hospitalized patients. Am J Clin Pathol 1990;93(2):240-5. [ Links ]
9. Özdemir N. Iron deficiency anemia from diagnosis to treatment in children. Turk Pediatri Ars 2015;50(1):11-9. [ Links ]
10. Sazawal S, Dhingra U, Dhingra P, Dutta A, et al. Efficiency of red cell distribution width in identification of children aged 1-3 years with iron deficiency anemia against traditional hematological markers. BMC Pediatr 2014;14:8. [ Links ]
11. Radcliffe LE, Thomas W, Glen J, Padhi S, et al. Diagnosis and Management of Iron Deficiency in CKD: A Summary of the NICE Guideline Recommendations and Their Rationale. Am J Kidney Dis 2016;67(4):548-58. [ Links ]
12. Thurnham DI, McCabe LD, Haldar S, Wieringa FT, et al. Adjusting plasma ferritin concentrations to remove the effects of subclinical inflammation in the assessment of iron deficiency: a meta-analysis. Am J Clin Nutr 2010;92(3):546-55. [ Links ]
13. Kamer B, Dóka E, Pasowska R, wi tkowska E. The usefulness of soluble transferrin receptor (sTfR) in differentiating anemia occurring in young children. Folia Histochem Cytobiol 2012;50(3):473-9. [ Links ]
14. Ho CH. The diagnostic role of serum transferrin receptor in patients with various anemia. Zhonhua Yi Xue Za Zhi (Taipei) 2002;65(2):55-60. [ Links ]
15. Yoon SH, Kim DS, Yu ST, Shin SR, et al. The usefulness of soluble transferrin receptor in the diagnosis and treatment of iron deficiency anemia in children. Korean J Pediatr 2015;58(1):15-9. [ Links ]
16. Dimitriou H, Stiakaki E, Markaki EA, Bolonaki I, et al. Soluble Transferrin receptor levels and soluble transferrin receptor/ log ferritin index in the evaluation of erythropoietic status in childhood infections and malignancy. Acta Paediatr 2000;89(10):1169-73. [ Links ]
17. Braga F, Infusino I, Dolci A, Panteghini M. Soluble transferrin receptor in complicated anemia. Clin Chim Acta 2014;431:143-7. [ Links ]
18. Harms K, Kaiser T. Beyond soluble transferrin receptor: old challenges and new horizons. Best Pract Res Clin Endocrinol Metab 2015;29(5):799-810. [ Links ]
19. Beguin Y. Soluble transferrin receptor for the evaluation of erythropoiesis and iron status. Clin Chim Acta 2003;329(1-2):9-22. [ Links ]
20. Ferguson BJ, Skikne BS, Simpson KM, Baynes RD, et al. Serum transferrin receptor distinguishes the anemia of chronic disease from iron deficiency anemia. J Lab Clin Med 1992;119(4):385-90. [ Links ]
21. Bhaskaram P, Madhavan Nair K, Balakrishna N, Ravinder P, et al. Serum transferrin receptor in children with respiratory infections. Eur J Clin Nutr 2003;57(1):75-80. [ Links ]
22. Comité Nacional de Hematología. Anemia ferropénica. Guia de diagnóstico y tratamiento. Arch Argent Pediatr 2009;107(4):353-61. [ Links ]
23. World Health Organization. Management of severe malnutrition: a manual for physicians and other senior health workers, WHO, Geneva 1999. [Acceso: 19 de noviembre de 2009]. Disponible en: http://apps.who.int/iris/bitstream/10665/41999/1/a57361.pdf
24. Subramaniam G, Girish M. Iron deficiency anemia in children. Indian J Pediatr 2015;82(6):558-64. [ Links ]
25. Withold W, Neumayer C, Beyrau R, Heins M, et al. Efficacy of transferrin determination in human sera in the diagnosis of iron deficiency. Eur J Clin Chem Clin Biochem 1994; 32(1): 19-25. [ Links ]
26. Ganz T, Nemeth E. Iron sequestration and anemia of inflammation. Semin Hematol 2009;46(4):387-93. [ Links ]
27. Baillie FJ, Morrison AE, Fergus I. Soluble transferrin receptor: a discriminating assay for iron deficiency. Clin Lab Haematol 2003;25(6):353-7. [ Links ]
28. Flowers CH, Skikne BS, Covell AM, Cook JD. The clinical measurement of serum transferrin receptor. J Lan Clin Med 1989;114(4):368-77. [ Links ]
29. Choi JW, Pai SH. Associations between serum transferrin receptor concentrations and erythropoietic activities according to body iron status. Am Clin Lab Sci 2003;33(3): 279-84. [ Links ]
30. Skikne BS, Flowers CH, Cook JD. Serum transferrin receptor: a quantitative measure of tissue iron deficiency. Blood 1990;75(9):1870-6. [ Links ]
31. Ahluwalia N. Diagnostic utility of serum transferrin receptors measurement in assessing iron status. Nutr Rev 1998;56(5 Pt 1):133-41. [ Links ]
32. Olivares M, Walter T, Cook JD, Hertrampf E, et al. Usefulness of serum transferrin receptor and serum ferritin in diagnosis of iron deficiency in infancy. Am J Clin Nutr 2000;72(5): 1191-5. [ Links ]
33. Kuvibidila S, Warrier RP, Ode D, Yu L. Serum transferrin receptor concentrations in women with malnutrition. Am J Clin Nutr 1996;63(4):596-601. [ Links ]
34. Kohgo Y, Niitsu Y, Kondo H, Kato J. Serum transferrin receptor as a new index of erythropoiesis. Blood 1987;70(6):1955-8. [ Links ]
35. Aslan D, Gümrük F, Gürgey A, Altay C. Importance of RDW value in differential diagnosis of hypochrome anemias. Am J Hematol 2002;69(1):31-3. [ Links ]

