


Services on Demand
Journal

Article
 text in
  Article in xml format
 Article references
 Send this article by e-mail
Indicators
-
 Cited by SciELO
Related links
-
 Similars in
SciELO
Similars in
SciELO
Share

 Permalink
Archivos argentinos de pediatría
Print version ISSN 0325-0075On-line version ISSN 1668-3501
Arch. argent. pediatr. vol.116 no.2 Buenos Aires Apr. 2018
http://dx.doi.org/10.5546/aap.2018.e227
ORIGINAL ARTICLE
http://dx.doi.org/10.5546/aap.2018.eng.e227
The impact of obesity on specific airway resistance and conductance among schoolchildren
Andrea Parraguez Arévalo, B.S.a, Francisco Rojas Navarro, B.S.a, Macarena Ruz Céspedes, B.S.a, Paul Medina González, MScb, Máximo Escobar Cabello, MScb and Rodrigo Muñoz Cofré, MScc
a. School of Kinesiology, Universidad de Concepción, Concepción.
b. Department of Kinesiology, School of Health Sciences, Universidad Católica del Maule.
c. Doctoral Program in Morphological Sciences, Universidad de la Frontera Chile.
E-mail address: Rodrigo Muñoz Cofré, MSc.: rodrigomunozcofre@ gmail.com
Funding: None
Conflict of interest: None.
Received: 6-24-2017
Accepted: 9-13-2017
ABSTRACT
Introduction. Child and adolescent obesity is an epidemiological problem in developing countries. Its prevalence among preschoolers and schoolchildren is over 30%. It has been associated with a wide range of health complications, including rapid loss of lung function leading to changes in physiology and ventilatory mechanics. The objective of this study was to analyze the association between obesity and the increase in specific airway resistance (sRaw) in a sample of obese children and adolescents from the district of Talca.
Material and method. In a sample of 36 subjects with an average age of 9.38 ± 1.99 years, divided into 2 groups (normal weight and obese), the tricipital, subscapular, and abdominal skinfolds and lung volumes were measured. For the statistical analysis, data normality was determined and then the Student's t test or the Mann-Whitney U test and Pearson's or Spearman's correlations were used, as applicable. A value of p < 0.05 was considered statistically significant.
Results. When comparing normal weight and obese subjects, a significant increase in sRaw and a significant reduction in specific airway conductance (sGaw) were observed in obese subjects. In addition, an adequate and significant correlation was observed between sRaw and fat percentage.
Conclusions. Obese subjects showed an increased sRaw and a reduced sGaw.
Key words: Obesity; Airway resistance.
INTRODUCTION
At present, the increasing use of technology has reduced the level of physical activity people do,1 which impacts on their lifestyles. One of the most critical consequences of this is the emergence of obesity, whose extent or prevalence affects individuals at a very early age.2
In this context, the World Health Organization (WHO) has defined "obesity" as "an abnormal or excessive fat accumulation that presents a risk to health." To this date, the prevalence of obesity is on the rise, and obese children are at a high risk given that a percentage of them will continue to be obese during adulthood.3 This is no minor matter considering that, in 2010, approximately 40 million children younger than 5 years were overweight.4 Chile is no exception and has been following an upward curve since 2009. However, the effects of obesity on lung function have not been completely sized up yet.
The fat mass typical of obesity is the most variable component of body composition throughout the life cycle, both at the individual level and in subject groups. Thus, the risks associated with excess fat are mostly related to its location.4 This way, it has been proposed that the metabolic consequences of regional fat distribution have a specific clinical relevance due to the systemic dysfunctions it may cause.5 This situation is favored by intrinsic factors, such as ethnicity, genotype, diet, physical activity, sex, and age.6
Obesity directly alters the chest and lung properties by means of fat accumulation in the mediastinum, abdomen, and the chest cavity.7 The mechanical and inflammatory effects of obesity lead to changes in the physiology of ventilation.8,9 The diaphragm rises and causes an increase in pleural pressure and a reduction in the functional residual capacity. At the same time, adipose tissue produces proinflammatory cytokines and hormones that directly affect the airways and reduce their caliber.10 In this regard, the peripheral extent of airway involvement in healthy schoolchildren has been less studied.
In addition, the regional distribution of fat plays an important role in obese subjects' predisposition to respiratory complications.11,12 In this context, an inverse correlation has been observed between the forced vital capacity (FVC) and body mass index (BMI) of obese children.10 Additionally, Shenoy et al. found a direct correlation between abdominal fat distribution and forced expiratory volume in 1 second (FEV1). On the contrary, a direct and inverse relationship between BMI and airway resistance as measured by impulse oscillometry has been demonstrated in normal weight children.14 However, these are spirometric studies and do not measure specific airway resistance (sRaw) or specific airway conductance (sGaw).
Considering the background described here, the objective of this study was to analyze the association between obesity and an increased airway resistance in a sample of obese children and adolescents from the district of Talca.
MATERIAL AND METHOD
This was an observational, cross-sectional study carried out between March and May 2017. The sample size was estimated using the Ene 3.0® software for sample size estimation. Considering a 0.95 significance level, an 80% statistical power, 2 groups, a 10% dropout, and the mean and standard deviation obtained from a pilot study, the sample was established at 36 subjects. Using a non-probability sampling, 36 subjects were selected, all from the district of Talca; they were then divided as per their BMI (WHO percentiles) into 2 groups: normal weight (18) and obese (18). Inclusion criteria were children from the district of Talca aged 6-12 years and who had a normal weight (BMI-for-age within the standard deviation established by the median value according to the WHO Child Growth Standards) or obesity (BMI-for-age with more than 1 standard deviation above the median value established as per the WHO Child Growth Standards).15 Exclusion criteria were physical and/or cognitive status incompatibility to complete the lung function test, acute or chronic respiratory diseases at the time of assessment, girls who had experienced the menarche, children with nausea and vomiting on the day of the test.10,16 This study was approved by the Scientific Ethics Committee of Universidad Católica del Maule (Resolution 23/2016). Lastly, the parents of schoolchildren had to sign an informed consent and, before each test, the schoolchildren were asked to give their assent.
Height: The d istance from the floor to the vertex was measured using a SECA 220 anthropometer. The subject was standing, with the heels together and toes pointing out to a 45-degree angle. Height was measured during a maximum inspiration and with the head adjusted to the Frankfurt plane.17
Weight: Weight was measured in kilograms using a SECA® 840 scale. Important note: The subject was not allowed to see the registry.17
Skinfolds: The adipose tissue was measured in millimeters using a Lange Skinfold Caliper® (Beta Technology, Santa Cruz, California). The measurement of skinfolds included the tricipital skinfold, which is vertical and halfway between the acromion and olecranon processes of the posterior side of the upper arm; the subscapular skinfold, which is 2 cm below the inferior angle of the scapula, running obliquely downwards and outwards and forming a 45-degree angle to the horizontal plane; and the abdominal skinfold, which is 5 cm to the right of the umbilicus, measured longitudinally to the midline.17
Fat percentage: It was measured using the Slaughter equation for prepubertal children.17,18
Girls: 1.33 x (tricipital + subscapular skinfold) - 0.013 x (tricipital + subscapular skinfold)2 - 2.5.
Boys: 1.21 x (tricipital + subscapular skinfold) - 0.008 x (tricipital + subscapular skinfold)2 - 1.7.
Lung volumes: The tests were done using a body plethysmograph (Medgraphics, PlatinumElite DL® model). Briefly, the pneumotachograph was adjusted to the level of the mouth. The subject put on a nose clip and put his/her hands over the face to prevent the movement of face muscles during the test. Then, the booth was closed and the subject was asked to breath 4 times at tidal volume. The subject was asked to "pant softly" trying to move volumes between 50 and 60 mL at a frequency close to 60 per minute (1 Hz). Then, the shutter was activated for 2-3 seconds and, after this, the subject was asked to perform a maximum inspiration and a maximum expiration until reaching the residual volume.16
Data were tabulated and analyzed using Microsoft Office Excel 2010 and GraphPad Prism 5®, respectively. Results were expressed as average ± 1 standard deviation. For the statistical analysis of the sRaw and sGaw outcome measures, data normality was determined using the Shapiro-Wilk test; then, the Student's t test or the Mann-Whitney U test was performed, depending on sample distribution. Correlations were established using Pearson's or Spearman's coefficient, depending on data normality. Lastly, a value of p < 0.05 was considered significant.
RESULTS
A total of 36 children were assessed; no significant differences were observed in terms of age and height (Table 1). The statistical analysis also showed statistically significant differences in the weight and BMI outcome measures (Table 1). The abdominal and tricipital skinfolds were significantly larger in obese children compared to normal weight ones (Table 1). The sRaw outcome measure was significantly higher in the obese group compared to the normal weight group, p= 0.0001. sGaw was significantly reduced in obese children compared to normal weight ones, p= 0.0004 (Figure 1).
Table 1. Description of anthropometric outcome measures and ventilatory function of the studied child and adolescent population from the district of Talca


Figure 1. Comparison of specific airway resistance and conductance as per the body mass index of the studied child and adolescent population from the district of Talca
In addition, an adequate and significant correlation was observed between sRaw and fat percentage (Figure 2). No statistically significant correlations were observed between sRaw and the subscapular and abdominal skinfolds (Figures 3 and 4). Lastly, no statistically significant correlations were observed between sGaw, fat percentage, and the subscapular and abdominal skinfolds (Figure 5).

Figure 2. Relationship between fat percentage and specific
airway resistance in the obese child and adolescent
population from the district of Talca

Figure 3. Relationship between subscapular skinfold and
specific airway resistance in the obese child and adolescent
population from the district of Talca

Figure 4. Relationship between the abdominal skinfold and
specific airway resistance in the obese child and adolescent
population of the district of Talca
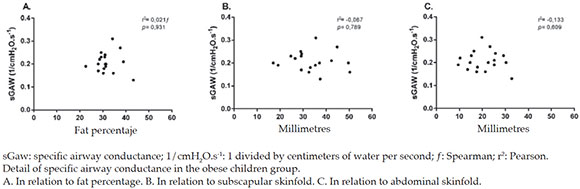
Figure 5. Influence of fat percentage and subscapular and abdominal skinfolds on specific airway conductance
DISCUSSION
The early detection of the systemic effects of obesity and body fat distribution is relevant for any developing subject, especially because it involves vital functions such as ventilation.
The outcomes of this study demonstrate an association between an increased sRaw and a reduced sGaw in the obese children of our sample. However, one of the hurdles of estimating obesity based on BMI is that it is not possible to differentiate between lean and fat body mass.19
In this regard, Pérez et al. have pointed out that, among the specific anthropometric instruments used to measure body fat, the hip circumference and skinfolds methods are easy to use and can be implemented fast during clinical examination and that, besides, they complement BMI results by establishing the presence of fat tissue and its location. Although the body fat percentage obtained using skinfolds shows a low level of agreement (according to Bland and Altman), different observers,20,21 including Urrejola et al., suggest using this method as long as there are no other, more reliable tools available.22 An aspect related to the consequences of obesity on ventilatory function -although poorly studied- is the increase in sRaw and the decrease in sGaw,23 because, in general, these are used as specific tests for airway diseases24 and are not necessarily related to the subject's body composition. Based on the gathered information, the assessment of lung function should at least be considered for obese subjects with no apparent respiratory disorders.
In detail, the sRaw of the studied groups behaved differently from prior studies. In this regard, Kalhoff et al. studied the association between oscillometric parameters and BMI in a group of 518 preschoolers (10% were overweight and 3% had a normal weight), and results did not show significant changes in airway resistance as BMI increased. The authors attributed such results to the sample homogeneity and also to the fact that studied subjects were healthy.14 Likewise, Lauhkonen et al. assessed the association between weight, lung function, and bronchial responsiveness and exercise in preschoolers using an impulse oscillometry. To this end, 99 children were measured (22% were obese) and assessed following a bronchiolitis episode (0-6 months) and reassessed at 6 years old. Obese children, compared to normal weight and overweight ones, did not show significant differences in terms of airway resistance and impedance, both at baseline and post-exercise. However, 7 obese children showed a greater airway impedance and a lower airway resistance following bronchodilator administration. Based on preliminary evidence, the authors demonstrated that current obesity (5-7 years old) in children hospitalized for bronchiolitis at the age of less than 6 months could be associated with bronchial obstruction, including irreversible obstruction following bronchodilator administration. In addition, no significant association was observed between current overweight or obesity and airway responsiveness during exercise and the bronchodilation test.25 The differences reported in the two studies mentioned above compared to our study are probably the result of the age of our study subjects, who were 6-12 years old -and were thus more cooperative-, the balance in the number of children in each group, and the tool used to make the measurements.
Considering that the American Thoracic Society (ATS) defines sGaw as the reciprocal outcome measure of sRaw, which reduces in a linear fashion when lung volume drops and sRaw increases, this concept is consistent with the outcomes of this study, which found a significant reduction in the sGaw of obese children.13 Therefore, the anthropometric classification as per the BMI -although not a very complicated tool- would deliver results that would help to speculate potential ventilatory system disorders in obese children and advise on the assessment of lung function.
In relation to body fat distribution, Rosales pointed out that there was controversial information regarding its behavior in children and adolescents. At the same time, fat deposit, either central (trunk) or peripheral (limbs), is not accurately known.26 In this regard, Godinez et al., in their review on abdominal fat and its relevance in obesity, concluded that children's fat mass distribution is central (chest and abdomen), which supports the tests used.27
In spite of using skinfolds to estimate body fat percentage as per the Slaughter equation, the correlation of the subscapular and abdominal skinfolds with sRaw and sGaw was also recorded. However, it did not yield significant results, most likely because skinfolds alone did not account for this phenomenon, unlike fat percentage, which was an indirect estimation of total body fat. This was consistent with the results obtained by Frainer et al., who observed a pattern of abdominal fat distribution in Brazilian children aged 7-10 years.28 In addition, McCarthy et al. used a bioelectrical impedance to measure children and adolescents aged 5-18 years; they obtained a similar fat percentage by sex and determined that fat mass was located in the abdomen until 10 years old.29 The available evidence suggests that there are no differences between sexes in the patterns of body fat distribution in the studied age range; therefore, it would not be necessary to divide the population by sex in this stage of the life cycle.
Lastly, it is important to note the significant correlation between body fat percentage and sRaw. This is consistent with the results obtained by Feng et al., who measured a sample of 1572 subjects aged 9-18 years and found inverse correlations between body fat distribution obtained using hip and chest circumference, FEV, and peak expiratory flow (PEF).11 Although our study measured sRaw instead of the outcome measures mentioned above, it is worth noting that all of them act as translators of an increased airway resistance, although sRaw is highly specific and sensitive to obstructive disorders compared to FEV1 and PEF. Such increase in sRaw is considered to be accounted for based on two hypotheses. The first hypothesis indicates that the smooth muscle becomes infiltrated by fat tissue, which causes an increase in the critical pressure of the airways, thus favoring their collapse and causing structural anomalies of the respiratory system.28 The second hypothesis is based on an increased chronic airway inflammation secondary to obesity. In this case, leptin (a satellite hormone) would promote a proinflammatory setting, which reduces the radius of the airways due to an increased cholinergic tone and persistent hyperresponsiveness.8 For this reason, it might be considered that such ongoing proinflammatory status resulting from total fat percentage, which is higher in obese children than in normal weight ones, might determine the correlation between sRaw and fat percentage, instead of the subscapular and abdominal skinfolds separately. This is supported by Peters et al., who have reported a direct relationship between leptin and airway hyperresponsiveness.8
LIMITATIONS
As of May, due to low temperatures, wood is used for heating resulting in a larger amount of particulate matter,2,5,30 which may cause airway inflammation. For future studies, it would be advisable to resolve this factor and thus better isolate the obesity factor. In addition, given the discrepancy in relation to body fat distribution in children, it would have been appropriate to use equations that involved more skinfolds. Lastly, the sample size was estimated according to the study's objective and not to test if the inflammatory substances of obesity trigger such reduction in sRaw.
CONCLUSION
There is a relationship between obesity and ventilatory function, and sRaw shows a significant increase while sGaw is significantly reduced. In addition, an adequate and significant relationship between sRaw and fat percentage is maintained in the obese child and adolescent population aged 6-12 years from the district of Talca.