


Services on Demand
Journal

Article
 text in
  Article in xml format
 Article references
 Send this article by e-mail
Indicators
-
 Cited by SciELO
Related links
-
 Similars in
SciELO
Similars in
SciELO
Share

 Permalink
Archivos argentinos de pediatría
Print version ISSN 0325-0075On-line version ISSN 1668-3501
Arch. argent. pediatr. vol.116 no.2 Buenos Aires Apr. 2018
http://dx.doi.org/10.5546/aap.2018.e241
ORIGINAL ARTICLE
http://dx.doi.org/10.5546/aap.2018.eng.e241
Weight, height and body mass index of children and adolescents living at moderate altitude in Colombia
Edilberto Díaz Bonilla, Mastera, Claudia L. Torres Galvis, Mastera, Rossana Gómez Campos, M.D.b-c, Miguel de Arruda, M.D.c, Jaime Pacheco Carrillo, M.D.d and Marco Cossio Bolaños, M.D.c,e,f
a. Universidad Pedagógica y Tecnológica de Colombia, Tunja (Boyacá), Colombia.
b. Universidad Autónoma de Chile, Talca, Chile.
c. School of Physical Education, Universidade Estadual de Campinas, Sao Paulo, Brazil.
d. Universidad del Bío-Bío, Chillán, Chile.
e. Department of Physical Activity Science, Universidad Católica del Maule, Talca, Chile.
f. Universidad Nacional de San Agustín, Arequipa, Peru.
E-mail address: Marco A. Cossio Bolaños, M.D.: mcossio1972@hotmail. com
Funding: None.
Conflict of interest: None.
Received: 5-4-2017
Accepted: 9-19-2017
ABSTRACT
Introduction. There is increasing concern over the study of physical growth in different regions of the world, although altitude is not considered an adjustment factor.
Objectives. Compare physical growth variables and body mass index (BMI) patterns with the Centers for Disease Control and Prevention (CDC) 2012 reference data and develop percentiles for children and adolescents.
Methodology. School children living at moderate altitude in Bogotá (Colombia) were studied. Their weight and height were evaluated and their BMI was calculated. Anthropometric variables were compared against reference data of the CDC-2012, Brazil, Peru and Argentina. Curves were constructed using the least mean square (LMS) method.
Results. A total of 2241 school children (1159 girls) aged 6.0 to 17.9 years were included. There were no significant differences in weight and BMI in 6 to 8 year-olds relative to CDC-2012 reference data; in 9 to 17 year-old children, however, this sample evidenced lower values in terms of weight and BMI as compared to those of the CDC-2012. As far as height is concerned, in both sexes, values were lower than those of the CDC-2012. Comparisons against the regional curves of Argentina, Peru and Brazil yielded relatively similar results, with the exception of girls' BMI, as 13 to 17 year-old girls exhibited lower values.
Conclusion. Growth variables of school children were lower relative to the CDC-2012 reference data. There were slight discrepancies in physical growth and BMI in relation to the curves of Argentina, Peru and Brazil. Curves were constructed to evaluate growth in school children living at moderate altitude in Colombia.
Key words: Growth and development; Child; Adolescent; Altitude.
INTRODUCTION
Physical growth (PG) and human development are characterized by their intrapopulation and interpopulation heterogeneity.1 This is the product of continued, complex interactions among genes as well as with different mesogenic conditions.2
As a matter of fact, studying physical growth among populations is relevant as, for a long time, it has been the primary goal in the fields of human biology and public health. It has even been suggested that weight and height are major classic indicators in assessing PG in children and adolescents.3
In this context, very few studies conducted in Colombia4 have prioritized the study of PG in different geographic regions, without considering altitude as an adjustment variable. As a matter of fact, altitude is an important variable that plays a major role in the study of PG, which has been widely surveyed in different research efforts.5,6 Some studies conducted at moderate altitude have evidenced the existence of significant differences in the PG patterns of children and adolescents.7
This information suggests the influence of population-specific environmental, cultural and genetic differences; hence, the weight, height and BMI of children and adolescents at moderate altitude in Bogotá (Colombia) are likely to differ from the US Centers for Disease Control and Prevention 2012 reference data (CDC-2012) and other South America regional standards.
Overall, regional surveys aimed to compare PG against international references use the CDC8,9 and the World Health Organization (WHO)10 reference data. In essence, these references are valuable clinical practice tools for individual assessment and follow-up of PG. In fact, there is additional concern in public health over childhood obesity,11 as in recent years it has increased in children and adolescents in South America due to the nutrition transition phenomenon.12
Hence, this study has the following aims:
a) to compare growth variables (weight and height) and BMI patterns against the CDC-2012 reference data and other international studies, and
b) to develop weight, height and BMI percentiles for school-age children and adolescents living at moderate altitude in Colombia.
METHODOLOGY
Type of study and sampling
We conducted a descriptive, cross-sectional survey of school children living at moderate altitude in Bogotá (Colombia). Ages ranged from 6.0 to 17.9 years. School children were recruited from a public education institution located at 2640 meters above sea level attended by children of mestizo (Spanish and indigenous) origin, from 12 Bogotá districts. We used non-probability sampling (quotas). School children came from middle class backgrounds and their diets were based on the daily intake of products such as cornmeal, potato, banana, cabbage and coffee.
Students who had physical disabilities or for whom informed consent had not been obtained were excluded. School children for whom informed consent and assent were obtained and measurements had been completed were included. Permission was given by the school Principal's Office for the conduct of the study, which was performed in accordance with the Declaration of Helsinki and Resolution 8430 of the Ministry of Health and Social Protection of Colombia. The study was further approved by the local Ethics Committee.
Procedures
The data collection procedure comprised three stages. Firstly, we explained the objectives and variables to be evaluated to the parents, who were asked to sign the parental informed consent form. Secondly, evaluation cards were sorted by age, sex, school level (primary or secondary), school hours and names of the persons performing the assessment. Thirdly, evaluations were conducted during school hours from 7:00 am to noon, Mondays through Fridays, over the month of October 2013.
Assessments were carried out at the school facilities by eight teachers (four men and four women) who had ample experience in anthropometric measurement taking and had received previous training from the International Society for the Advancement of Kinanthropometry (ISAK).13 The intra- and interobserver technical error of measurement (TEM) was between 0.82% and 1.5%.
Variables such as weight and height were measured with the students wearing light clothing (shorts and shirts) and no shoes, as required by the ISAK standardized protocol.13 Body weight (in kg) was measured using a digital scale (Tanita UK Ltd.) with a weight capacity of 0-150 kg and a precision of 100 g. Height was measured with a portable stadiometer (Seca GmbH & Co. KG, Hamburg, Germany), with a precision of 0.1 mm. The BMI was calculated by applying the formula BMI= weight (kg)/height2 (m). Age categories were organized in intervals of 6.0 to 6.9 years, 7.0 to 7.9 years, and so forth until 17.0 to 17.9 years.
Weight, height and BMI comparisons were made against international references: CDC-2012 reference data,9 the reference suggested by Alfaro et al.,1 for Jujuy (Argentina), and the proposed standards for Campinas (Brazil)14 and the central region of Peru.15 We opted for these references because they were the latest available ones and exhibited regional characteristics with similar human development indexes (HDI) in recent years.
Statistical analysis
Normal data distribution was verified using the Kolmogorov-Smirnov test. Then, the descriptive statistics of arithmetic mean, standard deviation (SD) and range were calculated. Differences between sexes were verified using the t test for independent samples. Differences between the CDC-2012 reference values and mean values and ± SD values for Bogotá (Colombia) were determined by the t test for related samples. The level of significance was set at 0.05.
Comparisons to international references (Argentina, Brazil and Peru) were graphically represented using the 50th percentile. Percentiles (p5, p10, p15, p50, p85, p90 y p95) for weight, height and BMI by age range and sex were developed using the LMS method,16 through which specific smoothed percentile curves can be obtained: L (lambda, asymmetry), M (mu, median), and S (sigma, coefficient of variation). We used the LMS Chart Maker version 2.3 software.17 Statistical calculations were performed using Excel spreadsheets and the SigmaStat and SPSS 16.0 softwares.
RESULTS
The variables characterizing the 2241 school children studied (1082 boys and 1159 girls) are shown in Table 1. There were no differences in the body weight of both sexes from 6 to 14 years of age. Boys aged 15 to 17 years, however, showed greater body weight than their counterparts (p < 0.05). As far as weight is concerned, there were no significant differences at early ages (6 to 8 years), while at intermediate ages, girls were taller until the age of 12 (p < 0.05). At advanced ages, boys showed greater height as compared to girls (p < 0.05). With regard to the BMI, there were no significant differences between both sexes for the ages of 6 to 12 years. Between the ages of 13 to 18 years, however, girls exhibited significantly higher values than boys (p < 0.05).
Table 1. Anthropometric characteristics of school children surveyed (n= 2241)
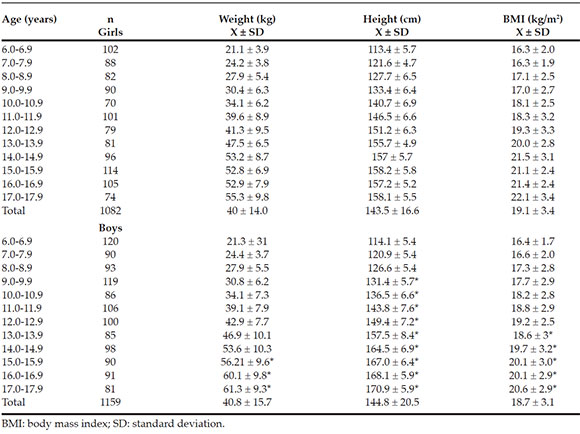
Figure 1 shows weight and height comparisons for Bogotá school children against the CDC-2012 references and the values obtained in other South American surveys. As for body weight, school children of both sexes living in Bogotá exhibited a similar growth pattern from the ages of 6 to 8 years. Then, between the ages of 9 to 17, values were significantly lower than the CDC-2012 reference values (p < 0.5). We further observed that for both sexes body weight values were relatively similar to those of international surveys.
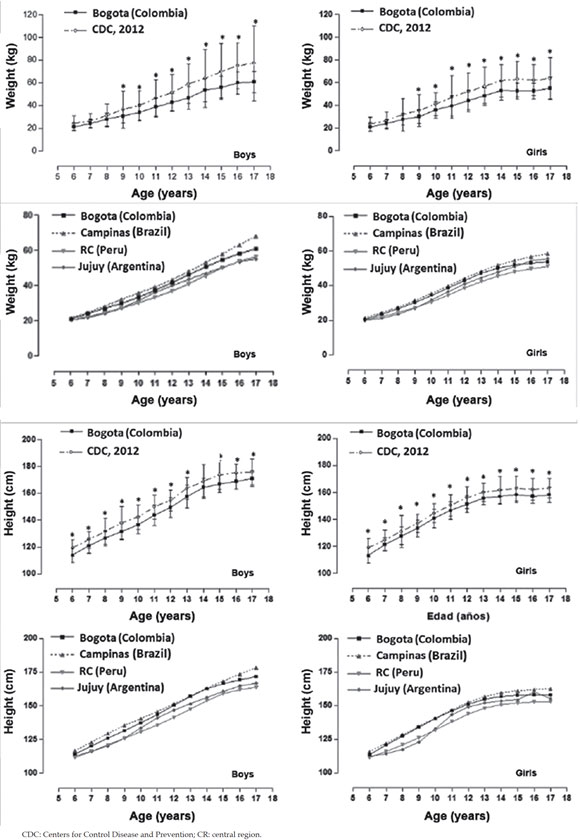
Figure 1. Comparison of mean values and + standard deviation of weight and height variables of children and adolescents living in Bogotá (Colombia) with the US Centers for Disease Control and Prevention 2012 reference and 50th percentile discrepancies among South American studies
With regard to height, both male and female school children living in Bogotá exhibited lower values at all ages as compared to those of the CDC-2012. As for comparisons with international surveys of South America, similar growth patterns were observed for both sexes, with slight discrepancies across all ages.
Figure 2 compares the BMI in Bogotá school children with international references. In both sexes, values increased with age. There were no significant differences relative to the CDC-2012 references in both sexes from ages 6 to 8. From ages 9 to 17, differences were significant (p < 0.05): Bogotá school children showed lower BMI values. With regard to comparisons with other international surveys, boys exhibited similar behavior at all ages. In girls, this pattern was similar at early stages; however, as from the age of 12 years, discrepancies were greater and lower BMI values were recorded.
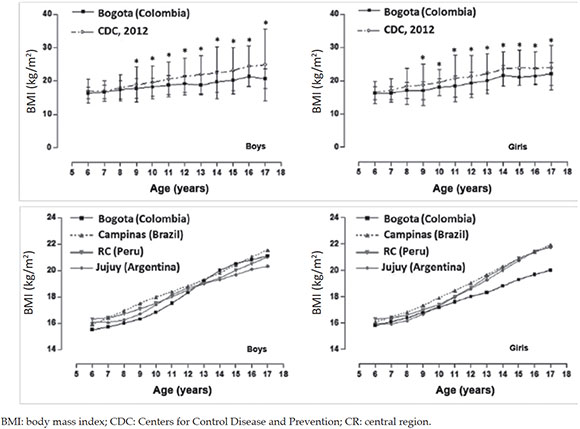
Figure 2. Comparison of mean values and + standard deviation of body mass index of children and adolescents in Bogotá (Colombia) with the US Centers for Control Disease and Prevention 2012 reference and discrepancies in the 50th percentile with South America surveys
Percentile distribution for weight, height and BMI by age and sex is shown in Table 2. In all cases, values increased with age. Proposed percentiles were p5, p10, p15, p50, p85, p90 and p95.
Table 2. Percentile values developed for weight, height and body mass index
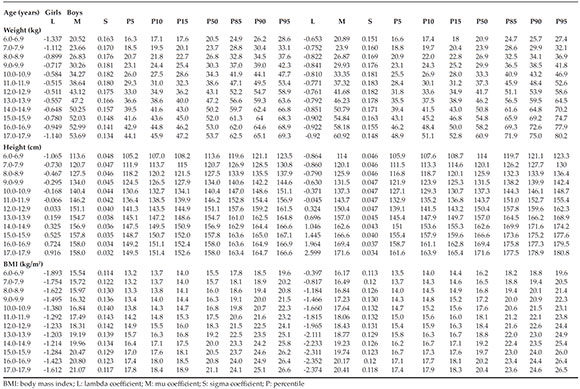
Figure 3 shows the graphical comparisons of percentiles (p5, p50 and p95) between the regional curves of Bogotá and those of the CDC-2012. Weight, height and BMI curves exhibited similar patterns to those of the CDC-2012: values increased progressively with chronological age. However, discrepancies were evident at all ages and in p5, p50 and p95.
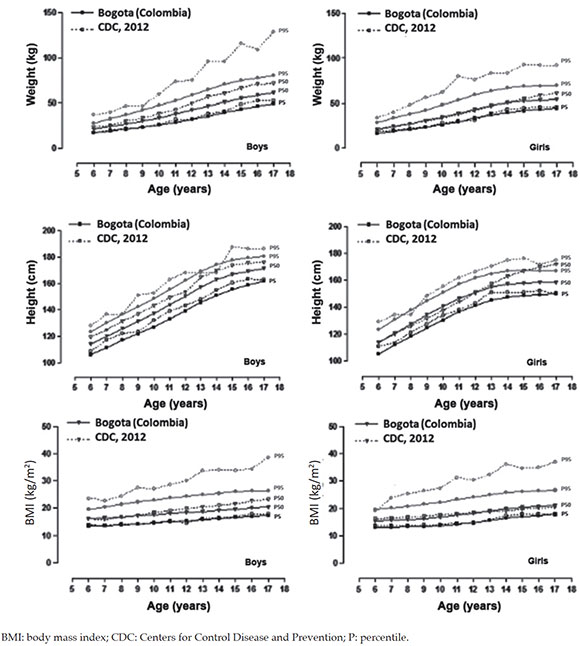
Figure 3. Distribution of reference percentiles for Bogotá (p5, p50 and p95) by age and sex
DISCUSSION
This study is the first to describe PG in children and adolescents living at moderate altitude in Colombia. Overall, the results analyzed evidenced that school children of both sexes living in Bogotá exhibited lower weight and height than the CDC-2012 reference data.
According to previous surveys, stunted growth in populations at moderate18 and high altitudes5 is strongly associated with extrinsic (environmental) factors. These results confirm the specific cultural, environmental and genetic differences that these populations are prone to exhibiting. In addition, when compared to other South American surveys,1,4,15 results evidenced relatively lower PG patterns.
These findings confirm the discrepancies existing in terms of weight and height among school children in different geographic regions of the world, and it is even possible to observe these differences within one same country in relation to social, cultural and environmental inequalities, as well as lifestyles and nutrient intake among regions.19
Hence, the results observed underscore the diversity and difficulty of physical growth in challenging environments.20 This highlights the importance of obtaining new descriptions of PG variables and BMI values among populations, particularly in school populations at moderate and high altitudes.
In fact, this information is useful to better understand human biological variation and public health3 of children and adolescents as, over the first years of life, monitoring PG by sequential measurement of weight, height and BMI is of the essence.21 This is common practice in Latin America, including Colombia, and other parts of the world.
With respect to BMI comparisons against the CDC-2012 reference, results showed that school children living at moderate altitude exhibited similar values at early ages while later on, from ages 9 to 17 years, they were significantly lower. This demonstrates that low weight and height certainly lead to plunging BMI values, as a result of factors inherent to specific ethnic groups that developing countries normally experience (economic, nutritional, cultural and environmental changes).
As a matter of fact, some previous studies have shown that BMI is not applicable to children and adolescents living at moderate altitude18,23 since, as an obesity index, it cannot be used in populations having marked height differences,24 particularly in populations presenting stunted PG.
In this sense, the accuracy of BMI to calculate the body fat percentage was the focus of several studies.25,26 This notwithstanding, the WHO27 suggests that the BMI be used for identifying and diagnosing overweight and obesity in children and adolescents. In its original design, children born at less than 1500 MASL were included in the sample.28 Hence, the PG curves and BMI values proposed by the WHO could not be applied to moderate altitude regions such as Bogotá (2640 MASL).
Consequently, in view of the weight, height and BMI differences encountered relative to the CDC-2012 reference data and international surveys, we developed weight, height and BMC curves by age and sex to evaluate PG, nutritional status and body adiposity of school children living at moderate altitude in Colombia.
Overall, weight, height and BMI percentiles provide relevant information to infer the nutritional and health status of children and adolescents,29 regardless of the geographical region. In addition, they may be used to draw comparisons with other international and/or regional samples of similar characteristics, as the actual value of the curves lies in the fact that they help determine the extent to which physiological needs are met during the growth and motor development process.30
For that purpose, percentiles were developed using the LMS method, as it was deemed a valuable tool that represented clear advantages in relation to other traditional calculation methods.31 Cut-off points adopted were the same as those used in the CDC 2000, 2012 and 2016.8,9,32 These values reflected normal, overweight and obesity categories (p < 10, from p10 to p85, from p85 to p95 and p > 95), respectively.
In essence, Colombia exhibits diverse orographic and environmental characteristics that render it an attractive country for PG to be studied. In recent years, the HDI in Colombia has been on the increase, as it was 0.711 in 2013, while for Bogotá it stood at 0.911.33 These results evidence Colombia's rapid rate of economic growth, which must be a growing concern to monitor PG.
Some study strengths stand out. Assessments were conducted in standard fashion by widely experienced evaluators. In addition, in constructing growth curves, we considered the adjustment for altitude34 as well as some criteria suggested by Butte et al,35 such as population individual selection criteria, study design, standardized measurements and statistical models.35 Sample size, however, was determined by non-probability sampling which, presumably, might limit the results achieved. For future studies, the use of probability sampling is recommended as it might facilitate generalization to other regional contexts in Colombia.
In conclusion, weight, height and BMI variables differ from the CDC-2012 reference data as well as from regional studies of South America. These discrepancies helped build weight and height curves by age and sex to monitor growth in school children living at moderate altitude in Colombia. In this study, the BMI index was used for information purposes because, as an overweight indicator, it is deemed inadequate for school children living at moderate altitude.18 Results suggest that it be used and applied in clinical and epidemiolological contexts. #ref">18 Results suggest that it be used and applied in clinical and epidemiolological contexts. REFERENCES