


Servicios Personalizados
Revista

Articulo
 texto en
  Inglés (pdf)
 Articulo en XML
 Referencias del artículo
 Enviar articulo por email
Indicadores
-
 Citado por SciELO
Links relacionados
-
 Similares en
SciELO
Similares en
SciELO
Compartir

 Permalink
Archivos argentinos de pediatría
versión impresa ISSN 0325-0075versión On-line ISSN 1668-3501
Arch. argent. pediatr. vol.116 no.4 Buenos Aires ago. 2018
http://dx.doi.org/10.5546/aap.2018.e508
ORIGINAL ARTICLE
http://dx.doi.org/10.5546/aap.2018.eng.e508
Physical growth in young Chilean football players: Proposal of percentiles based on chronological and biological age
Salustio Carrasco López, Magistera,b, Rossana Gómez-Campos, M.D.c, Jorge Méndez Cornejo, M.D.b, Lautaro Morales, Magisterb, Camilo Urra-Albornoz, Magisterd and Marco Cossio-Bolaños, M.D.b,e
a. Department of Physical Education, School of Education, Universidad de Concepción.
b. Department of Physical Activity Science, Universidad Católica del Maule, Chile.
c. Universidad Autónoma de Chile, Talca.
d. School of Kinesiology, School of Health, Universidad Santo Tomás, Talca. Chile.
e. University Sports Institute (Instituto de DeporteUniversitario, INDUSA), Universidad Nacional de San Agustín, Arequipa, Peru.
E-mail address: Marco A. Cossio-Bolaños, M.D.: mcossio1972@hotmail.com
Funding: None.
Conflict of interest: None.
Received: 10-24-2017
Accepted: 1-22-2018
ABSTRACT
Objectives. a) To compare physical growth to the 2012 American standard from the Centers for Disease Control and Prevention (CDC); b) to analyze physical growth by chronological and biological age; c) to propose physical growth charts based on chronological and biological age.
Methodology. A descriptive (cross-sectional) study was conducted in young Chilean football players based on weight, standing height, and sitting height. These were compared to the CDC-2012 standard. Percentiles were developed using the LMS method.
Results. A total of 642 young Chilean football players aged 13.0-18.9 years were studied. Their body weight was lower than that of the CDC standard from 13.0 to 18.9 years old (p < 0.05), whereas their height showed no significant differences in the initial age categories (13.013.9 and 14.0-14.9 years). Differences started to be observed as of 15.0 years old up to 18.9 years old (p < 0.05). In relation to chronological age, weight explained 31%; standing height, 16%; and sitting height, 0.09%, whereas in relation to biological age, weight explained 51%; standing height, 40%; and sitting height, 54%. Percentiles were developed based on chronological and biological age.
Conclusion. These youth showed different physical growth patterns compared to the CDC-2012 standard. Their assessment reflects better explanatory percentages for biological age than for chronological age. The proposed percentiles may be an alternative to keep track of the physical growth patterns of young football players in sports settings in the short, medium, and long term.
Key words: Growth; Neurodevelopment; Growth charts; Adolescents, Football.
INTRODUCTION
Physical growth is one of the most relevant components of pediatric practice for well and sick child care visits.1 It may be assessed using a non-invasive anthropometry, which is considered the most advisable, simple, and cost-effective technique.2
In general, physical growth charts are used to detect individual abnormalities in growth patterns and to study and monitor public health.3 This information may help to understand the variability and secular trends related to the growth of athletic and non-athletic children and adolescents.
Actually, biological research requires quantitative and/or qualitative documentation regarding morphological size, shape, body composition, growth patterns, and physical development during childhood and adolescence,4 whereas sports-related research seeks to quantify the morphological characteristics of elite athletes to establish a relationship between body structure and sports performance. In addition, it may help to identify and select talented youth who take part in sports programs,6 in the short, medium, and long term.
In general, standard growth charts are required to monitor the physical growth of athletic and nonathletic children and adolescents. Up until now, different international institutes7-9 and some investigators have published percentiles to assess the anthropometric, physical, and body composition profiles10 of professional football players;11 however, to our knowledge, to date no study has described reference values regarding the physical growth of young football players and there are even fewer studies that have described physical growth patterns among football players from different regions and countries.12-15
The logic to understand growth charts is very simple, e.g., a child at any age may be classified in relation to other children of the same sex and age to assess his/her immediate growth;3 however, their interpretation and analysis may be confused by the effects of biological maturation because the intensity and duration of puberty is specific to each subject and may differ considerably among individuals,16 especially among football players who are still growing and developing.
Therefore, in the setting of amateur and grassroots sports, the common practice is to group children into 2-year categories,17 which may reflect the growth, maturation, and, consequently, the advantages of a better physical ability among football players.18 As a consequence, studying physical growth based on chronological and biological age may provide a common reference point to reflect the changes in body dimensions in and between individuals.19
Therefore, the objectives of this study were: a) to compare physical growth to the 2012 American standard from the Centers for Disease Control and Prevention (CDC); b) to analyze physical growth by chronological and biological age; c) to propose physical growth charts based on chronological and biological age.
METHODOLOGY
Participants
A descriptive (cross-sectional) study was conducted in young Chilean talented football players. They were recruited from two professional clubs (Concepción and Talca) and from ten Chilean regions, and national under-12, under-14, under-16, and under-18 teams, who participated in a National Football Championship. Participants were selected in a non-probability manner (quotas). Football players' age ranged between 13.0 and 18.9 years. The sample size was as follows: 13.0-13.9, n= 46; 14.0-14.9, n= 80; 15.015.9, n= 111; 16.0-16.9, n= 142; 17.0-17.9, n= 183; and 18.0-18.9, n= 80.
The national football teams and the players from both professional clubs trained 3-5 times a week for 90-120 min each time,1 and they competed once a week (in general, on Saturdays). Four field positions were considered for the study: goalkeepers (n= 72), defenders (n= 240), midfielders (n= 220), and strikers (n= 110).
Biological age was observed at 15.1 ± 0.9 years of age at peak height velocity (APHV).
The presidents of each national team and club authorized the measurement of anthropometric outcome measures. The parents or legal guardians of young athletes provided their informed consent, and football players gave their assent. Football players were informed that participation was voluntary and that they could leave the study at any time. The study was approved by the Ethics Committee of Universidad Autonoma de Chile (UA 238/2014).
The study included Chilean football players between 13.0 and 18.9 years old and who had signed the informed consent. Football players who were injured and those outside the age range were excluded.
Procedures
Assessments were done before participants did any physical activity from Mondays through Fridays (2014-2016) in the morning (8:0011:00 am), in the club facilities and the pre-game center where the National Football Championship took place. A room was prepared to simulate a lab where the devices necessary for measurements were placed. Football players' dates of birth (day, month, and year) were collected from their birth certificates.
Anthropometric assessments were done by three trained and highly-experienced observers. They followed the standard procedures by Ross and Marfell-Jones.20 Participants' body weight (kg) was measured using an electronic scale (Tanita, United Kingdom, Ltd), with a 100 g precision and a range from 0 to 150 kg. Standing height was measured using a portable stadiometer (SecaGmbh& Co. KG, Hamburg, Germany) with an 0.1 mm precision, and adjusted to the Frankfurt plane. Sitting height (trunk length + head length) was measured with the aid of a 50-cm-tall wooden bench, with a 1 mm precision and a range from 0 to 150 cm. All anthropometric outcome measures were assessed twice. The technical error of measurement (TEM) ranged between 0.45% and 1.0%.
Biological maturation was established based on APHV. It was predicted using the regression equation for men proposed by Mirwald et al.21 Biological age was established at 1-year intervals, which in this study were described into five levels: -1 APHV, 0 APHV, 1 APHV, 2 APHV, and 3 APHV. Physical growth patterns were compared to the American CDC-2012 standard.9
Statistical analysis
Data normal distribution was verified using the Kolmogorov-Smirnov test. A descriptive statistical analysis was performed to establish the arithmetic mean, the standard deviation, and the range. The differences between age and APHV were verified using an analysis of variance (ANOVA) and Tukey's test. Comparisons to the CDC-2012 standard were done using the t test for independent samples. The relationship among outcome measures was estimated using Pearson's correlation coefficient. A stepwise multiple regression analysis was done (R2 and standard error of the mean [SEM]). The significance level was established at 0.05. Analyses were done in the SPSS 16.0 software for Windows. Smoothed percentile curves for weight, standing height, and sitting height were created based on the LMS method.22 The LMSchartmaker Pro version 2.3 software was also used.23 The final percentile curves were the result of 3 smoothed curves specific to chronological and biological age: L (lambda, asymmetry), M (mu, median), and S (sigma, coefficient of variation). The following percentiles were estimated: p3, p5, p15, p25, p50, p75, p85, p90, p95, and p97.
RESULTS
Out of 665 football players who participated in the National Football Championship, 23 were not assessed according to the exclusion criteria;
therefore, a total of 642 football players were studied. Their anthropometric characteristics are described in Table 1. In general, a significant increase was observed in terms of weight, standing height, and sitting height as chronological and biological age increased (p < 0.05).
Table 1. Physical growth outcome measures aligned for chronological and biological age
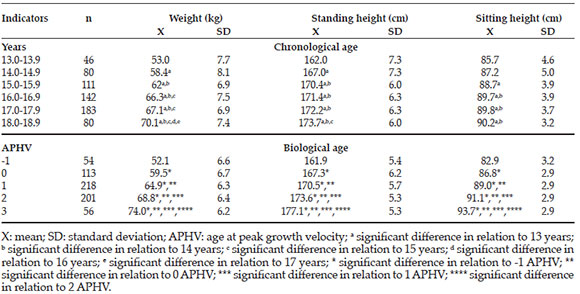
Figure 1 shows the comparisons between weight and height and the CDC-2012 standard. Body weight showed significant differences from 13.0 to 18.9 years (p < 0.05). No significant differences were observed in height at the initial age categories (13.0-13.9 years and 14.014.9 years), whereas they were seen between from 15.0 to 18.9 years (p < 0.05).

Figure 1. Comparison between young Chilean football players' weight and height and the Centers for Disease Control and Prevention 2012 standard
The simple linear regression values for chronological and biological age are shown in Table 2. In relation to chronological age, weight explained 31% and standing height, 16%; however, sitting height showed a null explanatory power (0.09%). In terms of biological age, R2 values improved considerably; for example, for weight (51%), standing height (85%), and sitting height (74%). The three outcome measures were explained in a higher percentage by biological age than by chronological age.
Table 2. Multiple linear regression values for chronological and biological age with physical growth outcome measures

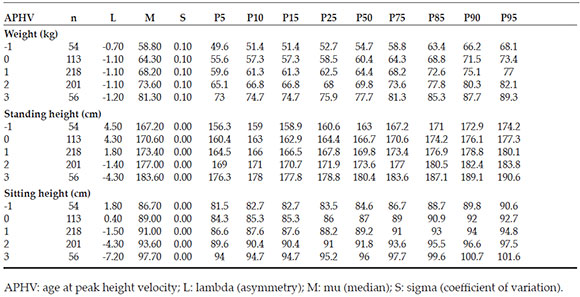
Tables 3 and 4 show the weight, standing height, and sitting height percentiles based on chronological and biological age. In both cases, percentiles were distributed into p5, p10, p15, p25, p50, p75, p85, p90, and p95, respectively.
Table 3. Reference values for weight, standing height and sitting height of young football players based on chronological age
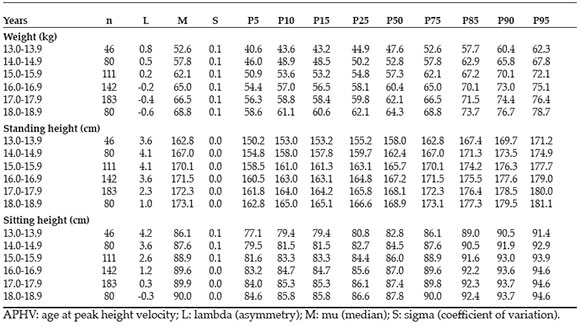
Table 4. Reference values for weight, standing height and sitting height of young football players based on biological age
DISCUSSION
The primary objective of this study was to compare physical growth to the CDC-2012 standard.9 Results show that Chilean football players had lower weight values in all age ranges, whereas there were no differences in terms of height at 13 and 14 years, although significant differences were observed later from 15.0 to 18.9 years.
This is a clear indication that, although young Chilean football players are smaller and lighter than the general American population corresponding to the CDC-2012 standard, their growth patterns were similar to those of young Portuguese and Macedonian football players;13,15 however, in general, they showed lower growth patterns than Brazilian and Spanish football players.12,14 Such differences may probably account for the small delay in biological maturation observed in young Chilean football players (15.1 ± 0.9 APHV), which is generally achieved by 14 years old.
The discrepancies in growth patterns observed in this study could be related to the type of training programs usually carried out at football clubs (amount and intensity), the differences in training styles, and the types and philosophies of football player recruiting.
Another possibility is that the sports programs carried out in countries like Brazil and Spain give priority to taller and heavier children. Actually, this trend is confirmed in the bibliography, which highlights that older, stronger, and early-matured football players are generally selected.12,24
In this setting, several studies have demonstrated that active children, i.e., those who play sports, are consistently taller and heavier than passive children,25,26 and they even show a more advanced maturation than their non-athletic counterparts.18
Therefore, the main contributing factors for success among football players lie in controlling growth and biological maturation.18,27 Consequently, the assessment of these parameters is essential during the sensitive phases of young football players.
The second objective of this study was to analyze physical growth in relation to chronological and biological age. The results have evidenced that weight, standing height, and sitting height should be analyzed based on APHV.
These results show that chronological age is of limited usefulness for the assessment of biological maturation among young football players. Therefore, it is critical to use and implement the APHV in the field of youth football because it is an excellent tool to classify youth athletes.28
Actually, several studies have demonstrated that children with an advanced physical maturation are capable of better performing different physical and motor tasks compared to those with a delayed maturation.29 Therefore, youth coaches and scouts should be aware of including physical and biological maturation in the football player recruitment process without discriminating those who are younger or have a delayed maturation because they may further develop their skills in the future.30
Therefore, once differences in weight, standing height, and sitting height were analyzed, and facing the need to use APHV to analyze the physical growth patterns of young Chilean football players, this study proposed reference values for both cases, although chronological age did not markedly affect physical growth outcome measures.
In general, and from a health standpoint, growth charts are used to perform clinical monitoring, detect individual abnormalities, keep track of growth patterns, monitor public health, and understand variations in secular trends,3 whereas from the perspective of sports, this information (percentiles based on chronological and biological age) may help to organize trainings to screen and select talents, and to monitor and keep track of growth patterns as influenced by training programs.
The percentiles obtained for young Chilean football players based on chronological and biological age may help to modify the current policies in relation to screening, detection, and monitoring of growth patterns. They may also help professionals working with young football players who are continuously identifying their potential talents and whose objective is to optimize the highest levels of performance and sports.
The cut-off points used in this study are based on the traditional American CDC-2000, 2012 standards.8,9 For example, for weight, a value between the p10 and the p85 is considered normal; and > p85, overweight. For height, a value < p5 is considered severe short stature; between p5 and p10, short stature; and > p10, normal. Actually, the percentiles developed in this study may be used for programs offered by sports clubs, sports associations, and youth academies (national teams), which, in general, select their talents at an early age.31 In addition, during the assessments, they could identify and accompany the physical growth patterns (normal, early or delayed) of young football players throughout the sports education process.
The main strength of this study is that it included a large sample of young football players from several Chilean regions, although certain limitations should also be mentioned. For example, cross-sectional data were collected to develop growth reference values, although longitudinal data should have been ideally used because this type of design allowed explanatory inferences. In addition, the APHV technique may not be very accurate for Chilean football players because the initial proposal was based on a sample of Caucasian, non-athletic adolescents; however, at present, it is considered a noninvasive technique to quickly and simply asses somatic maturation in adolescents from different worldwide populations. Future studies should take these aspects into account to prevent potential biases in results.
In short, young Chilean football players have different physical growth patterns compared to the American standard population and international studies. Their assessment reflects better explanatory percentages for biological age than for chronological age. Therefore, the proposed percentiles may be an alternative to keep track of the physical growth patterns of young football players in sports settings in the short, medium, and long term.
1. Overby KJ. Pediatric health supervision. Physical Growth. In: Rudolph AM, Hoffman JIE, Rudolph CD (eds). Rudolph's pediatrics. 20th ed. Stanford: Appleton & Lange; 1996:1-9. [ Links ]
2. Zemel BS, Riley EM, Stallings VA. Evaluation of methodology for nutritional assessment in children: anthropometry, body composition, and energy expenditure. Ann Rev Nutr. 1997;17:211-35. [ Links ]
3. Wells JCK. Toward Body Composition Reference Data for Infants, Children, and Adolescents. Adv Nutr. 2014;5(3):S320-9. [ Links ]
4. Cameron N. Essential anthropometry: Baseline anthropometric methods for human biologists in laboratory and field situations. Am J Hum Biol. 2013;25(3):291-9. [ Links ]
5. Sánchez-Muñoz C, Sanz D, Zabala M. Anthropometric characteristics, body composition and somatotype of elite junior tennis players. Br J Sports Med. 2007;41(11):793-9. [ Links ]
6. Güllich A. Selection, de-selection and progression in German football talent promotion. Eur J Sport Sci. 2014;14(6):530-7. [ Links ]
7. De Onis M, Onyango A, Borghi E, et al. Development of a WHO growth reference for school-aged children and adolescents. Bull World Health Organ. 2007;85(9):660-7. [ Links ]
8. Kuczmarski RJ, Ogden CL, Guo SS, et al. 2000 CDC Growth Charts for the United States: Methods and development. Vital Health Stat 11. 2002;246:1-190. [ Links ]
9. Fryar CD, Gu Q, Ogden CL. Anthropometric reference data for children and adults: United States, 2007-2010. Vital Health Stat 11. 2012;252:1-48. [ Links ]
10. Santos DA, Dawson JA, Matias CN, et al. Reference Values for Body Composition and Anthropometric Measurements in Athletes. PLoS One. 2014;9(5):e97846. [ Links ]
11. Silva AS, Papoti M, Pauli JR, et al. Preparation of percentile tables through anthropometric, performance, biochemical, hematological, hormonal and psychological parameters in professional soccer players. Rev Bras Med Esporte. 2012;18(3):148-52. [ Links ]
12. Gil SM, Gil J, Ruiz F, et al. Anthropometrical characteristics and somatotype of young soccer players and their comparison with the general population. Biol Sport. 2010;27(1):17-24. [ Links ]
13. Valente-dos-Santos J, Coelho-e-Silva MJ, Severino V, et al. Longitudinal study of repeated sprint performance in youth soccer players of contrasting skeletal maturity status. J Sports Sci Med. 2012;11(3):371-9. [ Links ]
14. Leite Portella D, Silva Y, Cossio-Bolaños MA. Crecimiento Físico de Jóvenes Futbolistas en función de la edad cronológica. Rev Peru Cienc Act Fis Deporte. 2014;1(1):7-11. [ Links ]
15. Gontarev S, Kalac R, Zivkovic V, et al. Anthropometrical Characteristics and Somatotype of Young Macedonian Soccer Players. Int J Morphol. 2016;34(1):160-7. [ Links ]
16. Malina RM, Bouchard C, Bar-Or O. Growth Maturation and Physical Activity. 2nd ed. Champaign: Human Kinetics; 2004:277-84. [ Links ]
17. Anderson GS, Ward R. Classifying Children for Sports Participation Based Upon Anthropometric Measurement. Eur J Sport Sci. 2002;2(3):1-13. [ Links ]
18. Malina RM, Ribeiro B, Aroso J, et al. Characteristics of youth soccer players aged 13-15 years classified by skill level. Br J Sports Med. 2007;41(5):290-5. [ Links ]
19. Leite Portella D, Arruda M, Gómez-Campos R, et al. Physical Growth and Biological Maturation of Children and Adolescents: Proposed Reference Curves. Ann Nutr Metab. 2017;70(4):329-37. [ Links ]
20. Ross WD, Marfell-Jones MJ. Kinanthropometry. In MacDougall JD, Wenger HA, Geen HJ (eds). Physiological Testing of Elite Athlete. London: Human Kinetics; 1991:223308. [ Links ]
21. Mirwald RL, Baxter-Jones AD, Bailey DA, et al. An assessment of maturity from anthropometric measurements. Med Sci Sports Exerc. 2002;34(4):689-94. [ Links ]
22. Cole TJ, Bellizzi MC, Flegal KM, et al. Establishing a standard definition for child overweight and obesity worldwide: international survey. BMJ. 2000;320(7244):1240-3. [ Links ]
23. Pan H, Cole TJ. LMSChartmaker. 2006. [Consulta: 28 de marzo de 2015]. Disponible en: http://www.healthforallchildren.com/product-category/shop/software/.
24. Sherar LB, Baxter-Jones ADG, Faulkner RA, et al. Do physical maturity and birth date predict talent in male youth ice hockey players? J Sports Sci. 2007;25(8):879-86. [ Links ]
25. Malina RM, Bielicki T. Growth and maturation of boys active in sports: Longitudinal observations from the Wroclaw growth study. Pediatr Exerc Sci. 1992;4(1):68-77. [ Links ]
26. Malina R, Peña Reyes M, Eisenmann J, et al. Height, mass and skeletal maturity of elite Portuguese soccer players aged 11-16 years. J Sports Sci. 2000;18(9):685-93. [ Links ]
27. Cumming SP, Brown DJ, Mitchell S, et al. Premier League academy soccer players' experiences of competing in a tournament bio-banded for biological maturation. J Sports Sci. 2018;36(7):757-65. [ Links ]
28. Gómez-Campos R, Arruda M, Hobold E, et al. Valoración de la maduración biológica: usos y aplicaciones en el ámbito escolar. Rev Andal Med Deporte. 2013;6(4):151-60. [ Links ]
29. Roemmich JN, Rogol AD. Physiology of growth and development: its relationship to performance in the young athlete. Clin Sports Med. 1995;14(3):483-502. [ Links ]
30. Baldari C, Di Luigi L, Emerenziani GP, et al. Is explosive performance influenced by androgen concentrations in young male soccer players? Br J Sports Med. 2009;43(3):191-4. [ Links ]
31. Güllich A, Emrich E. Individualistic and collectivistic approach in athlete support programmes in the German high-performance sport system. Eur J Sport Society. 2012;9(4):243-68. [ Links ]

