


Servicios Personalizados
Revista

Articulo
 Inglés (pdf)
 Articulo en XML
 Referencias del artículo
 Enviar articulo por email
Indicadores
-
 Citado por SciELO
Links relacionados
-
 Similares en
SciELO
Similares en
SciELO  uBio
uBio
Compartir

 Permalink
Revista argentina de microbiología
versión impresa ISSN 0325-7541versión On-line ISSN 1851-7617
Rev. argent. microbiol. v.36 n.4 Ciudad Autónoma de Buenos Aires oct./dic. 2004
Effects of hydroclimatic anomalies on bacteriological quality of the Middle Paraná River (Santa Fe, Argentina)
F. Emiliani*
Instituto Nacional de Limnología (CONICET-UNL), José Maciá 1933, 3016 Santo Tomé, Provincia de Santa Fe, Argentina y Facultad de Ingeniería y Ciencias Hídricas, Universidad Nacional del Litoral. Ciudad Universitaria, Santa Fe.
*Correspondence: E-mail: brunoemiliani@yahoo.com.ar
SUMMARY
Lenitic and lotic aquatic environments were studied in the Middle Paraná River basin, one of the largest rivers of the world (basin: 1,510,000 km2, length: 2,570 km). The Paraná River (S 31º 42’ 04"; W 60º 29’ 39"), during El Niño-Southern Oscillation (ENSO) (1997-1998), registered maximum flows of 29,962 m3 s-1(more than twice the mean flow) and also positive pluvial anomalies (A) (from +120 mm to +161 mm). However, concentrations of Escherichia coli remained low, with values similar to the mean (p > 0.05) (1.3802 log10 cfu/100 ml). Only a maximum peak (1.903 log10 cfu/100 ml), significantly higher than the mean (p < 0.0001), was detected during the ascending phase of the flood pulse. During La Niña (September 1999 - March 2000; Q =11,255 m3 s-1; A = -78 mm to –84 mm), concentrations of E. coli were significantly lower than the mean (p< 0.0001). During the post-Niña period, with normal flows (Q = 14,900 m3 s-1) but with strong positive pluvial anomalies (A= +118 mm to +377 mm), the fecal indicator density reached maximum values (up to 2.699 log10 cfu /100 ml, p< 0.0001). The multiple regression model used with all the results obtained in the Paraná River showed that variations in concentrations of E. coli are mainly explained by pluvial precipitations and hydrometric level (p = 0.001). Temporal patterns of concentrations of E. coli in a small, secondary course (Q = 101 m3 s-1) followed those of the Paraná River, but concentrations and peaks of E. coli produced by exceptional rains showed a higher magnitude (maximum: 3.325 log10 cfu /100 ml). In the floodplain lakes, away from urban centers, concentrations of E. coli were not associated to hydroclimatic anomalies, but directly to vegetable cover: maximum concentrations were always registered during periods that lakes remained covered by floating macrophytes (mainly Eichhornia crassipes); on the contrary, minimum concentrations were registered during periods without vegetable cover.
Key words: El Niño, Paraná river, Escherichia coli, Eichhornia crassipes.
RESUMEN
Efecto de anomalías hidroclimáticas sobre la calidad bacteriológica del río Paraná Medio (Santa Fe, Argentina). Se estudiaron ambientes acuáticos leníticos y lóticos en la cuenca del río Paraná Medio, uno de los ríos más grandes del mundo (cuenca: 1.510.000 km2, longitud: 2.570 km). El río Paraná (31º 42’ 04"S; 60º 29’39"W), durante El Niño Oscilación Sur (ENOS) (1997-1998), registró caudales máximos de 29.962 m3 s-1(más del doble del caudal medio) y también anomalías pluviales (A) positivas (desde +120mm a +161mm). Sin embargo, la concentración de Escherichia coli se mantuvo baja, con valores similares (p > 0,05) a la media (1,3802 log10ufc/100ml). Solamente se detectó un pico máximo (1,903 log10ufc/100ml) significativamente mayor a la media (p < 0,0001) durante la fase ascendente del pulso de la creciente. Durante La Niña (sept. 1999 - marzo 2000; Q =11.255 m3 s-1 ;A = -78mm a -84mm), las concentraciones de E. coli resultaron inferiores a la media (p<0,0001). Durante el período post-Niña, con caudales normales (Q = 14.900 m3 s-1) pero con fuertes anomalías pluviales positivas (A= +118 mm a +377mm), la densidad del indicador fecal alcanzó valores máximos (hasta 2,699 log10ufc /100ml, p< 0,0001).La aplicación de un modelo de regresión múltiple al conjunto de los resultados obtenidos en el río Paraná, muestra que las variaciones en la concentración de E. coli son principalmente explicadas por las precipitaciones pluviales y el nivel hidrométrico (p = 0,001). Los patrones temporales de las concentraciones de E. coli en un pequeño cauce secundario (Q = 101 m3s-1) siguieron a las del río Paraná, pero las concentraciones y los picos de E. coli producidos por lluvias excepcionales fueron de mayor magnitud (máximo: 3,325 log10ufc /100ml). Enlas lagunas de la llanura de inundación, lejos de centros urbanos, la concentración de E. coli no estuvo asociada con anomalías hidroclimáticas, sino directamente con la cobertura vegetal: las concentraciones máximas se registraron siempre durante los períodos que permanecían cubiertas con macrófitas flotantes (principalmente Eichhornia crassipes). Durante los períodos sin cobertura vegetal, por el contrario, se registraron las concentraciones mínimas de E. coli.
Palabras clave: El Niño, Río Paraná, Escherichia coli, Eicchornia crassipes
INTRODUCTION
The cycle of El Niño-Southern Oscillation (ENSO) is an irregular oscillation of the climatic system, which occurs with a periodicity of approximately 3 to 4 years (28). It consists of a warm phase (El Niño) and a cold phase (La Niña); it is mainly a tropical event, but its impact is global: it affects the pluvial and hydric regime and produces profound economical and social impacts in extense areas of the planet (38), including the province of Santa Fe, Argentina (19).
There is evidence that suggests a relationship between hydroclimatic anomalies with diseases and the increase and dispersion of pathogen organisms (5,14, 22, 24, 31, 34, 35). Likewise, anthropogenic alterations (disturbances by which soils and waters are polluted) can intensify the consequences derived from those anomalies (14). Flooding or strong rains can break down barriers between sewage waters (or pollutants deposited on the ground) and waters used for human consumption or recreational ac-tivities.
The biological response to the El Niño phenomenon is only known in oceanic and estuarine environments (4, 26). There are no records on the effect of hydroclimatic anomalies on populations of E. coli in great fluvial systems.
In the Paraná River basin, the impact of the ENSO was shown in some studies (6-9) and it was unequivocally related to climatic and hydrological anomalies. Depetris and Kempe (7, 8) estimated its effect on the transport of organic and inorganic sediments, carbon dynamics (total, dissolved and particulate carbon) and CO2 partial pressure pre-ENSO and during the flooding period.
As noticed by Paoli et al. (30), the Plata basin is, because of its extension, one of the largest of the world (3,100,000 km2). Within this system, the Paraná River basin (1,510,000 km2), stands out as the most important river of the hydrographic system of the Plata River due to the magnitude of its mean flow (14,100 m3s-1), the extension of the tributary area and the length of its course (2,570 km). The overflows of the Paraná River in Argentina depend on contributions produced upstream, outside the Argentinian territory. Inside the territory of Argentina, from the confluence of the Paraná and Paraguay rivers, and after covering a distance of 750 km in a north-south direction up to the city of Rosario, the section is called “Middle Paraná River” (20). Rains produced in the Upper Paraná, Iguazú River and Paraguay River basins directly cause the overflows in the mid and lower sections, while there is a low incidence of contributions of these two sections. Low contributions are due to the precipitation regime, with lower values than in the upper section and with a strong decrease from east to west. The physical characteristics of the mid section contribute to this situation: it is, in its greater proportion, a typically plain area, with a great capacity of superficial storage and lowrun-off.
About 30% of the Middle Paraná floodplain (approximately 13,000 km2) is covered by a wide variety of permanent or temporary lakes. Eichhornia crassipes is one of their most abundant floating macrophytes. In the “El Tigre” Lake, for example, its mean biomass (dry weight) is in the range of 8 - 24 t ha-1(27). The extreme floodings, as those produced during the ENSO, can clean those water courses and reacommodate the communities to their first succesional stages (23), but there are unknown bacteriological aspects associated.
The understanding of the relationships between hydroclimatic factors and bacteriological quality of water can contribute to optimize preventive sanitary strategies. Oriented towards that purpose, the objective of this study was to estimate the effects of hydroclimatic anomalies, produced during 1997 -2000, on the concentration of fecal contamination indicators, in some lenitic and lotic aquatic environments of the Middle Paraná River basin (Santa Fe, Argentina).
MATERIALS AND METHODS
Sampling locations
Samples were collected in four aquatic environments: two fluvial environments (Paraná and Correntoso rivers) and two lacustrine ones (“El Tigre” and “Los Matadores” shallow lakes).
In the Paraná River main course, samples were taken from the centre (31º 42’ 04»S;60º 29’39»W), and the right (31º 41’ 58"S; 60º 20’ 38"W) and left (31º 42’ 18" S; 60º29’ 36"W) banks. This cross-section is morphologically stable, quite deep (22 m) and wide (600 m) at average stages. The Paraná river catchment area up to the studied section is 2.04 x 10⁶ km2, representing 78% of the total drainage surface (2.6 x 10⁶ km2). The mean annualdischarge is 14,100 m3/s, so that 88% of total water volume flows through this cross-section (10). The sampling station is free of municipal or industrial important waste waters, which, however, are concentrated in the last 450 km of the course.
The Correntoso River (S 31º 41' 20.5" and W 60º 42' 42.6") is a small secondary course (Q = 101 m3 s-1) of the Middle Paraná floodplain. It begins in the Santa Fe River, 2.5 km downstream of the Santa Fe Port. After going through three islands in a 6 km course, it runs into the Coronda River, another secondary course of the Paraná River (500 m downstream of the mouth of the Salado River). The flow of the Correntoso River is correlated to the flow of the Paraná River (r = 0.999, p< 0.001) and the river overflows when the water level (h) in the Paraná Port exceeds 4.5 m (1).
Los Matadores Lake is located in the Clucellas Island, very close to the Correntoso River. In most of the hydrological cycle it is communicated with the Correntoso River, until h < 2 m. It has a surface area of 32,950 m2, a volume = 50,800 m3, a mean depth = 1.54 m and a maximum depth= 2.75 m (h = 3.28 m). El Tigre Lake is located in the El Tigre Island, delimited by two arms of the Correntoso River. As the former one, it has aquatic and marshy vegetation. The communication with the Correntoso River stops when h < 3.6 m. The mean volume of the lake is 30,800 m3 (9,300 to 123,000 m3). The water level of the Paraná River, in the Santa Fe Port, explains the variability of the lake water level (r = 0.947, p < 0.01) (17).
Field and hydroclimatic data
During the samplings, transparency (Secchi disc), pH (B213 Twin, Horiba, reproducibility= ± 0.1 UpH), conductivity, salinity (both with B173 Twin, Horiba, ± 1 %), temperature and dissolved oxygen (D-25, Horiba, reproducibility= ± 0.5%) were measured in situ.
According to Rose et al (35), extreme precipitation is defined as total monthly precipitation accumulation that far exceed expected total monthly precipitation for station. A Z score is calculated for a specific month from the 100-year average monthly total and then dividing by the corresponding 100-year standard deviation. Z score = (observed rainfall– 100-year mean) / 100-year standard deviation (33,35).
Meteorological data provided by the INTA EEA Paraná (S 31º 50', W 60º 31') (http://www. parana.inta.gov.ar), located in the left margin of the Middle Paraná River and by the CIM (FICH - UNL), Santa Fe (S 31º 38', W 60º 40') (http://www.fich.unl.edu.ar/cim), located in the right margin of the same river, were used to analyze the relationships between concentrations of E. coli in the Middle Paraná River (center and margins) and pluvial anomalies. At the first station, pluviometric data were available since 1934 and, at the second station, data were available since 1901. Water level data of the Paraná River (period of 100 years) were provided by the CIM (FICH - UNL).
Sampling frequency, indicators and bacteriological techniques used
Subsurface samples were collected with sterile glass, Simax like bottles (500 ml), at 15 cm depth and maintained refrigerated and at dark until their analyses (< 5 h). Samples were collected monthly, from November 1997 to December 1998 and again from November 1999 to December 2000.
As an indicator of bacteriological quality, the concentration of E. coli, a reasonable indicator of fecal contamination (2), and according to the 21st Agenda (37), an environmental indicator of sustainable development, was used. The indicator is closely linked with several others in the environmental and socioeconomic (health) categories, including biochemical oxygen demand in water bodies, waste water treatment coverage, and percent of population with adequate excreta disposal facilities (37).
The method of enzymatic detection (β-D-Glucuronidase) was used with Chromocult (Merck) plates to quantify E. coli, according to Emiliani et al. (13). Plates were incubated at 44.5 ºC ± 0.2 ºC for 24 h in a thermostatic bath. Blue and violet colonies, turning cherry-red when they were covered with indole reagent, were considered E. coli.
Previously (11), concentrations of total coliforms and fecal coliforms had been studied under normal hydrological situations in the Paraná River (period February 1978 - May 1979): mean flow = 12,915 m3s-1; no extraordinary floodings nor extreme pluvial precipitations were registered (11).The same groups were estimated again to compare the results with those obtained in this study. Counts were carried out according to the Standard Methods for the examination of water and wastewater (21), with five tubes per dilution, using Lauryl tryptose broth and EC broth (44.5 ºC).
Since there was no data on concentrations of E. coli in the Paraná River, concentrations registered during those episodes were compared with the mean concentration of E. coli to estimate the impact of anomalous pluvial episodes.
Fecal streptococci (Azide dextrose broth and PSE agar) and Pseudomonas aeruginosa (Asparagine broth and Acetamide agar) concentrations were also estimated according to Standard Methods for the examination of water and wastewater (21) to complement the estimation of bacteriological quality during the ENSO.
Statistical analysis
GraphPad Instat 3.02 program (GraphPad Software, California) was used for correlations and multiple regression analyses. This program verifies if the contribution of each variable is statistically significant (p < 0.05) and also detects problems of multicollinearity (i.e., redundant information). The same program was used for the analysis of differences among means, carrying out parametric or non-parametric tests depending on whether the whole data to be compared corresponded to a normal distribution or not. A statistical software (Graphpad Statmate, San Diego, CA, v. 1.01) provided values of probabilities associated to t and Z tests.
RESULTS AND DISCUSSION
Magnitude of hydroclimatic anomalies
Many factors, such as dilution (higher or lower flows), rains, conductivity, sun radiation, temperature, pH, etc., can be involved in processes of higher or lower inactivation of fecal coliforms in natural waters. During the studied period, significant changes in some of the mentioned variables were observed, specially in the hydrometric level and pluvial precipitation.
In fact, in the Paraná Port, during October 1997 - June 1998 (Fig. 1), after a prolonged period (179 days) of mid levels (3.41±0.54 m), a period (227 days) with increasing hydrometric levels, from 3.0 m to 6.72 m (which means a flow from 14,000 m3s-1 to, approximately, 30,000 m3 s-1) began. This hydric situation was not only exceptional because of the levels reached but also due to its duration (213 days with higher levels than the alert level: ≥ 5 m and 58 days with higher levels than the evacuation level: ≥ 5.5 m). After the mentioned maximum peak, a period of prolonged low water (from 6.72 m to 3.61 m in 101 days) followed and then there was a new peak (5.2 ±0.1 m) of relatively short duration (24 days).

In the Middle Paraná River basin, these positive hydrological anomalies were similar to those registered in 1982 – 1983, but of a lower magnitude and with the particularity of having appeared together with important rains (20). Rains accumulated during December 1997 and January and March 1998 exceeded the annual means registered during the same months, although with higher or lower statistical significance according to the pluviometric data used (Table 1).

After a period during which hydrometric levels of the Paraná River registered normal values (December 1998 through August 1999, x = 3.60 m ± 0.43 m), a sustained low water began, remaining during six months (September 1999 - March 2000) at bellow 2.50 m (x = 1.95 m “0.27 m); at the same time, negative pluvial anomalies were registered (Table 1). The hydroclimatic situation described indicated the beginning of an episode of “La Niña”, although of low magnitude (according to the National Oceanic and Atmospheric Administration - www.cpc.ncep.noaa.gov). Coincidentally, differences of pluvial precipitations in relation to historical means were not significant (p > 0.05) (Table 1). Nevertheless, medians of some variables were significantly different (p < 0.05) to values registered during “El Niño” (Table 2).

After La Niña, since April 2000 (specially in April, May and November), important positive pluvial deviations were registered (Table 1). During this new rainy period, levels of the Paraná River (h) remained significantly lower (p < 0.0001) than those registered during pluvial excesses, which occurred during the previous rainy period (h = 3.02 m ± 0.27 m versus h = 5.25 m ± 0.35 m).
Effects of hydroclimatic anomalies on indicators of fecal contamination in the Paraná and Correntoso rivers
Mean concentration of fecal coliforms (Table 3), obtained during the 1997-1998 period in the Paraná River, was lower than that obtained during February 1978 - March 1979 at the same sampling point (Emiliani, 1980): 1.293 log10MPN FC/100 ml versus 1.906 log10MPN FC/100 ml (p < 0.0001). Concentrations of total coliforms were also lower, but the difference was not statistically significant (2.153 log10MPN TC/100 ml vs. 2.492 log10MPN TC/100 ml, p= 0.2416).

Concentrations of fecal streptococci (Table 3) during the ENSO did not exceed the standards currently used in the European Union (12), nor those of the US-EPA (12) for bathing waters. Neither the concentrations of P. aeruginosa, for which concentrations lower than 100 cfu /100 ml (12) have been recommended.
The concentrations of E. coli remained low in the center of the Paraná River and similar (p = 0.7250) to those of the right and left margins (Fig. 2). The same figure shows that there were not many variations, with only a peak, in the center as in the margins, in the ascendent branch of the first flooding pulse, coinciding with the extreme local rains (January 1998). Furthermore, during December 1997 and March 1998, also with positive pluvial anomalies, concentrations of E. coli were lower than the mean (Table 4).

Minimum concentrations of E. coli (<1.0 log10cfu/100 ml), in both margins, were detected after the onrush of water in the flood and in coincidence with the two flooding peaks (h = 6.72 m, and 5.34 m, April and November 1998, respectively). This decrease of concentrations can indicate the effect of dilution of great water volumes passing through the system. In fluvial systems, the literature shows that this process of dilution is shared by the total number of bacteria (25) and other aquatic organisms, as macroinvertebrates, phytoplankton and zooplankton (16, 18, 29). On the other hand, if the flooding valley was an important supplier of coliforms, substantial peaks could have been observed during low water, when the valley drains into the river.
Low concentrations of E. coli were accentuated, in both margins, during negative pluvial anomalies, which suggests that there are no point sources of contamination near the sampling area.
Fluctuations of concentrations of this indicator in the Paraná River could be due to the higher or lower incidence of non-point sources. As it is known (32), survival of coliforms is variable and depends on physical and biological factors. In general, and particularly for E. coli, survival is considered relatively low (36) and, therefore, usually, this bacteria is considered an indicator of recent fecal contamination (15). However, in sectors of non-polluted rivers, E. coli is also detected, but always in low concentrations. Thus, for example, concentrations of E. coli in non-polluted sectors of the Zambezi River (7 to 70 E. coli /100 ml) (15), or of the Ganges River (6 to 68 E. coli /100 ml) (3), show the same order of magnitude than those of the Paraná River.
At the end of the drought season, exceptional values in concentrations of E. coli were registered (Fig. 2). These concentrations were associated to local pluvial extremes and normal flows. Concentrations varied according to the point of sampling, but almost all of them were statistically significant in relation to the mean (Table 4).
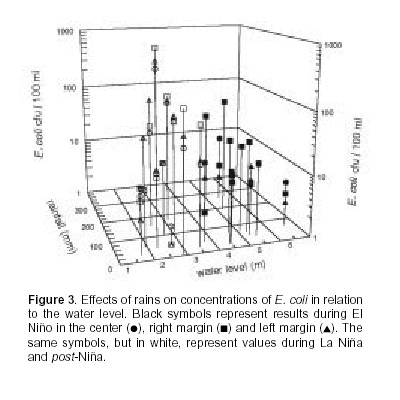
Low concentrations of E. coli which were usually registered in the Middle Paraná River can be due to the fact that 95% of the flow is constituted by rains produced upstream (basins of the Upper Paraná, Iguazú and Paraguay rivers; Giacosa et al., 20). These rains reach the Middle Paraná as a flow after passing along 750 km. This distance is covered in one or two weeks, according to the magnitude of the flood and the conditions of the flooding valley (Paoli - INA, pers. comm., 2003). It is probable that, during this period of time, coliforms became affected by environmental factors adverse to their survival or to their permanence in the water (dispersion and sedimentation). Therefore, maximum concentrations of E. coli were expected in the Paraná River, specially in relation to extraordinary local rains and more reduced river flows (Fig. 3). This means a lower dilution capacity and also a lower percentage of mortality (or losses by sedimentation), because of the lower transit time up to the sampling point. Furthermore, during the post-Niña rainy period, the highest concentrations of E. coli in the Paraná River were registered in the margins, producing a spatial heterogeneity not observed before (Fig. 2).
The multiple regression lineal model, constituted by the whole group of results, also shows that pluvial precipitations and water level are two factors related with the concentration of E. coli (R = 0.684; p = 0.001). Variables measured in the field (transparency, conductivity, oxygen and temperature) did not give any significant contribution (p > 0.05) to the model, or showed collinearity problems.
Concentrations of E. coli in the secondary course (Correntoso River) showed a pattern of temporal fluctuations similar to those found in the Paraná River (Fig. 2). They differentiated, however, by the higher magnitude of maximum concentrations reached during the episodes of extreme pluvial precipitations (Table 5), specially during the post-Niña period. These higher concentrations, in relation to the Paraná River, can be attributed to the lower capacity of dilution and to being downstream of urban centers (city of Santa Fe).

Effects of hydroclimatic anomalies on the fecal contamination indicator in alluvial valley lakes
The death of rooted plants that could not grow at the rhythm of the flood (Paspalum repens, Ludwigia peploides and Enhydra anagallis) was verified at the beginning of the flooding process. This episode was associated to minimum dissolved oxygen values (from 1.8 to 0.0 mg/l). It is possible that during decomposition of plants nutrients used by fecal coliforms were freed, which could explain the first peak in concentrations of E. coli. On the other hand, the death of aquatic rooted plants left free spaces that favoured the establishment of floating aquatic vegetation (native plants or derived from other aquatic environments).
The effect of El Niño on the permanence of floating aquatic vegetation (specially represented by Eichhornia crassipes) was different in the El Tigre Lake than in the Los Matadores Lake. The latter, as opposed to the former, could maintain the cover of macrophytes during the extraordinary flood, both reducing the population during low water.
During low water, concentrations of E. coli decreased in both locations, although to a greater extent in the El Tigre Lake (0.124 log10cfu/100 ml). High concentrations of E. coli in the rhizosphere of E. crassipes (Table 3) suggest that the higher or lower cover of floating macrophytes can influence concentrations of E. coli in the other water body (without vegetation). The abundance of fecal coliforms in the rhizosphere of aquatic plants is not surprising: they are also found in roots of subtropical terrestrial foraging grasses (39). Possibly, this could be a beneficial association for the macrophyte because of the capacity of fixing N2 that some species of fecal coliforms have (39). Coliforms, also benefit from a higher provision of nutrients of plant origin and protection of sun radiation in the aquatic environment.
At the end of the drought period, the Los Matadores Lake remained free of vegetation, while the El Tigre Lake was being totally covered by floating macrophytes (until remaining almost inaccessible). As expected, maximum concentrations of E. coli were, thus, registered in the El Tigre Lake (2.908 log10cfu/100 ml).
The results of this study highlight that bacteriological quality of the Middle Paraná River does not change during negative hidroclimatic anomalies (“La Niña”), nor when extreme rains coincide with extraordinary flows (“El Niño”). The highest deterioration of bacteriological quality of the Middle Paraná River is associated to extreme pluvial episodes that occur during normal flows (post-”La Niña”). The results also allow to conclude that bacteriological quality of alluvial valley lakes of the Middle Paraná River is not directly related to those hidroclimatic events but with the degree of their plant cover.
Acknowledgements
I would like to thank the assistance and support of S.M. González, M.O. García de Emiliani, A. Regner, E. Lordi (INALI, CONICET-UNL), E. Rodriguez (FICH-CIM, UNL), and C. Paoli (INA). This work was partially supported by a research grant from Facultad de Ingeniería y Ciencias Hídricas, Universidad Nacional del Litoral (CAI+D), Argentina.
REFERENCES
1. Anselmi de Manavella MI, García de Emiliani MO (1995) Composición y dinámica del fitoplancton en una sección transversal del río Correntoso.Rev. Asoc. Cienc. Nat. Litoral 26: 39-54. [ Links ]
2. Bartram J, Rees G (2000) “Monitoring bathing waters”. E and FN Spon, Londres [ Links ]
3. Bilgrami KS, Kumar S (2003) Bacterial contamination in water of the River Ganga and its risk to human health.Internat. J. Environ. Health Res. 8: 5-13. [ Links ]
4. Chávez FP, Strutton PG, Friederich GE, Feeley RA, Feldman FG, Doley MJ, Phaden MJ (1999) Biological and chemical response of the equatorial Pacific Ocean to the 1997-98 El Niño.Science 286: 2126-2131. [ Links ]
5. Colwell RR, Patz JA (1998) Climate, infectious disease and health. An interdisciplinary perspective. American Academy of Microbiology, Washington. [ Links ]
6. Depetris PJ, Gaiero DM (1998) Water-Surface slope, total suspended sediment and particulate organic carbon variability in the Paraná River during extreme flooding.Naturwissenschaften 85: 26-28. [ Links ]
7. Depetris PJ, Kempe S (1990) The impact of the El Niño 1982event on the Paraná River, the discharge and carbon transport.Palaeogeogr., Palaeoclimatol., Palaeoecol. (Global and Planetary Change Sect.) 89: 244. [ Links ]
8. Depetris PJ, Kempe S (1993) Carbon dynamics and sources in the Paraná River.Limnol. Oceanogr. 38:382-385. [ Links ]
9. Depetris PJ, Kempe S, Latif M, Mook WG (1996) ENSO-Controlled flooding in the Paraná River (1904-1991).Naturwissenschaften 83: 127-129. [ Links ]
10. Drago E (1984) Estudios limnológicos en una sección transversal del tramo medio del río Paraná.Rev. Asoc. Cienc. Nat. Litoral 15: 1-6. [ Links ]
11. Emiliani F (1980) Aspectos ecológicos de los indicadores de contaminación en el río Paraná medio.An. Sanidad 14: 115-138. [ Links ]
12. Emiliani F (2003) Microbiología ambiental: indicadores, estándares, muestreos. Asociación Ciencias Naturales del Litoral, Santa Fe. [ Links ]
13. Emiliani F, Lajmanovich R, Acosta MA, Bonetto S (1999) Variaciones temporales y espaciales de coliformes y de Escherichia coli en aguas recreativas fluviales (Río Salado, Santa Fe). Relación con los estándares de calidad.Rev. Arg. Microbiol. 31: 142-156. [ Links ]
14. Epstein PR (1999) Extreme weather events: The health and economic consequences of the 1997/98 El Niño and La Niña. http.//chge2.harvard.edu/enso/samericagrouprprt3.html. [ Links ]
15. Feresu SB, Van Sickle J (1990) Coliforms as a measure of sewage contamination of the River Zambezi.J. Appl. Bacteriol. 68: 397-403 [ Links ]
16. García de Emiliani MO (1990) Phytoplankton ecology of the middle Paraná River.Acta Limnol. Brasil. 3: 391-417. [ Links ]
17. García de Emiliani MO (1993) Seasonal succession of phytoplankton in a lake of the Paraná River floodplain, Argentina.Hydrobiologia 264: 101-114 [ Links ]
18. García de Emiliani MO (1997) Effects of water level fluctuations on phytoplankton in a river-floodplain lake system (Paraná River, Argentina).Hydrobiologia 357: 1-15. [ Links ]
19. García NO, Venencio MV (1998) El Niño, la Niña y el agua en la Provincia de Santa Fe (Argentina). En: FICH -UNL (Ed), Anales XVII Congreso Nacional del Agua y II Simposio de Recursos Hídricos del Conosur, Santa Fe, p. 22-31. [ Links ]
20. Giacosa R, Paoli C, Cacik P (2000) Conocimiento del régimen hidrológico. In: Paoli C, Schreider M (Ed), El río Paraná en su tramo medio. Universidad Nacional del Litoral, Santa Fe, p. 70-103. [ Links ]
21. Greenberg AE, Clesceri LS, Eaton AD (1992) Standard methods for the examination of water and wastewater. American Public Health Association, Washington. [ Links ]
22. Harvell CD, Kim K, Burkholder JM, Colwell RR, Epstein PR, Grimes DJ, Hofmann EE, Lipp EK, Osterhaus AD (1999) Emerging marine disease: Climate links and anthropogenic factors.Science 285: 1505-1510. [ Links ]
23. Junk WJ, Bailey P, Sparks RE (1989) The flood pulse concept in river-floodplain systems. En: Dodge DP (Ed), Proceedings of the International Large River Symposium (LARS). NRC Research Press, Otawa, p. 110-127. [ Links ]
24. Kovatz RS (2000) El Niño and human health.Bull. World Health Organ. 78: 1127-1135. [ Links ]
25. Lewis WM, Saunders JF, Dufford R (1990) Suspended organisms and biological carbon flux along the lower Orinoco river. En: Weibezahn FH, Alvarez H, Lewis WM (Ed), El río Orinoco como ecosistema. Edelca y Fondo Editorial Acta Científica Venezuela, Caracas, p. 269-300. [ Links ]
26. Lipp EK, Kurz R, Vincent R, Rodríguez-Palacios C, Farrah SR, Rose JB (2001) The effects of seasonal variability and weather on microbial fecal pollution and enteric pathogens in a subtropical estuary.Estuaries 24: 266-276. [ Links ]
27. Maine MA, Suñe NL, Panigatti MC, Pizarro MJ, Emiliani F (1999) Relationships between water chemistry and macrophyte chemistry in lotic and lentic environments.Arch. Hydrobiol. 145: 129-145. [ Links ]
28. McPhaden MJ (1999) Genesis and evolution of the 1997-98 El Niño: a review.Science 283: 950-954. [ Links ]
29. Neiff JJ (1990) Aspects of primary productivity in the lower Paraná and Paraguay riverine system.Acta Limnol. Brasil. 3: 77-117. [ Links ]
30. Paoli C, Iriondo M, García N (2000) Características de las cuencas de aporte. In: Paoli C, Schreider M (Ed), El río Paraná en su tramo medio. Universidad Nacional del Litoral, Santa Fe, p. 28-68. [ Links ]
31. Patz JA, Epstein PR, Burke TA, Balbus JM (1996) Global climate change and emerging infection disease. J. Amer. Med. Ass. 275: 217-223. [ Links ]
32. Pommepuy M, Guillaud JF, Dupray E, Derrien A, Le Guyader F, Cormier M (1992) Enteric bacteria survival factors.Wat. Sci. Tech. 12: 93-103. [ Links ]
33. Prosser JI (1998) Mathematical Modeling and Statistical Analysis. In: Burlage RS, Atlas R, Stahl D (Ed), Techniques in Microbial Ecology. Oxford University Press, New York, p. 408-437. [ Links ]
34. Rose JB, Huq A, Lipp EK (2001) Health, climate and infectious disease: a global perspective. American Academy of Microbiology, Washington, DC. [ Links ]
35. Rose JB, Daeschner S, Easterling DR, Curriero FC, Lele S, Patz JA (2000) Climate and waterborne disease outbreaks.J. Water Work. Assoc. 92: 77-85. [ Links ]
36. Toranzos GA, McFeters G, Borrego JJ (2002) Detection of microorganisms in environmental freshwaters and drinking waters. In: Hurst CJ, Crawford RL, Knudsen GR(Ed) Manual of Environmental Microbiology. ASM Press, Washington, D.C. p. 205-219. [ Links ]
37. United Nation Division for Sustainable Development (1999) Agenda 21: Protection of the quality and supply of freshwater resources. http://www.un.org/esa/sustdev/indisd/english/chapt18e.htm. [ Links ]
38. Wang HJ, Zang RH, Coles Fl, Chávez FP (1999) El Niño and the related phenomenon southern oscillation (ENSO): The largest signal in interannual climate variation.Proc. Natl. Acad. Sci. USA 96: 11072. [ Links ]
39. Wright SF, Weaver RW (1981) Enumeration and identification of nitrogen-fixing bacteria from forage grass roots. Appl. Environ. Microbiol. 42: 97-101. [ Links ]
Recibido: 5/5/04
Aceptado: 25/10/04

