Serviços Personalizados
Journal
Artigo
Indicadores
-
 Citado por SciELO
Links relacionados
-
 Similares em
SciELO
Compartilhar
Latin American applied research
versão impressa ISSN 0327-0793
Lat. Am. appl. res. v.33 n.3 Bahía Blanca jul./set. 2003
The influence of heat treatment on the corrosion behaviour of Fe69.5Cu1Nb3B9Si13.5Cr4 FINEMET type alloy
D. R. Salinas1, S. G. García1, R. Di Santo1, F. F. Marzo1, J. B. Bessone1 and A. R. Pierna2
1 INIEC - Dto. Ing. Química, Univ. Nac. del Sur, 8000 Bahía Blanca, Argentina.
dsalinas@criba.edu.ar
2 Dto. de Ing. Química y del Medio Ambiente, Univ. del País Vasco, P.O. Box 1379, E-20080 San Sebastián, España
Abstract ¾ The influence of the annealing treatment on the passivating ability of the Fe65.5Cu1Nb3B9Si13,5Cr4 nanocrystalline alloy in 2 M HCl solution was studied by differential scanning calorimetry (DSC), atomic force microscopy (AFM), scanning electron microscopy (SEM) and conventional electrochemical techniques. The samples were isothermally annealed at 525 C (onset of nanocrystallization) and 600 C during different times and the fraction of transformation was determined by DSC. The initial stages of crystallization could be well characterized by AFM and the images have showed hemispherical features related to the first stage of nanocrystallization. These features, interpreted as a -Fe(Si) nanocrystallites embedded in the residual amorphous matrix, increased in number depending on the time or temperature of the thermal treatment, in agreement with the DSC studies. The results indicate that the nanocrystallization of the alloy produced an improvement in their passivating ability. The current density in the active-passive transition have a minimum value when the fraction crystallized reached a maximum and the nanocrystallites formed have not started to coalesce.
Keywords ¾ Amorphous Alloys. FINEMET. AFM. Nanocrystallization. Corrosion.
I. INTRODUCTION
During the last years, the study of amorphous and nanostructured materials has been increasing at an accelerated rate. These materials exhibit many unique and interesting physical and chemical properties derived from their particular metallurgical structure with a number of potential technological applications. For instance, amorphous alloys have been tested as electrodes in electrochemical reactors due to their promising electrocatalytic properties (Pierna et al., 1997). Special attention has been paid on nanocrystalline materials derived from crystallizing amorphous ribbons of (Fe,B)-based alloys, which present excellent soft magnetic properties and have a great application in noise filters and choke coils, between others. As a result, a family of alloys known as FINEMET type has emerged, and the alloy composition most widely studied is Fe73.5Cu1Nb3B9Si13.5 (Yoshisawa et al., 1988; Yoshisawa, 1999). This nanostructured alloy is obtained by thermal treatment of the corresponding amorphous alloy during a primary crystallization process, producing a bcc a -Fe(Si) nanocrystalline phase (grain size » 10 nm) embedded in a residual amorphous matrix (Hono and Ping, 2000). The a -Fe(Si) phase has been well characterized and its concentration of Si is about 19 to 20 at.% (Hampel et al., 1992). For this concentration of Si a DO3 structure was proposed consisting of an A-lattice with A sites occupied by Fe atoms and a D-lattice with D sites occupied by Fe or Si atoms. Cu and Nb are not soluble in the nanocrystalline phase, therefore, the amorphous grain boundary phase consists of less Fe and Si and more B, Cu and Nb than the as-quenched amorphous alloy. The roles of Cu and Nb additions in this nanocrystallization process have been the subject of many investigations recently reviewed (Hono and Ping, 2000). It is accepted that since the enrichment of Nb and B stabilizes the remaining amorphous phase, the growth of the a -Fe(Si) primary crystals is suppressed. Besides, Cu atoms form Cu-enriched clusters prior to the onset of crystallization, suggesting that Cu clustering stimulates the nucleation of the a -Fe(Si) primary particles in the subsequent crystallization stage. As a result, for combined additions of Cu and Nb, the induction frequency of crystallites is very high owing to the presence of the Cu, but the grain coarsening is retarded because of the rejection of Nb into the matrix. Thus, the progression to a large fraction of ultra fine crystallites promotes the magnetic softening of the alloy (Herzer, 1990).
The composition obviously determines the corrosion behaviour of these alloys. The influence of chromium additions and nanocrystalline structure on the corrosion resistance has been recently analyzed by electrochemical and atomic force microscopy studies (Marzo et al., 1998; Salinas et al., 2000). The addition of ³ 4 at.% chromium to the alloys improves their corrosion resistance by the formation of passive films mainly formed of hydrated chromium oxyhydroxide.
The aim of this work is to study in more detail the passivating ability of the Fe69.5Cu1Nb3B9Si13.5Cr4 FINEMET type alloy (F-Cr4 alloy) with different volume fractions of crystalline and amorphous phases obtained by appropriate crystallization from the glassy state.
II. EXPERIMENTAL
The alloy ingots were prepared by arc melting in a water-cooled copper crucible under Ar-atmosphere using 99,95% ultrapure metals (Goodfellow, Cambridge Ltd.). From these ingots, amorphous alloy ribbons 10 mm wide and 20-30 m m thickness were obtained by the planar flow casting method described in a previous work (Sistiaga et al., 1998).
The amorphous nature of the alloys was confirmed by X-ray diffraction and the compositions were determined by inductively coupled plasma (ICP). The samples were isothermally annealed for different times at 525 C (onset of crystallization) and 600 C to produce microstructural changes.
The fraction of transformation corresponding to the first step of crystallization produced by the mentioned annealing treatment was determined by differential scanning calorimetry (DSC) at a heating rate of 10 C min-1 under argon atmosphere, using a TA Instruments Inc. (MDSC 2920 CE) equipment.
AFM experiments were carried out in air with a standard Nanoscope III AFM (Digital Instruments, Santa Barbara, USA) operated in the contact mode. Cantilevers with tips of about 5-30 nm curvature radius were employed.
The electrochemical studies were carried out in aqueous 2 M HCl solution, as corrosive environment, prepared from suprapure chemicals and triply distilled water. These experiments were performed in a conventional three-electrode glass cell using the alloy ribbons as working electrodes, with an exposed area of 1.5 cm2. A platinum foil and a saturated calomel electrode (SCE) were used as counter- and reference electrodes respectively. All the potentials in the text are quoted against the SCE. The potentiodynamic results were obtained at room temperature with a constant sweep rate |dE/dt| = 1 mV s-1. The surface state after the electrochemical experiments was analized using a Jeol JSM-35CF scanning electron microscope (SEM).
III. RESULTS AND DISCUSSION
A. Thermal Behaviour and Annealing Treatment
Figure 1 shows the DSC curve of the as-quenched amorphous ribbon of F-Cr4 nominal composition. In the temperature range analyzed, crystallization occurs in two exothermic events, the first one (525 £ T/C £ 630) corresponding to the nanocrystallization process with the formation of the a -Fe(Si) phase, and the second one (T ³ 670 C) corresponding to the formation of boride type phases (Yoshisawa, 1999). Figure 1 also shows DSC curves referred to samples with a previous annealing in a furnace at T = 525 C. This temperature corresponds to the onset of the nanocrystallization process. The area under the peak is a measure of the enthalpy of crystallization and is expected to be proportional to the volume of the remaining amorphous phase present in the sample after the thermal treatment, which is transformed to a -Fe(Si) during the DSC experiment. As seen in Fig. 1, the area under the first peak decreases with increasing pre-annealing time at 525 C, which means that more nanocrystalline phase appears during the annealing. The transformation fractions of the first stage of crystallization, x, are also quoted in Fig. 1.
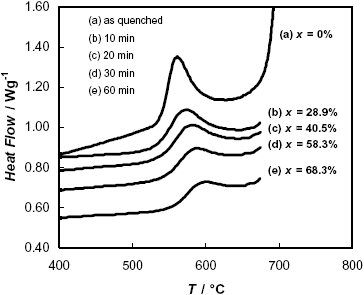
Fig. 1: DSC curves obtained during continuous heating of the F-Cr4 alloy, a) in the as quenched state, b-e) after different times of annealing at 525 C. The corresponding fractions of transformation, x, are also indicated.
On the other hand, samples annealed at 600 C during different times practically have not shown the DSC peak corresponding to the first stage of nanocrystallization, which denotes that the process connected with the formation of the a -Fe(Si) phase is almost complete after annealing at this temperature.
B. AFM Experiments
The capability of the AFM technique to provide three-dimensional surface topographic images at a nanometer level of these nanocrystallized alloys has been demonstrated in a previous work (Salinas et al., 2000).
Figure 2.a shows an AFM image of a F-Cr4 alloy sample as quenched. The surface morphology is found to be very smooth and no special morphological features are observed.
In contrast, the topography of a sample annealed at the onset of crystallization (525 C) during 30 min, presents hemispherical features related to the initiation of the nanocrystallization phenomenon (Fig. 2.b). These hemispherical features appear uniformly distributed with a size distribution of 15-30 nm and can be interpreted as a -Fe(Si) nanocrystallites embedded in the amorphous residual matrix. It is important to remark that the nanocrystals would be completed covered by the residual amorphous matrix. Consequently, the AFM images not really show the nanograins, but the amorphous matrix in which they are included.
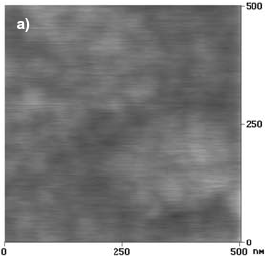
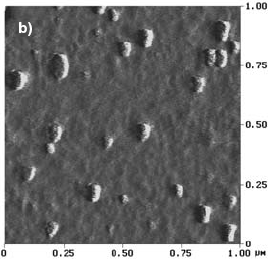
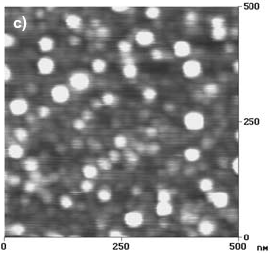
Fig. 2: AFM images of F-Cr4 samples, a) as quenched, b) annealed at 525 C (onset of nanocrystallization) for 30 min, c) annealed at 600 C for 5 min.
At longer annealing times at 525 C, the AFM images have clearly shown that the number of surface features related to the formation of nanocrystallites increases, in good agreement with the DSC experiments.
Taking into account the DSC experiments, the nanocrystallization process is practically completed at 600 C. The surface of a F-Cr4 sample treated at this temperature for 5 min is shown in Fig. 2.c. In this case the nanostructures are practically covering the entire surface of the sample, in concordance with the DSC results.
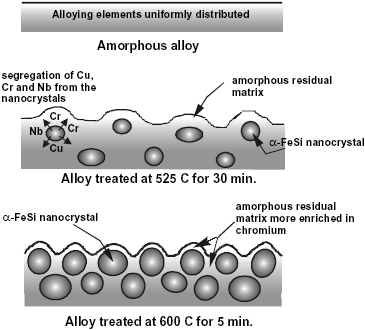
Fig. 3: Schematic illustration of the nanostructure evolution process in the F-Cr4 alloy.
The model proposed for the nanostructure evolution process is illustrated in Fig. 3. The alloying elements in the as quenched amorphous alloy are considered to be uniformly distributed. In contrast, in the samples annealed at 525 C, Cu and Nb are not soluble in the nanocrystals formed, as was indicated previously. Therefore, in this case the amorphous grain boundary phase is more concentrated in those elements than the as-quenched amorphous alloy. Furthermore, the addition of chromium does not produce qualitative changes in the nanocrystallization process, and the nanophase does not depend on the chromium content in the alloy (Conde et al., 1994; Millán et al., 1995). This indicates that chromium is also rejected from the nanocrystals. Consequently, it is possible to infer that the residual amorphous matrix surrounding the a-Fe(Si) nanocrystals is more enriched in chromium as more nanocrystals are formed. Finally, the samples annealed at 600 C exhibit the highest fraction of nanocrystalline phase and, accordingly, the highest concentration of chromium in the amorphous matrix.
As the annealing time at 600 C increases, the number of nanocrystallites have only a slight increase up to 15 min of treatment (Salinas et al., 2000). Longer treatment times result in a growth of the nanograins formed with depletion in their number (Fig. 4). This could be attributed to a competitive grain growth process with a coalescence of them. However, as was previously stated, the amorphous matrix probably acts as a barrier, limiting the nanocrystal growth. One explanation for this apparent discrepancy could be ascribed to the difficulties of AFM to resolve the surface details for these samples. As the size and number of the nanocrystals formed grow, the surface roughness also increases and the size and details of the features could be distorted by the combination of tip and sample geometries (Guckenberger et al., 1992). Owing to the tip finite size, AFM images represent not exactly the shape of the surface itself but a convolution of the surface and tip shapes.
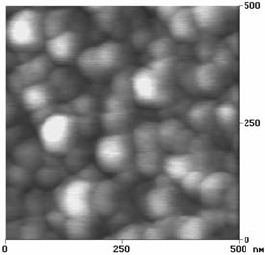
Fig. 4: AFM images of a F-Cr4 sample annealed at 600 C for 60 min.
Considering the results obtained and the radius of the AFM tip used, nanograin sizes of about 10-15 nm could be calculated after mathematical corrections (Bustamante et al., 1992) for the features observed in Fig 2.c. These sizes are close to the values reported for the nanocrystal size ~10 nm (Yoshisawa, 1999).
C. Corrosion Resistance of Nanocrystalline Alloys
The potentiodynamic polarization curve of the as-quenched F-Cr4 amorphous alloys in 2 M HCl solution is presented in Fig. 5.
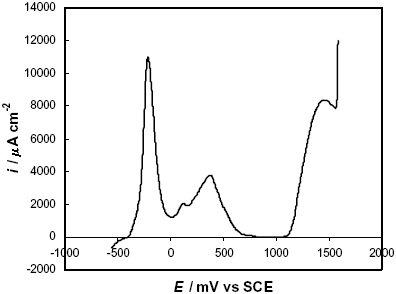
Fig. 5: Potentiodynamic polarization curve in 2 M HCl solution of a F-Cr4 as-quenched sample.
The experimental result shows two anodic processes in the active-passive transition, the first one at –400 £ E/mV £ 0 and the second one at 0 £ E/mV £ 500. After these anodic peaks the alloy reaches a passive state with a passive current density, ipass » 40 m A cm-2. Subsequently, the current density increases at E ³ 1100 mV and this transpassive behaviour is associated with the oxidation of chromium to dichromate anions (Shreir et al., 1994). The current density in the active-passive transition is ~ 11000 m A cm-2. In a previous work (Marzo and Pierna, 1995), the electrochemical behaviour of this alloy was discussed and compared with the FINEMET amorphous alloy without chromium additions. It was concluded that chromium improves the corrosion resistance and the passivation ability of the amorphous alloys by the formation of films with a high concentration of hydrated chromium oxyhydroxide during the active-passive transition.
On the other hand, the alloys treated at the onset of the nanocrystallization exhibited lower current densities in the active-passive transition (Fig. 6) and the passivating ability of the alloys was increased with the annealing time. In addition, the second anodic peak tends to disappear and the passive current densities, also diminishes up to ipass » 3 m A cm-2. These results indicate that a higher corrosion resistance is induced as the number of nanocrystals present in the alloy increases.
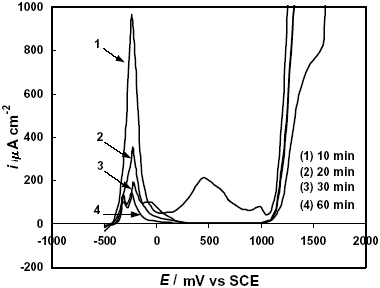
Fig. 6: Potentiodynamic polarization curves in 2 M HCl solution of F-Cr4 samples annealed at 525 C for different times.
In order to clarify the processes involved in the second anodic peak showed in Figs. 5 and 6, the electrochemical results were complemented with scanning electron microscopy images. Figures 7 shows the surface state of a F-Cr4 amorphous alloy sample after a potentiodynamic polarization in 2 M HCl solution. The potential was scanned from the corrosion potential up to E = 300 mV, corresponding to the second anodic peak. The sample was held at this potential value for 30 min, and then, was observed by SEM. The surface has zones with evidence of localized attack. In this case, the alloy could not reach a completely passivated state with the oxide formed and therefore, the second anodic peak is associated with an imperfect passivation state. On the other hand, the same electrochemical experiment was performed on a nanocrystalline sample annealed at 525 C for 60 min. In this case pits or any other type of corrosive attack were not observed (Fig. 8). This result indicates that the oxide formed in the nanocrystalline sample is more protective than the other one formed on the amorphous sample.
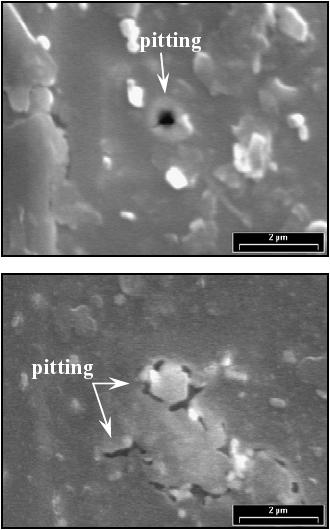
Fig. 7: SEM images of a F-Cr4 amorphous sample after a potentiodynamic polarization from the corrosion potential up to 300 mV in 2 M HCl solution. The potential was held at E = 300 mV for 30 min.
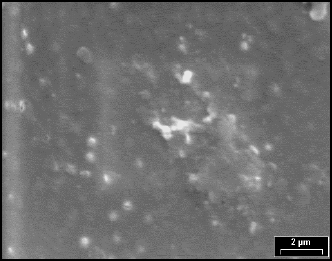
Fig. 8: SEM image of a F-Cr4 sample annealed at 525 C for 60 min, after a potentiodynamic polarization from the corrosion potential up to 300 mV in 2 M HCl solution. The potential was held at E = 300 mV for 30 min.
As was observed by DSC and AFM experiments, the samples treated at 600 C have the highest amount of nanocrystalline phase. In these cases, the polarization curves (Fig. 9) exhibit very low critical current densities with ipass » 1-2 m A cm-2. Nevertheless, as the annealing time at this temperature is increased, the passivating ability of the alloys seems to be slightly reduced. In addition, different anodic peaks appear which can be associated with segregations or transformations not detectable through the DSC or AFM experiments.
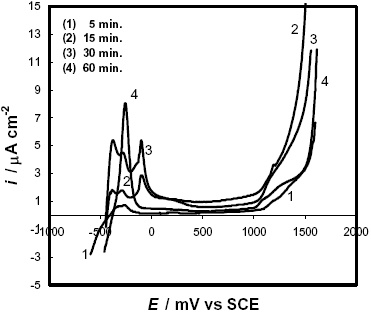
Fig. 9: Potentiodynamic polarization curves in 2 M HCl solution of F-Cr4 samples annealed at 600 C for different times.
The electrochemical results are consistent with the microstructural changes of the samples promoted by the different thermal treatments. As was mentioned, chromium is rejected from the nanocrystals and, consequently, the residual glassy matrix that is embedding the a -Fe(Si) nanograins is enriched in chromium as the nanocrystallization proceeds. This chromium local enrichment facilitates the passivation, lowering both the critical current density in the active-passive transition, and the passive current density. On the basis that the preferential electrochemical dissolution of the nanocrystalline phase in the amorphous matrix is the responsible for the corrosion rate of the alloy (Marzo et al., 1998), the slight increase in the nanocrystallites size for long annealing times at 600 C induces a slight increase in the active-passive peak transition. In this case, it is also possible that the protective chromium-enriched passive film cannot completely cover the surface of the more reactive a -Fe(Si) nanograins any longer, and hence a gradual loss of the passivating ability tends to occur. Obviously, the changes in the alloy local surface composition, which vary depending on the thermal treatment, are responsible for the type and characteristic of the oxide formed. Therefore, it will be necessary to determine, as a function of the thermal treatment, the composition of the oxide by X-ray photoelectron spectroscopy (XPS) and its electrochemical properties by electrochemical impedance spectroscopy (EIS). Additionally, in-situ AFM experiments could give information about the preferential dissolution sites of these alloys. These studies, which will give more information about the passivation mechanism, are now in progress.
IV. CONCLUSIONS
The passivating ability of the Fe69,5Cu1Nb3B9Si13,5Cr4 FINEMET type alloy with different fractions of a -Fe(Si) and amorphous phases was analyzed by DSC, AFM, SEM and conventional electrochemical experiments. The AFM technique was a powerful tool to detect the onset of the crystallization process and to characterize the surface topography of the alloy exposed to the corrosive environment. The results indicate that the nanocrystallization of the alloy produced an improvement in their passivating ability. The current density in the active-passive transition as well as the passive current density have a minimum value when the highest fraction crystallized is reached and the nanocrystallites formed have not started to coalesce. The passivation mechanism was interpreted considering that the nanocrystallization process induce the segregation of chromium to the residual amorphous matrix in which the nanocrystals are embedded. This high chromium concentration localized between the nanocrystals favours the passivation by the formation of films with a high concentration of hydrated chromium oxyhydroxide during the active-passive transition.
Acknowledgements
The authors wish to thank the Universidad Nacional del Sur, Argentina, and the CICYT of the Spanish Government (project MEC-PB97-1119-CO2-02) for financial support of this work.
REFERENCES
1. Bustamante, C., J. Vesenka, C.L. Tang, W. Rees, M. Guthold and R. Keller, "Circular DNA molecules imaged in air by scanning force microscopy", Biochemistry 31, 22-26 (1992). [ Links ]
2. Conde, C.F., M. Millan and A, Conde, "Thermomagnetic study of devitrification in non-crystalline Fe(Cr)SiB-CuNb alloys", J. Magn. Magn. Mater. 21, 314-318 (1994). [ Links ]
3. Guckenberger, R., T. Hartmann, W. Wiegräbe, W. Baumeister "The Scanning Tunneling Microscopy" . In Scanning Tunneling Microscopy II (2nd edn), Wiesendanger R, Güntherodt H-J Eds., Springer, Berlin, 51 (1992). [ Links ]
4. Hampel, G., A. Pundt and J. Hesse, "Crystallization of Fe73.5Cu1Nb3Si13,5B9: structure and kinetics examined by x-ray diffraction and Mössbauer effect spectroscopy", J. Phys. Condens. Matter 4, 3195-3214 (1992). [ Links ]
5. Herzer, G., "Grain size dependence of coercivity and permeability in nanocrystalline ferromagnets", IEEE Trans. Magn. 25, 1397-1402 (1990). [ Links ]
6. Hono, K. and D. H. Ping, "Atom probe study of nanocrystallization of amorphous alloys". Mat. Charact., 44, 203-217 (2000). [ Links ]
7. Millán, M., C. F. Conde and A. Conde, "Microstructural evolution of FINEMET type alloys with chromium: An electron microscopy study", J. Mater. Sci. 30, 3591-3597 (1995). [ Links ]
8. Marzo, F.F. and A. R. Pierna,. "Corrosion behaviour of Fe(73.5-x)Cu1Nb3Si13,5B9Crx(0-5)". In Nanostructured and Non-crystalline Materials, Vázquez M., Hernando A. Eds., World Scientific, River Edge, NJ, 98 (1995). [ Links ]
9. Marzo, F.F., A.R. Pierna, A. Lorenzo, A. Altube, M. Sistiaga, A. Salaverría, A. Fernández Camacho, "Influence of Nanocrystallization in the Electrochemical Behaviour of Fe(73.5-x)Cu1Nb3Si13,5 B9Crx(0-5)", Mater. Sci. Forum, 289-292, 1047-1056 (1998). [ Links ]
10. Pierna, A.R., M. Sistiaga, A. Altube, F. F. Marzo, A. Lorenzo, "Electrochemical oxidation of phenol hydroquinone and benzoquinone at Ni-40Nb-(1-x)Pt-xSn amorphous alloys". Energy and Electrochemical Processing for a Cleaner Environment, Electrochemical Society Proceedings Vol. 97-28, 347-357 (1997). [ Links ]
11. Salinas, D.R., S.G. García, J. B. Bessone and A. R. Pierna, "Nanocrystallization process of the Fe69,5Cu1Nb3B9Si13,5Cr4 FINEMET-type alloy: an AFM study", Surf. Interface Anal., 30, 305-308 (2000). [ Links ]
12. Shreir, L. L., R. A. Jarman and G. T. Burstein, "Corrosion" Vol.1, Metal/Environment Reactions, Butterworths-Heinemann, 3rd Ed (1994) p. 1:106. [ Links ]
13. Sistiaga, M, A. Cuesta, A. R. Pierna, C. Gutiérrez, "Characterization by electrolyte electroreflectance and X-ray photoelectron spectroscopy of amorphous Ni59Nb40Pt1-xSnx alloys and their activation by HF solutions", Surf. Sci., 410, 312-320 (1998). [ Links ]
14. Yoshisawa, Y., S. Oguma, K. Yamauchi, "New Fe-based soft magnetic alloys composed of ultrafine grain structure", J. Appl. Phys., 64, 6044-6046 (1988). [ Links ]
15. Yoshisawa, Y., "Magnetic Properties and Microstructure of Nanocrystalline Fe-Based Alloys", J. Metast. and Nanocryst. Mat., 1, 51-62 (1999). [ Links ]


