Servicios Personalizados
Revista
Articulo
Indicadores
-
 Citado por SciELO
Links relacionados
-
 Similares en
SciELO
Compartir
Latin American applied research
versión impresa ISSN 0327-0793
Lat. Am. appl. res. v.35 n.1 Bahía Blanca ene./mar. 2005
Pore-level modeling of isothermal drying of pore networks. Evaporation and viscous flow
L. A. Segura and P. G. Toledo
Chemical Engineering Department and Surface Analysis Laboratory (ASIF), University of Concepción
PO Box 160-C, Correo 3, Concepción, Chile
petoledo@udec.cl
Abstract ¾ Simulation results of drying of non-hygroscopic liquid-wet rigid porous media are presented. Two and three-dimensional pore networks represent pore spaces. Two kinds of mechanisms are considered: evaporation and hydraulic flow. The process is considered under isothermal condition. Under these conditions capillary forces are dominant over viscous forces; drying is thus considered as a modified form of invasion percolation. Liquid in pore corners allows for hydraulic connection throughout the network at all times. As drying progresses, liquid is replaced by vapor by two fundamental mechanisms: evaporation and pressure-gradient-driven liquid flow. Using Monte Carlo simulation, we find evaporation and drainage times; the shortest calculated indicates the controlling mechanism. Here we report distributions of liquid and vapor as drying time advances. Predictive drying curves and liquid distributions compare well with experimental results for hexane in transparent two-dimensional micromodels. Liquid permeability and vapor diffusivity are reported as functions of liquid saturation.
Keywords ¾ Pore-Level Drying. Drying Front. Network Modeling. Monte Carlo Simulation.
I. INTRODUCTION
A better understanding of drying is essential to delineate optimum processes. Drying is scientifically and technically important. Space limitations prevent us from a complete review of the subject. We limit attention to the main contributions in the area of pore-level modeling. Daian and Saliba (1991) and Nowicki et al. (1992) proposed the first network models to determine macroscopic transport parameters, namely relative permeability of liquid and effective diffusivity of vapor, and their dependency with liquid saturation, distribution of saturation and history of drying. Prat and coworkers, see for instance a recent review by Prat (2000), and Yortsos and coworkers, see for instance Tsimpanogiannis et al. (1999) and Yiotis et al. (2001), studied drying patterns and drying fronts both theoretically and experimentally. Visualization experiments of drying in two-dimensional transparent micromodels are central in identifying pore-level drying mechanisms. Among the first are those of Shaw (1986). Here we present a mechanistic pore-level model of drying incorporating viscous pressure-gradient-driven flow and evaporation in two and three-dimensional pore networks to determine pore-level distribution of gas and liquid, drying curves, permeability of liquid and diffusivity of vapor as function of liquid content. Predictive drying curves and liquid distributions are compared with experimental results for hexane in transparent two-dimensional micromodels.
II. NETWORK MODEL
Porous media are represented by rigid two-dimensional square and three-dimensional cubic networks of prismatic pore bodies connected by narrow pore throats of rectangular cross section circumscribing circles of given radii and depth. Figure 1 displays a typical portion of the pore network and corresponding parameters. Throat radii rt , or equivalently throat section short-side half-lengths, are randomly assigned according to probability density functions f( rt ). Pore throat depth h is constant. Pore-body-center to pore-body-center distance L is chosen constant. Pore throat length Lt is constant and equal to a fraction b of L. Pore body side half length Lb is constant and equal to ((1 - b)L/2); body depth is also constant and equal to the throat depth. Fixing the factor b fixes the porosity of the network once f( rt ) and L are given.

Figure 1. Pore network and parameters.
The network model in Fig. 1 first presented by Prat (1993) captures precisely the topology and statistically the geometry of the pore space of a glass micromodel they used to study drying at the pore level; we use results from these studies to confront our own simulations.
Initially, the network is fully saturated with liquid. Evaporation takes place by allowing the liquid to evaporate into air from an open edge of the network. At the top of this edge a stream of air and evaporating species mixture flows past slowly. The other edges of the network are sealed. Network orientation respect gravity can be adjusted at will. Liquid perfectly wets the solid surfaces and thus the contact angle, measured through the wetting phase, is zero. Menisci movement is considered quasistatic and capillary-controlled. Liquid accumulation in pore corners allows for liquid connectivity throughout the network no matter how high the capillary pressure is.
III. PORE-LEVEL DRYING PHYSICS
The drying front, i.e., the gas-liquid interface, recedes during drying. The process is considered here under isothermal condition; thus mass transfer controls liquid removal. The system is at constant pressure. Drying occurs under no significant external air convection; evaporation rate is thus very low. Under these conditions capillary forces are dominant over viscous forces and the drying is considered as a modified form of invasion percolation. Figure 2 illustrates the various events that occur during drying. The initial position of the gas-liquid interface is labeled 1. As drying proceeds the capillary pressure increases and the liquid contained in the largest pore throat holding gas-liquid interface, and in corners of already dry throats and bodies, recedes towards a totally dry condition, except for liquid wedges in corners. Evaporation drives menisci from their initial flat configuration to configuration 2 such that one meniscus reaches the largest available throat holding gas-liquid interface, at which the pressure is Pc = 2g / rt, rt is the radius of the largest throat and g is the liquid-air surface tension. Pc is defined as Pg - Pl, where Pg is the pressure in the gas phase and Pl is the pressure in the liquid phase. Locally, at the largest throat, as Fig. 2 shows, the meniscus advances smoothly from configuration 2 to configuration 2' at constant capillary pressure until it becomes pinned at the opposite edge of that throat. The equilibrium contact angle criterion, however, given by the Young-Dupré equation, does not apply to edges. If other requirements of stability are met, there is a range of contact angles at which the contact line can meet the throat edge. Here, configuration 2' is considered unstable leading to a Haines jump, a primary trait of fluid interface motion (Haines, 1930). Menisci move rapidly to new equilibrium positions, accompanied by a sudden pressure drop. After the Haines jump, capillary equilibrium is enforced throughout the network and capillary pressure returns to the prejump value, see configuration 3 in Fig. 2. In a Haines jump, either a sudden local evaporation or a viscous pressure-gradient-driven liquid flow removes liquid in single pore bodies or assembly of pore bodies and interconnecting throats. Viscous liquid flow, variously named capillary pumping, wicking and drainage, drives liquid to the surface of the network from where evaporation takes place. Another fundamental event that occurs during drying is fusion of menisci. A throat might hold two back to back menisci. Should capillary pressure rise to the threshold value for that throat, these menisci would coalesce at constant capillary pressure. Evaporation removes liquid in such case. The mechanism prevailing at any given stage of the drying process is always the fastest, either internal evaporation or drainage and surface evaporation combined. Internal evaporation should prevail if the time required to evaporate the liquid transferred in a Haines jump is less than the combined times for drainage and surface evaporation, otherwise drainage should prevail.
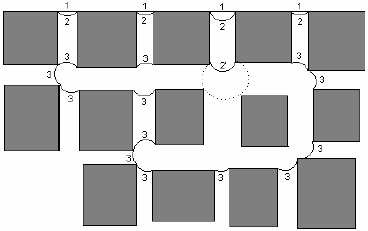
Figure 2. Different events that occur during drying.
When water evaporates from throats and pore bodies, liquid water remains at corners allowing for hydraulic connection throughout the network at all times. Liquid volume is Vl and gas volume is Vg. Pore volume of the network is V(=Vl + Vg). The volume of liquid residing in the corners of a pore segment of square cross section is given simply by (Bustos and Toledo, 2003) Vl = Awl where Aw = 4rw2(1 - p / 4) is cross section area occupied by liquid; rw is radius of curvature of the longitudinal meniscus define as rw = g / Pc, where g is surface tension and Pc is prevailing capillary pressure; l is pore segment length, either throat or body. Liquid saturation is calculated as Sl = Vl / V.
Internal evaporation or drainage of liquid transferred in a Haines jump, or evaporation in a fusion of menisci, involves a time interval that is simply
t = VH / Q, (1)
where VH is the volume transferred. For internal evaporation Q is evaporation rate and for drainage is liquid flow rate. Both flow rates are the result of pore-level flows at the open boundary of the network for drainage or at the gas-liquid interface for evaporation. It is easy to anticipate that drainage occurs at early times of the drying process when a strongly connected network of liquid, composed of liquid-filled pores and thick liquid wedges in largest pores, exists. Later, when the connectivity of the liquid network weakens internal evaporation controls the drying process.
Liquid driven to the surface of the network by capillary pumping evaporates when air passes over the outer surface of the network. The time involved in this process is also given by Eq. (1), with VH the volume transferred and Q defined by Q = kmADp where km is mass transfer coefficient, A is total area of surface menisci, and Dp is difference between saturation pressure, right above the menisci, and partial pressure of the evaporating species in the outer air stream.
A Haines jump is a dynamic event, involving a complex interplay of viscous, inertia and capillary forces in a complex geometrical-topological environment. Determining the precise pressure fields that develop during a jump requires complex three-dimensional fluid dynamics computations. An attractive simplification emerges when analyzing the pressure trace during a jump. Capillary pressure drops suddenly in a jump, a feature we have used to unravel the structure of porous media by volume-controlled mercury porosimetry (Toledo et al., 1994); pressure in the gas phase remains constant however and thus liquid builds up pressure locally. Should a high-enough inner pressure gradient develop; capillary pumping of liquid, instead of internal evaporation, should occur. Our simplification involves letting an unstable meniscus, for instance configuration 2' in Fig. 2, to loose curvature up to a minimum value when the meniscus touches new pore corners, for instance the dashed meniscus in Fig. 2. Stability condition dPc / dVg < 0 is not violated in our approximation although pressure, volume and some other constraints are not rigorously considered. This simplification allows us to estimate local liquid pressure increments, account for capillary pumping of liquid, and restrict attention to the sequence of capillary equilibrium states that precede and succeed these jumps. Fusion of menisci occurs at constant capillary pressure and thus pressure gradient-driven liquid removal is not a possibility, only evaporation.
At some time during the drying process, once the liquid network is unable to support viscous flow, mainly thin pores and wedges compose wetting paths to the outer surface, internal evaporation takes place exclusively. We call this a dry regime. Remaining water may well be considered hydraulically disconnected and thus conforming isolated liquid clusters or islands of one or more pore segments. Experimental observations of the dry regime reveal that islands closer to the outer surface dry first, when gravity is not a factor. Evaporating an island or a fraction of an island requires a time also given by Eq. (1), where VH is liquid volume transferred in the drying event and Q is internal evaporation rate. Evaporation from liquid wedges in pore corners represents the last stage of the drying process.
IV. PORE-LEVEL GAS AND LIQUID CONDUCTANCE
Details of pore space and pore occupancy by gas and liquid are subsumed respectively in pore gas and pore liquid conductances. First, we find pore-level gas and liquid conductances for the various configurations adopted by the two phases. Then we calculate the conductance of the gas and liquid networks. Finally, we find the network diffusivity to vapor and permeability to liquid as a function of the corresponding saturations. Details can be found in Segura and Toledo (2004).
V. GAS AND LIQUID PRESSURE FIELDS
Determination of the mechanism prevailing at any stage of the drying process requires calculation of internal evaporation, drainage, and surface evaporation times which in turn requires calculation of volumetric flow rates. Flow rates require calculation of pressure fields both in the liquid and gas phases. Calculations of pressure fields are carried out at the onset of instability, i.e., at the beginning of a Haines jump. Figure 2 is useful to fix ideas. For the pressure field in the liquid phase, configuration 2 and the dashed meniscus, in the largest available throat, are considered. For the pressure field in the gas phase, configuration 2 is considered.
For any given gas-liquid capillary pressure each phase, gas or liquid, develops its own flow network to which conductance can be assigned in much the same way as for single-phase flow. Several approaches are available for computing pressure fields in either phase once the pore-level saturations are established. Here we use direct solution of nodal material balances for each phase (see for instance Bustos and Toledo, 2003). A nodal material balance for each phase leads to a system of linear equations, G p = b, where G is a matrix of conductances, p is a vector containing the unknown pressures, and b is a vector depending on the pore pressures at the network boundaries and the conductances of the throats connected to these boundaries. Conductance of a pore segment to a given phase is zero when a different fluid phase occupies its pore space. To find the distribution of nodal pressures in each flow network once an external pressure gradient is imposed, we use an iterative solution of the system of equations. The system is optimally stored and solved with successive overrelaxation. This method is part of the ITPACK routine libraries that are publicly available at the web site http://rene.ma.utexas.edu/CNA/ITPACK. The relaxation parameter is chosen as 1.84.
Boundary conditions for the pressure field in the liquid phase are the corresponding liquid pressure behind each meniscus and the liquid pressure behind the unstable meniscus leading to a Haines jump. Boundary conditions for the partial pressure field in the gas phase are the saturation pressure, at the temperature of the system, above each meniscus, and the partial pressure of the evaporating species in the outside air. Meniscus curvature corrections to the saturation pressure are not considered. With the pressure fields in hand, the flow rates of gas and liquid everywhere are determined, the time needed for internal evaporation, drainage, and surface evaporation are calculated, and the prevailing mechanism for liquid removal in a jump selected. Once internal evaporation consistently prevails over drainage, in the dry regime, we use Prat's (1993) approach to continue the drying simulation. In an interesting paper Prat (1993) calculates the evaporation rate of each liquid island, in a fashion identical to that described above, and then using Eq. (1) calculates the time needed to dry the largest available throat, and adjoining body, in the gas-liquid interface delimiting each island. The shortest time indicates the island to dry next. Here we use Prat's (1993) criterion only to select the island to dry. To calculate the drying time we use Eq. (1) with Q the evaporation rate of the island and VH the total volume transferred in the process, which according to capillary principles might correspond to a single pore or an assembly of pores; after all an island should remain in capillary equilibrium.
To avoid network size effects we calculate macroscopic parameters, such as vapor diffusivity and liquid conductivity, on a central section of the network. In these cases we assign fixed pressures to the upper and lower flow boundaries and use a uniformly increasing pressure as an initial guess.
VI. GAS DIFFUSIVITY AND LIQUID
With the nodal pressures of a given flow network in hand, the flow rate everywhere is calculated and the network conductance computed from gj = Qj / (Pin - Pout), where gj is the total flow of phase j throughout the network and Pin - Pout is the pressure difference across the central section of the network.
Fick's first law defines the effective diffusivity of the evaporating species in the gas phase,
 | , (2) |
where Qv is the volumetric flow rate of the evaporating species in the gas phase, M and d are respectively the molecular weight and density of the evaporating species, R is the ideal gas constant, T is the temperature, (Dí¯p / L)v is the pressure gradient on vapor in the direction of the main flow, gv is the vapor network conductance, and Dv is the vapor effective diffusivity.
Darcy's law defines the hydraulic conductivity of the liquid,
 | , (3) |
where Ql is the volumetric flow rate of the liquid, ml is the liquid viscosity, A is the cross-sectional area of the P porous medium, (DP / L) is the pressure gradient on the liquid in the direction of the main flow, gl is the network conductance of the liquid, and kl is the effective liquid permeability of the liquid.
VII. RESULTS AND DISCUSSIONS
The mechanistic pore-level model of isothermal drying of rigid pore networks is used here to find pore-level distributions of gas and liquid, drying curves, and corresponding liquid permeability and vapor diffusivity. Networks are disposed horizontally; thus gravity is not a factor. Our simulation results are compared with experimental results of Laurindo and Prat (1998) and, in passing, with simulation results of Laurindo (1996) and Laurindo and Prat (1998). Experimental results are based on drying of transparent two-dimensional micromodels saturated with hexane. Simulations are run at nearly the same ambient conditions as the experiments, i.e. temperature of 293.15 K and atmospheric pressure. Simulations of Laurindo (1996) and Laurindo and Prat (1998) were carried out in computer replicas of the micomodels and so ours. Parameters used in the simulations are given in Table 1.
Table 1. Pore network parameters (after Prat, 1993).

Pore segment radius is randomly assigned according to a truncated log-normal distribution, that is,
 | , (4) |
where parameters d1 and d2 are respectively 0.1 mm and 0.26 mm, minimum and maximum pore throat radii are respectively 0.05 mm and 0.3 mm (Laurindo, 1996). Network parameters and pore size distributions are those of the micromodels. Hexane properties are given in Table 2.
Figure 3 displays drying curves from twodimensional simulations on 100´60-pore networks saturated with hexane. Results are compared with experimental data from a micromodel of the same size (Laurindo, 1996) and simulation results of Laurindo (1996), see also Laurindo and Prat (1998), in the same network. Laurindo (1996) results belong to one realization of the pore size distribution in Eq. (4). Our results correspond to ten realizations of the same pore size distribution. The experimental drying curve has the typical monotonic decreasing form. The lack of a plateau at early times of the drying process is explained by the two-dimensional nature of the micromodel and network replicas.
Table 2. Hexane properties at 293.15 K and atmospheric pressure of 1.013´105 Pa.


Figure 3. Experimental and simulated drying curves in 100´60-pore networks saturated with hexane.
Figure 3 reveals that not enough liquid remains in the narrow outer surface to produce a constant period of drying. The experimental curve suggests two distinct regimes; a fast drying rate period followed by a significantly slower rate period. The arrow in Fig. 3 signals the change of rate in the simulated drying curve. Experimental results in a larger micromodel, as discuss later, strengthen this perception. As others have mentioned (Philip and De Vries, 1957; Luikov, 1966; Nowicki et al., 1992; Shaw, 1986; Laurindo and Prat, 1998; Tsimpanogiannis et al., 1999; Yiotis et al., 2001) the fast rate period is a result of viscous pressure-gradient-driven liquid flow that reaches the surface of the network from where evaporation takes place. The slower rate period is a result of evaporation of liquid islands so poorly connected that are unable to sustain liquid flow. The pore-by-pore evaporation-exclusive drying model results of Laurindo (1996) (see also Laurindo and Prat, 1998) depart significantly from the experimental data as Fig. 3 shows. Complementary experiments carried out by Laurindo and Prat (1998) probe the importance of pressure-gradient driven liquid flow, or capillary pumping, and hydraulic connection through wedges in pore corners. Our model results, which incorporate both capillary pumping and evaporation, precisely capture the trend of the experimental data with no significant or sustained departures. It is important to mention that no special effort has been made to fit the experimental data; the goodness of the fit is thus result of a correct selection of the pore-level drying physics.
Figure 4 shows a comparison of experimental and simulated morphologies of drying fronts, and corresponding saturations, at equivalent drying times. Drying fronts move from the right. Pores filled with hexane vapor are shown in black; regions filled with liquid hexane are shown in white. Upper and lower boundaries are sealed. Left column in Fig. 4 displays a sequence of images from a 100´60-pore micromodel (Laurindo, 1996). Right column in Fig. 4 displays the corresponding sequence obtained with our model in a computer replica of the micromodel that is a 100´60-pore network. The sequence shows that at early stages of the process, when the average velocity of the drying front is high, a roughly compact front forms. As the front velocity slows the size of the front roughness increases and capillary fingers develop. Islands of liquid of various sizes appear. Notable is the compact front that evolves behind the rough front.
Similar analysis has been offered first by Shaw (1986) and Laurindo and Prat (1996, 1998). Important is the striking resemblance of the simulated drying pattern when compared to the experimental pattern at the same drying time. The model also reproduces saturations as Fig. 4 shows. According to the model, the drying pattern at the beginning of the process is determined by capillary pumping, then by interplay between pumping and evaporation, and later, when only islands of liquid remain, by evaporation. The compact front behind the rough is determined almost exclusively by evaporation. Our model successfully captures the physics of the drying process in the micromodel.
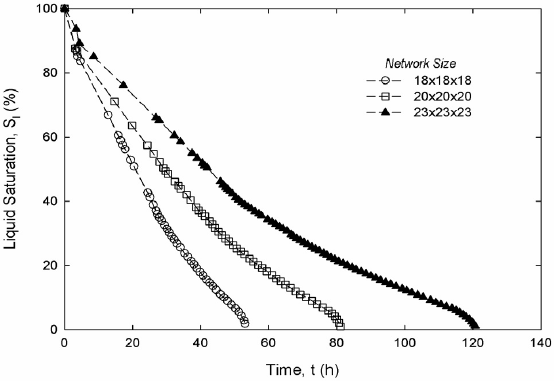
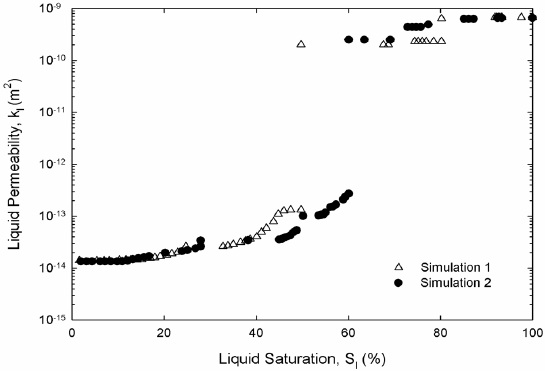
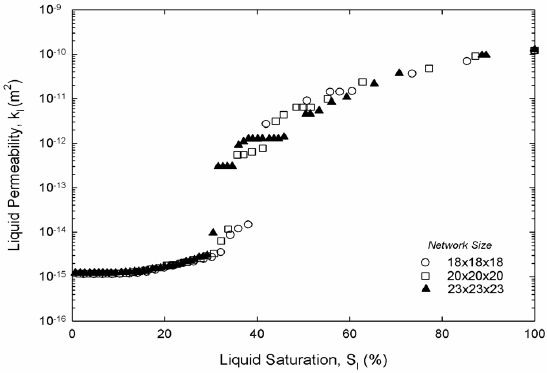
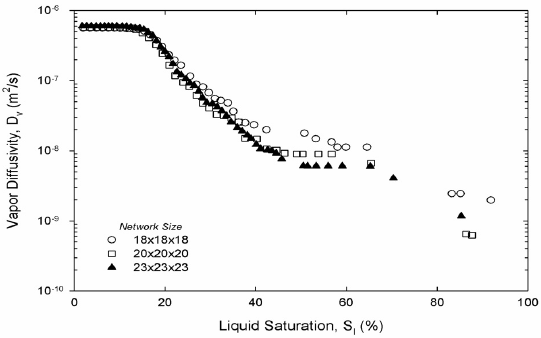
Figure 5 shows calculated drying curves, Fig. 6 liquid hexane permeability and Fig. 7 gas hexane diffusivity. Figures 5a, 6a and 7a display results from two-dimensional simulations of drying on a 140´140-pore network saturated with hexane. Figures 5b, 6b and 7b display preliminary results from three-dimensional simulations of drying for one realization of 18´18´18, 20´20´20 and 23´23´23 networks saturated with hexane. Network size effects in three dimensions markedly affect drying curves but neither permeability nor diffusivity. To be statistically significant, results in Figs. 5-7 should be averaged over several realizations. Current work involves finding optimum size networks to calculate macroscopic parameters. Results for the two-dimensional simulations in Fig. 5a are compared with experimental data from a 140´140-pore micromodel (Laurindo and Prat, 1998) and simulation results of Laurindo and Prat (1998) in the same size network. Results of Laurindo and Prat belong to one realization of the pore size distribution in Eq. (4). Our results correspond to five realizations of the same pore size distribution. The experimental drying curve has the same monotonic decreasing form and, as anticipated, lacks a constant drying period. Again, the experimental curve suggests a fast drying rate period followed by a significantly slower rate period. The arrow in Fig. 5 signals the change of rate in the simulated drying curve. Results for the three-dimensional simulations in Fig. 5b shows a short delay before the fast drying rate period begins. In three dimensions there is a larger outer surface and capillary pumping drives enough liquid to the surface that evaporation from there controls the early stage of the process.
Figure 4. Comparison of experimental and simulated morphologies of hexane drying fronts, and corresponding saturations, at equivalent drying times. Left column displays a sequence of images from a micromodel (Laurindo, 1996). Right column displays the corresponding sequence obtained with our model in a computer replica of the micromodel.

(a)
(b)
Figure 5. Drying curves, two-dimensional (a) and three-dimensional (b) networks.
(a)
(b)
Figure 6. Liquid permeability, two-dimensional (a) and three-dimensional (b) networks.

(a)
(b)
Figure 7. Vapor diffusivity, two-dimensional (a) and three-dimensional (b) networks.
Liquid hexane permeability in Fig. 6 and vapor hexane diffusivity in Fig. 7 from both two and three-dimensional pore networks show expected trends. Permeability is high at high saturations of the liquid phase. Permeability decreases abruptly once mainly small-saturated pores and liquid wedges composed liquid saturation. The inflection point in the permeability marks the point where wedges of liquid control the permeability; at this point the liquid network is unable to sustain significant liquid flow. As expected in three dimensions the inflection occurs at a much lower liquid saturation. According to Fig. 6, hexane diffusivity in two and three dimensions rises abruptly once a cluster of hexane vapor traverses the network for the first time. Then diffusivity increases smoothly as gas saturation increases as Fig. 7 shows. Work on permeability and diffusivity is ongoing to find functional dependencies with liquid saturation.
VIII. CONCLUSIONS
A mechanistic pore-level model of drying incorporating viscous flow and evaporation in two and three-dimensional pore networks is used to determine pore-level distributions of gas and liquid, drying curves, and permeability of liquid and diffusivity of vapor as function of liquid content. Liquid connectivity is always maintained although in cases only through wedges in pore corners. Liquid wedges contribute to both liquid saturation and overall permeability. Simulated drying curves suggest two distinct regimes; a fast drying rate period followed by a significantly slower rate period. The fast rate period is a result of viscous pressure-gradient-driven liquid flow that reaches the surface of the network from where evaporation takes place. The slower rate period is a result of evaporation of liquid islands so poorly connected that are unable to sustain liquid flow. Our results precisely capture the trend of experimental data from two-dimensional micromodels with no significant or sustained departures. Important is the striking resemblance of the simulated drying patterns when compared to the experimental patterns at the same drying time.
ACKNOWLEDGEMENTS
Financial support from CONICYT-Chile through project FONDECYT No. 2990061 and from the Research Direction of U of Concepción through project DIUC 203.096.057-1.0 is greatly appreciated. We also thank Prof. J. B. Laurindo for permission to use the micromodel images in Figure 4. LS thanks U of Bío-Bío for partial financial support.
REFERENCES
1. Bustos, C. and P.G. Toledo, "Pore-level modeling of gas and condensate flow in two- and three-dimensional pore networks. Pore size distribution effects on the relative permeability of gas and condensate", Transport in Porous Media, 53, 281-315 (2003). [ Links ]
2. Daian, J.F. and J. Saliba, "Determination d'un réseau aleatoire de pores pour modéliser la sorption et la migration d'humidité dans un mortier de ciment", Int. J. Heat and Mass Transfer, 34, 2081-2096 (1991). [ Links ]
3. Haines, W.B., "Studies in the physical properties of soil the hysteresis effect in capillary properties and the modes of moisture distribution associated therewith", J. Agricultural Sci., 20, 97-116 (1930). [ Links ]
4. Laurindo, J.B., Evaporation en milieu poreux. Etude expérimentale sur milieux-modèles et modélisation de type percolation, INPT Thesis, Toulouse, France (1996). [ Links ]
5. Laurindo, J.B. and M. Prat, "Numerical and experimental network study of evaporation in capillary porous media. Phase distributions", Chem. Eng. Sci., 51, 5171-5185 (1996). [ Links ]
6. Laurindo, J.B. and M. Prat, "Numerical and experimental network study of evaporation in capillary porous media. Drying rates", Chem. Eng. Sci., 53, 2257-2269 (1998). [ Links ]
7. Luikov, A.V., Heat and mass transfer in capillary-porous bodies, Pergamon Press, Oxford (1966). [ Links ]
8. Nowicki, S.C., H.T. Davis and L.E. Scriven, "Microscopic determination of transport parameters in drying porous media", Drying Technology, 10, 926-946 (1992). [ Links ]
9. Philips, J.R. and D.A. De Vries, "Moisture movement in porous materials under temperature gradients", Transactions American Geophysical Union, 33, 222-231 (1957). [ Links ]
10. Prat, M., "Percolation model of drying under isothermal conditions in porous media", Int. J. Multiphase Flow, 19, 691-704 (1993). [ Links ]
11. Prat, M., "Recent advances in pore-scale models for drying of porous media", Proceedings of the 12th International Drying Symposium, Noordwijkerhout, Netherlands (2000). [ Links ]
12. Segura, L. and P.G. Toledo, "Pore level modeling of isothermal drying of pore networks. Effects of gravity and pore shape and size distributions on saturation and transport parameters", Chem. Eng. J., submitted (2004). [ Links ]
13. Shaw, T.M., Movement of a drying front in a porous material, Materials Research Society Symposia Proceedings, 73, 215-223 (1986). [ Links ]
14. Toledo, P.G., L.E. Scriven and H.T. Davis, "Pore-space statistics and capillary pressure curves from volume-controlled porosimetry", SPE Formation Evaluation, 9, 46-54 (1994). [ Links ]
15. Tsimpanogiannis I.N., Y.C. Yortsos, S. Poulou, Kanellopoulos and A.K. Stubos, "Scaling theory of drying in porous media", Physical Review E, 59, 4353-4365 (1999). [ Links ]
16. Yiotis A.G., A.K. Stubos, A.G. Boudouvis and Y.C. Yortsos, "A 2-D pore-network model of the drying of single-component liquids in porous media", Advances in Water Resources, 24, 439-460 (2001). [ Links ]


