


Servicios Personalizados
Revista

Articulo
 Inglés (pdf)
 Articulo en XML
 Referencias del artículo
 Enviar articulo por email
Indicadores
-
 Citado por SciELO
Links relacionados
-
 Similares en
SciELO
Similares en
SciELO
Compartir

 Permalink
Latin American applied research
versión impresa ISSN 0327-0793
Lat. Am. appl. res. v.35 n.2 Bahía Blanca abr./jun. 2005
Reduced complexity maximum likelihood sequence estimator for high-speed fiber optic communication systems
H. S. Carrer1, D. E. Crivelli2 and M. R. Hueda3
Laboratorio de Comunicaciones Digitales - Universidad Nacional de Córdoba
Av. Dr. Vélez Sarsfield 1611 - X5016CGA - Córdoba - Argentina
Tel./Fax: 54-0351-4334147+105 http://lcd.efn.uncor.edu
1 hscarrer@com.uncor.edu,
2 dcrivelli@com.uncor.edu,
3 mhueda@com.uncor.edu
Abstract ¾ In this paper we present a new reduced complexity maximum likelihood sequence detector for intensity modulation / direct detection (IM/DD) fiber optic systems. The proposed detector takes into account the presence of thermal and amplified spontaneous emission (ASE) noise. The results presented here show a negligible performance degradation from the optimum receiver, while implementation complexity is significantly reduced. The mathematical models derived in this paper are attractive for the design and analysis of very high speed optical receivers.
Keywords ¾ Fiber Optics. Maximum Likelihood Estimation. Optical Amplifiers. ASE Noise. Statistical Model.
I. INTRODUCTION
Long haul high-speed optical fiber transmission systems suffer from impairments such as chromatic dispersion (CD), polarization mode dispersion (PMD), and the amplified spontaneous emission (ASE) noise introduced by optical amplifiers. In intensity modulation/direct detection (IM/DD) schemes, fiber dispersion combined with the square-law response of the photodetector gives rise to nonlinear intersymbol interference (ISI). Additionally, after the photodetector, ASE noise becomes nongaussian and signal-dependent. Recently, there has been a great deal of interest in using digital equalization to compensate the dispersion of optical channels (Sauer-Greff et at., 2003; Agazzi et at., 2004; Agazzi and Gopinathan, 2004). It has been shown in (Agazzi and Gopinathan, 2004) that feed forward equalization (FFE) and decision feedback equalization (DFE) are severely degraded in the presence of nonlinearity, whereas equalization based on maximum likelihood sequence estimation (MLSE) is not. MLSE-based receivers for optical channels have already been reported in (Haunstein et al., 2001; Sauer-Greff et al. 2003; Agazzi et al., 2004). Unlike in traditional dispersive linear channels with additive white Gaussian noise (AWGN), in IM/DD optical channels ISI is nonlinear and noise is nongaussian and signal-dependent (Agazzi et al., 2004).
MLSE can be efficiently implemented by using the Viterbi algorithm (VA). To detect the transmitted data sequence, VA evaluates metrics based on the probability density function (pdf) of the received signal. In (Marcuse,1990; Marcuse, 1991) a detailed analysis of the signal on a fiber optic system affected by ASE noise (owing to the transmitter laser and the optical amplifiers) and by thermal noise (caused by the electronics of the receiver) was presented. However, the proposed mathematical models are not attractive for implementation of MLSE based receivers due to the high number of numerical calculations needed for metric calculation. This seriously limits the implementation of MLSE receivers for optical communications on integrated circuits.
In this paper we introduce a new reduced complexity MLSE based receiver for IM/DD optical channels. This receiver is based on a simplified statistical model of the received signal. The obtained results show a minimal performance degradation with respect to the optimal receiver, while the numerical complexity is reduced by nearly 50%. Furthermore, the models developed in this work can be used not only for the practical implementation, but also for performance analysis of MLSE based detectors in IM/DD optical channels (Crivelli et al., 2003). The paper is organized as follows. In Section II we present the system model. In Section III we introduce the simplified statistical model for ASE noise. Based on this model, in Section IV we propose the new receiver for transmissions affected by thermal and optical noise. In Section V we show numerical results. Finally, in Section VI we draw the conclusions of this work.
II. SYSTEM MODEL
The system model to be used throughout the rest of the paper is described below. It is a single mode fiber link with optical amplifiers deployed periodically to compensate for fiber attenuation. In Fig. 1 a block diagram of the system is shown. There is an optical filter at the receiver input (the filter bandwidth is Bopt = M/T, where 1/T is the symbol rate and M is an integer), followed by a p-i-n photodiode. The output signal of the photodetector is then integrated over a bit period T and thermal noise (modeled as additive white Gaussian noise) generated by the receiver electronic is added. For simplicity, in the following analysis dispersion and nonlinear effects will not be considered. The only noise sources considered in this paper are the receiver electronic, the optical amplifiers, and the transmitter laser. These last two devices usually emit photons in a spontaneous manner, these photons are transmitted and amplified along the link together with the information signal. This noise is known as Amplified Spontaneous Emission (ASE) noise, and is modeled as Gaussian noise at the photodetector input (Marcuse, 1990).
III. ANALYSIS OF THE RECEIVED SIGNAL IN THE PRESENCE OF ASE NOISE
The current at the output of the photodetector is proportional to the square of the absolute value of the electrical field at its input. For the case of ASE noise only this current can be expressed as:
I(t) = K|E(t) + esp(t)|2, (1)
where, E(t) is the electrical field due to the transmitted binary symbol, esp(t) is the ASE noise at the output of the optical filter, and K is a proportionality constant dependent on the photodetector. The signal at the output of the integrator is given by
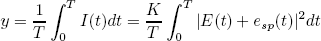 | . (2) |
In (Marcuse, 1990) the exact statistic of the signal given by (2) was obtained. A simplified expression of the pdf of (2) conditioned to the transmitted symbol

Figure 1: Block diagram of the optical link.
is proposed, this is,
 | (3) |
where, Isp is the mean value of optical noise generated current. Is is the mean current generated by each transmitted symbol of a binary constellation (s Î {1, 0}).
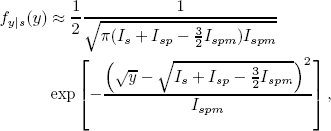
In this paper we propose a new expression (from now on ASE model) for the pdf of (2) conditioned to the transmitted symbol. In the Appendix we show that
 | (4) |
where Ispm  Isp/M. It is important to note that this new expression (4) is simpler to evaluate than Marcuse's approximate expression given by (3). This advantage can be easily observed by comparing the metric calculation for a Viterbi algorithm based equalizer by the two models (3) and (4). Note also that the accuracy of (3) is seriously degraded for values of the received signal close to Isp.
In Fig. 2 we compare bit error rate (BER) plots obtained form the exact model (Marcuse, 1990), and the ASE model. The procedure followed to obtain the BER with the ASE model is described below. Given a specific value of signal to optical noise ratio,
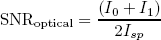 | , (5) |
the decision threshold yd is obtained as the signal level where both pdfs fy|0(y) and fy|1(y) cross each other. Assuming that the binary symbols have the same probability of being transmitted, the BER can be obtained as
 | , (6) |
where
with Mx|s(x) equal to the exact pdf conditioned to the transmitted symbol, given by (13) and (A3) in (Marcuse, 1990). The results above show the excellent precision of the ASE model. Taking into account the lower numerical complexity of this model, its advantage over previous proposals is clear.
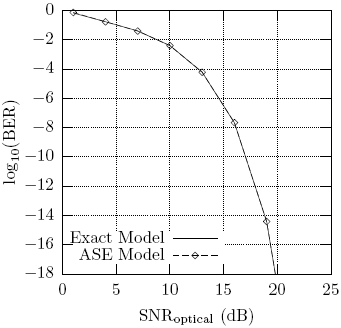
Figure 2: Exact Bit Error Rate and the Bit Error Rate obtained from ASE model.
IV. REDUCED COMPLEXITY MLSE
In this section we take into account the presence of thermal noise introduced by the receiver electronics (see Fig. 1). The pdf of this noise is Gaussian with zero mean. Then the signal z at the output of the adder is given by,
z = y + nt, (7)
 | , (8) |
where, It is the thermal noise generated current (note that nt is also Gaussian). Expression (7) can be rewritten in the following manner:
z = Is + nsp + nt, (9)
where, nsp is the optical noise term with mean value Isp. In Marcuse, (1991) an iterative method to obtain the pdf of (9) from its characteristic function was presented. In this section we present an alternative method with lower numerical complexity.
The analysis begins with the proposed model for the optical noise only case and with the thermal noise statistic:
 | (10) |
 | , (11) |
where
fy|s(y) = pdf of the optical signal (signal+optical noise) conditioned to the transmitted symbol;
fnt(nt) = pdf of the thermal noise;

Figure 3: Comparison between the pdfs conditioned to Is = I1 for the different models. SNRthermal = 20 dB. SNRoptical = 20 dB. The inset shows a zoom of the mean area.
Ks = Is + Isp -  Ispm;
Ispm;
s2 = thermal noise variance.
Given that the random variables nt (thermal noise) and y (signal + optical noise) are independent, it can be shown that the probability density function of their sum (conditioned to the transmitted symbol) is given by the convolution of their respective pdfs (Papoulis, 1991), this is:
 | (12) |
where Å denotes convolution.
In order to obtain the pdf of z it is necessary to solve the integral in (12), which can be written as
 | , (13) |
where
 | . (14) |
The integral (13) can be approximated by
 | , (15) |
where x is such that
 | . (16) |
In order to obtain xr it is necessary to find the maximum of -g(x), or equivalently the minimum of g(x).

Figure 4: g(x) terms and their derivatives.
This can be done by finding its first derivative, given by
 | . (17) |
Note that the first derivative of (17) is always positive, therefore g'(x) has only one real root. This way the maximum likelihood criterion (which tries to maximize (12)) is equivalent to maximize the following function:
 | , (18) |
where (15) was replaced in (12) and the constant terms were removed. The metric used by the Viterbi algorithm (MLSE receiver) is therefore minus the logarithm of (18):
 | . (19) |
In order to show the accuracy of expression (18), in Fig. 3 we show plots of the exact pdf and of the pdf obtained form our model for SNRoptical=20 dB and SNRthermal=20 dB (with  ). It must be noted that in order to make a correct comparison between the exact pdf and the pdf obtained from our model Ec.(18) must be multiplied by a factor C in order to normalize its area to one. Clearly, the results obtained with our model fit perfectly to the exact values. It is interesting to note that in a practical implementation the parameters Ispm, Ks, σ, etc. can be easily obtained from the received signal using the method of moments (Agazzi et at., 2004).
A. Numerical Root Calculation
The method applied to calculate the roots of (17), takes into account the fact that this function is the sum of a linear term an a nonlinear one. Each of these terms is shown in Fig. 4 (lines a' and b'), also included are both components of (14) (a and b) (note that a' (b') is the derivative of a (b)).

Figure 5: Approximation of the derivative of g(x) in the vicinity of the root.
In Fig. 4 we also show the sum of both derivatives (a' + b') whose root we are looking for. The proposed method approximates g'(x) (a' + b' in Fig. 4) by means of a linear function in the vicinity of the root. This is achieved replacing the nonlinear term of (17) a' by a tangent line in the vicinity of the root of g'(x) as can be seen in Fig. 5 ( ). To obtain the approximation of g'(x) is added to b'. This way the proposed iterative algorithm for the search of the root corresponding to zk results in:
 | , (20) |
where,
 | , (21) |
 | , (22) |
 | , (23) |
 | . (24) |
If we take into account that g'(x) is a function with continuous always-positive slope, the convergence of the algorithm is guaranteed for every point, except those where the zero crossing of the tangent line to a' is a negative value (square root of a negative number). This problem can be solved by forcing the value of  to zero.
The speed of convergence of this method is dependent on the choice of the initial value for  for each root that needs to be obtained. If we assume an initial sweep of values of z for which we want to find the roots (as could happen on a practical implementation), a good choice for the initial value is the previously found root:
 . (25)

Figure 6: Bit error rate as a function of SNRoptical, with SNRthermal = 20 dB. M = 3.
This way the problem reduces to find for the first value of z ((z0)). In this work we propose (z0) = Ks. For this choice we considered that the algorithm could be in one of three operating modes:
1. Dominant optical noise
2. Dominant thermal noise
3. None of the noise sources is dominant
In mode (1) optical noise is dominant, therefore the linear term of g'(x) is dominant (see (17)) given that the nonlinear term is very small and has no influence on the root calculation. From this we see that the rate of convergence will be independent of the starting value of (z0). In mode (2) thermal noise is dominant, therefore the root of g'(x) is approximately Ks (see (17)) and choosing this very point as the initial value gives a quick convergence. In mode (3) the root will be between z and Ks. It was numerically verified that choosing Ks as the starting point produces good results.
A possible termination criterion is based on comparing  with the numerical resolution used. This seems logical if we consider that the commonly used numerical resolution for fiber optic systems is 6 bits. Furthermore, it was observed in different simulation runs that setting the iteration number to 3 gives sufficiently accurate results, while using the approximation developed in (Marcuse, 1991) it is necessary an average of 15 iterations to obtain the same accuracy. Also if we consider that the model presented here requires1 50% less product operations, 65% less add operations and 40% less division operations for each value of z, the numerical advantages of the new detector are clear.

Figure 7: BER plots as a function of SNRthermal, with SNRoptical = 15 dB. M = 3.
V. NUMERICAL RESULTS
In Fig. 6 we show BER plots as a function of SNRoptical for SNRthermal = 20 dB and an extinction ratio of 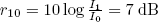 . In this figure we present results obtained with the exact model (Marcuse, 1991) and with our model. The excellent accuracy of the latter can be observed.
In Fig. 7 we show plots of BER as a function of SNRthermal for SNRoptical = 15 dB and r10 = 7 dB. Again we see the accurate performance of our model. From these results we see that the proposed receiver achieves a minimal performance degradation compared to the optimal receiver, and 50% less numerical computation than an MLSE receiver based on the approximation introduced in (Marcuse, 1991).
VI. CONCLUSIONS
In this paper we presented a new simplified expression for the pdf of the received signal in a direct detection fiber optic system with dominant optical noise (Agrawal, 1997; Ramaswami and Sivarajan, 2002). The proposed model shows an excellent accuracy and is oriented towards a reduction in the practical implementation complexity of the receiver for high-speed transmissions.
As a second contribution of this work, we presented a reduced-complexity MLSE-based receiver for transmissions in presence of optical and thermal noise (the latter being originated by the receiver electronics). The results presented in this paper show the excellent performance achieved by the new detector and also show a significant numerical complexity reduction.
The importance of the mathematical complexity reduction is clear when considering the high transmission rates proposed for future fiber optic systems (i.e. 40Gbps (OC-768)), where serious performance limiters such as chromatic dispersion and fiber nonlinearities, force the implementation of more elaborate detectors (i.e. detectors based on the Viterbi algorithm).
Finally it is important to realize that the models presented in this paper can be used in more advanced receivers such as turbo equalizers.
APPENDIX
In this Appendix we derive approximation (4). Toward this end, we use the approximation for the pdf of the received signal in the presence of ASE noise reported in (Marcuse, 1990):
 | , (26) |
where  . Assuming that r01 > 0 and the power of the optical noise is sufficiently small (i.e.,
  ), we can verify that Pr{|y - Is - Isp| < ξ} ® 1 with ξ > 0 and ξ ® 0, therefore
 | (27) |
Using (27) in (26), and considering that exp  , we obtain
 | (28) |
The mean value obtained from this last expression ( ) is different from the exact value (Is + Isp) (Marcuse, 1990). Based on this observation, from (28) it is simple to derive
 | (29) |
which is approximation (4). When the SNR optical is high enough, it can be shown that the variance derived from (4) ( ) tends to the exact value given by 2Ispm(Is + Isp) (Marcuse, 1990). Numerical results (not included in this paper) show the excellent accuracy of (4) for all the cases of practical interest (e.g.,
  (van Etten and van der Platts, 1991), SNRoptical >3dB).
1 Taking into account the polynomial expansion of square root and natural logarithm operations (Analog Devices, DSP Division, 1992))
REFERENCES
1. Agazzi, O. E., D. E. Crivelli, and H. S. Carrer, "Maximum likelihood sequence estimation in the presence of chromatic and polarization mode dispersion in intensity modulation/direct detection optical channels", in IEEE Proc. of the International Conference on Communications (ICC), 5, 2787-2793,(2003). [ Links ]
2. Agazzi, O. E. and V. Gopinathan, "The impact of non-linearity on electronic dispersion compensation of optical channels", in Proc. of the Optical Fiber Communication Conference and Exhibit (OFC), (2004). [ Links ]
3. Agrawal, G. P., Fiber-Optic Communication Systems. Wiley-Interscience, (1997). [ Links ]
4. Crivelli, D. E., H. S. Carrer, and M. R. Hueda, "Detector de secuencia para sistemas de comunicación por fibra Óptica en presencia de dispersión y ruido de emisión espontánea", Xo RPIC (Reunión de Procesamiento de la Información y Control), (2003). [ Links ]
5. van Etten W. and J. van der Plaats, Fundamentals of Optical Fiber Communications. Prentice Hall, (1991). [ Links ]
6. Haunstein, H. F., K. Sticht, A. Dittrich, W. Sauer-Greff, and R. Urbansky, "Design of near optimum electrical equalizers for optical transmission in the presence of PMD", in Proc. of the Optical Fiber Communication Conference and Exhibit (OFC), 3, 558-560, (2001). [ Links ]
7. Marcuse, D., "Derivation of analytical expressions for the bit-error probability in lightwave systems with optical amplifiers", J. Lightwave Technol., 8, 1816-1823, (1990). [ Links ]
8. Marcuse, D., "Calculation of bit-error probability for a lightwave system with optical amplifiers and post-detection Gaussian noise", J. Lightwave Technol., 9, 505-513, (1991). [ Links ]
9. Papoulis, A., Probability, Random Variables, and Stochastic Processes. McGraw-Hill, third ed., (1991). [ Links ]
10. Ramaswami R. and K. Sivarajan, Optical Networks: a Practical Perspective. Morgan Kaufmann, (2002). [ Links ]
11. Sauer-Greff, W., A. Dittrich, R. Urbansky, and H. Haunstein, "Maximum-likelihood sequence estimation in nonlinear optical transmission systems", Lasers and Electro-Optics Society (LEOS 2003). The 16th Annual Meeting of the IEEE, 1, 167-168, (2003). [ Links ]
12. The Applications Engineering Staff Analog Devices DSP Division, Digital Signal Processing Applications. Prentice Hall, (1992). [ Links ]

