


Serviços Personalizados
Journal

Artigo
 Inglês (pdf)
 Artigo em XML
 Referências do artigo
 Enviar este artigo por email
Indicadores
-
 Citado por SciELO
Links relacionados
-
 Similares em
SciELO
Similares em
SciELO
Compartilhar

 Permalink
Latin American applied research
versão impressa ISSN 0327-0793
Lat. Am. appl. res. v.37 n.4 Bahía Blanca out. 2007
Anaerobic digestion of carbohydrate and protein-based wastewaters in fluidized bed bioreactors
M. Fuentes1, N. J. Scenna2, P. A. Aguirre3 and M. C. Mussati4
INGAR - Instituto de Desarrollo y Diseño-(CONICET-UTN), Avellaneda 3657, (3000) Santa Fe, Argentina
{1mfuentes; 2nscenna; 3paguir; 4mmussati}@ceride.gov.ar
Abstract — The present work is focused on evaluating the anaerobic digestion of complex substrates (proteins and carbohydrates) in anaerobic fluidized bed reactors (AFBRs). In a previous paper, an AFBR model was adjusted using only the experimental data obtained during the acclimatization stage (glucose and acetate-based feeding) of two mesophilic bioreactors. Here, the sensitivity of that model to represent the digestion processes of proteins such as gelatin and albumin, and sucrose as a carbohydrate, is analyzed. Some kinetic expressions and parameters for the enzymatic hydrolysis processes need to be modified to represent the real behavior of bioreactors. Under the analyzed operating conditions, a hydraulic retention time higher than 1 day is suggested to ensure good system efficiency.
Keywords — Anaerobic Processes. Biofilms. Complex Substrates. Dynamic Modeling. Fluidized Bed Bioreactor. Wastewater Treatment.
I. INTRODUCTION
Most full-scale anaerobic reactors have been designed for treating wastewaters from the sugar, starch and brewery industries, where carbohydrates are the main pollutants (Fang and Yu, 2002). However, many industrial and agricultural wastewaters contain also a significant fraction of proteins, which are the main compounds responsible for the residual chemical oxygen demand (COD) in the effluent of anaerobic reactors processing domestic sewage.
Few studies have been carried out on how the use of multiple and complex substrates affects the degradation processes in a mixed anaerobic community developed inside a fluidized bed reactor (Borja et al., 2004; Tsuneda et al., 2002). At industrial scale, there is generally a pre-acidification tank where the complex organic matter is degraded into organic acids. Since the acidogenic reaction is usually rapid, this acidification tank is relatively small (hydraulic retention time HRT of 4 to 6 hours), which usually corresponds to an existing buffer tank.
Fluidized bed is one of the most widely used high-rate systems for the treatment of dissolved organic matter. This reactor type retains high attached biomass concentration on an inert support material, presents smaller pressure drop than fixed bed systems, shows no bed-clogging problems, demands small reactor volume and determines low external mass transport resistance when compared to other reactor configurations. However, some practical aspects need to be addressed. Due to the slow growth rate of the anaerobic consortium compared to the aerobic growth, anaerobic systems require long periods for starting up and recovering an efficient operation regimen after a sudden change of the organic load due to a perturbation of either the inlet flow rate or contaminant concentration. When the disturbance is on the inlet flow rate, the system hydrodynamics is significantly affected; whereas when a disturbance on the influent organic concentration occurs, the biological process rates govern the transient behavior of the system. However, the biological process rates affect the system hydrodynamics since variations on the biofilm concentration modifies the density of the support particles and, consequently, their fluidization characteristics. Therefore, an anaerobic fluidized bed reactor (AFBR) model is intended through its four major modeling tasks: (1) the anaerobic digestion model, (2) the biofilm model, (3) the bioparticle model, and finally (4) the hydrodynamic model.
In a previous paper (Fuentes et al., 2007), the specific biofilm detachment rate coefficient (kE) was estimated by adjustment of an AFBR model based on the anaerobic digestion model proposed by Angelidaki et al. (1999) (Fig. 1). The experimental data obtained from two mesophilic (36±1ºC) lab-scale AFBRs during the acclimatization stage (glucose and acetate-based feeding) were used. That paper was oriented to bioreactor modeling focused on hydrodynamics and parameter estimation. Afterwards, the experimental work was continued using the same experimental setup but adding complex substrates, such as proteins and carbohydrates, to bioreactor feeding. The present work is mainly focused on evaluating the model sensitivity for representing the experimental behavior when complex substrates are digested in AFB reactors.

Fig. 1. Anaerobic degradation steps (Angelidaki et al., 1999): 1) acidogenesis from glycerol combined with lipid (triglyceride) hydrolysis; 2) acidogenesis from sugars (glucose); 3) acidogenesis from amino acids; 4) acetogenesis from LCFA; 5) acetogenesis from butyrate (HBu); 6) acetogenesis from valerate (HVa); 7) acetogenesis from propionate (HPr); 8) acetoclastic methanogenesis.
Proteins such as gelatin and albumin, and sucrose as a carbohydrate, are used. Gelatin and albumin are often present in wastewaters. The former is present in animal connective tissue and is the main constituent of slaughterhouse and meat-processing wastewaters; and the latter is the main proteic component in raw palm oil and some food processing wastes, which have an important polluting effect (Fang and Yu, 2002; Yu and Fang, 2003).
In this context, the paper is organized as follows: in Section 2, main hypotheses and mathematical equations are presented. Characteristics of bioreactors and inert support materials, and the experimental protocol are described in Section 3. The experimental data and simulation results are presented in Section 4. Finally, conclusions are drawn in Section 5.
II. MATHEMATICAL MODEL
Although the mathematical model has been described in the previous paper, following, the main hypotheses and equations are summarized.
Figure 1 represents the degradation steps and microorganism trophic groups assumed in the anaerobic digestion model. A carbohydrate and protein-based composition of biomass is assumed. The model describes the syntropism among acetogens and hydrogenotrophic methanogens by combining stoichiometry of these degradation stages. Its application to a biofilm system requires the modeling of the interaction between suspended and attached biomass (biofilm).
Constant wet biofilm density, homogeneous biofilm distribution on support particles, constant density and diameter of support particles, and spherical geometry are assumed for the bioparticle model.
A heterogeneous and dynamic model of the three-phase system is considered by assuming a totally developed flow condition and a complete mixture behavior for all phases. The solid phase consists of the inert support particles and the (active and non-active) attached biomass. The liquid phase is composed by the chemical species in solution (substrates, intermediates, products, enzymes, ions and water) and (active and non-active) suspended biomass. The gas phase is formed by the gaseous products from degradation stages.
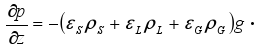
Biochemical transformations are assumed to occur only in the fluidized bed zone but not in the free-support material zone. The generalized bubble and wake model (GBWM) was selected to describe the three-phase system (εL + εS + εG=1) (Bhatia and Epstein, 1974). The simplified wake theory, i.e. the liquid wakes are particle-free (Efremov and Vakhrushev, 1970), is used to calculate the liquid holdup (εL). Table 1 summarizes the mathematical equations to calculate fluidization characteristics, and the mass balance equations for phase components.
Table 1. Mathematical equations to calculate fluidization characteristics and phase component concentrations1. 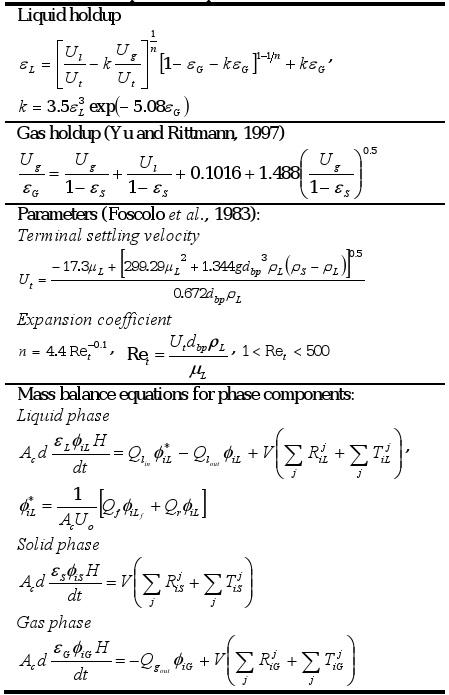
1. A dispersed bubble flow (1×10⁻² <Ul <1 m s-1 and 1×10⁻² <Ug <1×10⁻¹ m s-1) is assumed.
A constant volumetric flow through the fluidized bed is assumed, the velocity in the bed cross section is approximately equal to fluid velocity at the reactor inlet (Uo=Ul+Ug). The generated gas is assumed to be separated from the multiphase stream at the top of the reactor column, and thus, the gas phase flow rate at the reactor inlet is equal to zero. At the reactor outlet the gas superficial velocity is calculated as:

|
(1) |
Since the solid is confined in the control volume, no-flux conditions at the reactor inlet and outlet are assumed.
The height of the fluidized bed is calculated as:

|
(2) |
The terms  and
and  related to mass transfer processes are summarized in Table 2.
Table 2. Homogeneous reaction rates and mass transfer and transport process rates for phase components1. 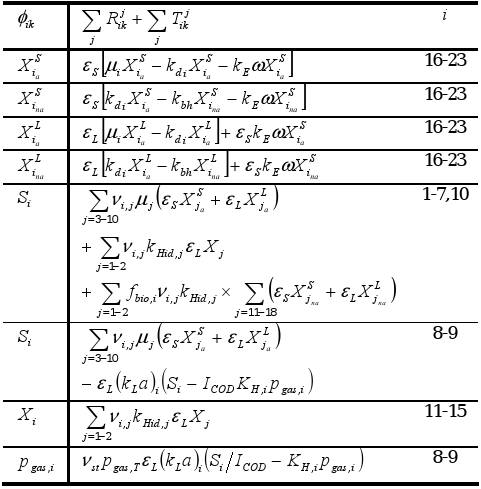
1. See Section Nomenclature for notation.
Specific growth (μ) and death (kd) rates are assumed to be the same for suspended and attached biomass of a species i. In addition, the specific biomass hydrolysis rate (kbh) is the same for all species.
The biofilm process model is coupled to the system hydrodynamic model through the biofilm detachment rate (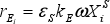 , see Table 2), which is assumed as a first-order function of the energy dissipation parameter ω in the three-phase fluidized zone, which is expressed as (Huang and Wu, 1996):
|
(3) |
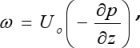
where
|
(4) |
The specific detachment rate kE is assumed to be the same for all biological species and was estimated from experimental data (Fuentes, 2006; Fuentes et al., 2007).
The physico-chemical system, defined as non-biological mediated processes but relating to the biochemical rates, is described through the equilibrium in solution model and liquid-gas mass transfer model.
Equilibrium in solution model includes the system charge balance (electroneutrality condition) for calculating pH. It involves mass balance equations for total concentration of volatile fatty acids (acetic, propionic, butyric and valeric), inorganic carbon, inorganic nitrogen, phosphate, "other anions", and "other cations".
Methane, carbon dioxide and water vapor are considered as gas phase components. The liquid-gas mass transfer is modeled assuming ideal gas behavior, and constant total gas phase pressure. The mass balance for gas phase component i is expressed as a function of its partial pressure pgas,i (Table 2). Water vapor pressure is calculated by an Antoine-type equation.
Biochemical rate equation matrix, kinetic and physico-chemical parameters are described in Fuentes (2006), and are not here included due to space restrictions. Since the original paper, from which degradation model was extracted (Angelidaki et al., 1999), deals with a case study at termophilic operating conditions, kinetic and physico-chemical parameters suggested by Batstone et al. (2002) for mesophilic and high rate operating conditions are used.
III. MATERIALS AND METHODS
A. Bioreactors and inert support materials
Two lab-scale anaerobic fluidized bed reactors were used to carry out the experiments. The same start-up policy was applied to both reactors, using a soluble substrate based on glucose and acetate. Then, the feed composition was varied by adding a mixture of albumin and sucrose in one of the reactors, named RAS, and a mixture of gelatin and sucrose in the other one, named RGS. They were loaded with sand as support material. Both RAS and RGS are columns consisting of a 2.0 m high acrylic cylinder with an inner diameter of 0.065 m. The separation compartment placed over the column is a 0.18 m high cylinder with a 0.145 m inner diameter, where gas accumulation and particle sedimentation take place. The effluent discharge, the feed input and the recycle suction point are also placed in this compartment. The inert support characteristics and bioreactor specifications are included in Table 3.
Table 3. Specification data for bioreactors RAS and RGS, and support materials.
B. Chemicals
Commercial gelatin (PL 20743/03) was kindly supplied by PB Leiner Argentina, member of Tessenderlo Group. Albumin from chicken egg white, Grade II (CAS 9006-59-1) was purchased from Sigma. The acetic acid, glucose, sucrose, sodium bicarbonate, ammonium chloride and other chemical reagents were purchased from Cicarelli, Argentina.
C. Analytical methods
The experimental measured variables were the bed height, total and soluble COD, volatile fatty acid (VFA) concentrations, pH and gas concentration and flow rate.
The amount of biogas produced by the bioreactors was measured using a water replacement method after gas washing using a FeCl3 solution (pH 2) for removing H2S. The gas composition was analyzed by a gas chromatograph (Hewlett Packard 6890) equipped with a thermal conductivity detector and a 3 m carbosphere column. Hydrogen was used as carrier gas at 20mLmin-1. The column was operated at 150°C. The injector and detector temperatures were 100 and 230°C, respectively.
The effluent COD was measured according to the HACH potassium dichromate method approved by USEPA (Cat. 21259-15, 0-1500 ppm). The concentration of the released Cr3+ ions was determined by spectrophotometry (Metrolab 330). Microfilters of PTFE 0.2 μm (F2513-4) for soluble COD determination were used. The effluent pH was measured using a digital pHmeter (Horiba D-12). The acetic, propionic and butyric acid (VFA) concentrations were measured by a high performance liquid chromatograph (HPLC) Hewlett Packard Model Series 1050 equipped with a UV-VIS detector (wavelength: 215 nm). A 20 µL sample volume was injected into a Spherisorb ODS-1 (C18) Classic 5U (250 x 4.6 mm) column (Alltech, Deerfield, IL). The mobile phase consisted of 50% acetonitrile-50% water, sulfuric acid 0.01% (pH 3) at a flow rate of 0.7 mL min-1.
D. Experimental protocol
Fractions of both solid and liquid phases taken from an industrial anaerobic reactor were used as inoculums for reactors RAS and RGS. All step-type disturbances applied to bioreactors during the experimental campaign are depicted in Fig. 2. The start-up policy was the same for both reactors. It involved stepped increases in COD loading rate over a four months period. During this acclimatization stage, the substrate consisted of a mixture of milk powder, acetate and glucose (10%, 20% and 70% of the total COD, respectively) plus 0.1 g L-1 of NH4Cl and 0.66 g L-1 of NaHCO3, in order to provide the inoculums with the micro and macronutrients, and adequate environmental conditions necessary for microbial growth. The operating temperature of the reactors was maintained at 36±1°C. The organic loading rate (OLR) was gradually increased by three step-type disturbances on the inlet substrate concentration (P1-P3), keeping constant the COD percentages of feed composition, and the feed flow rate at 3.2 L d-1. During these steps, the influent COD concentration was increased from 0.85 to 1.75 and from 1.75 to 2.66 g L-1 containing around 2.5% of insoluble substrates mainly composed by milk proteins. The NaHCO3 consumption for pH adjustment was increased, respectively, from 0.66 to 1.50 and from 1.50 to 2.43 g L-1 for both reactors. Finally, two steps in the feed flow rates from 3.2 to 4.3 L d-1 (P4) and from 4.3 to 6.2 L d-1 (P5), keeping the same inlet concentration at 2.66 g COD L-1 for RAS and RGS, were applied.
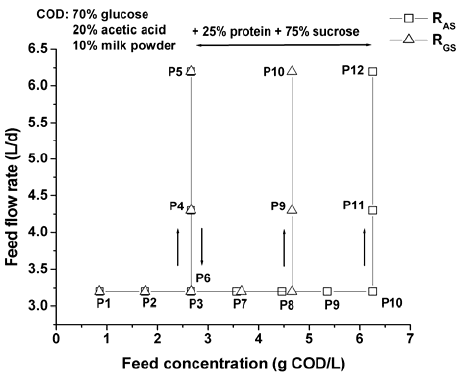
Fig. 2. Step-type disturbances for RAS and RGS.
After acclimatization stage, a feed flow rate of 3.2 L d-1 was recovered (P6). From a glucose and acetate-based feeding of 2.66 g COD L-1, the RAS and RGS feed concentrations were increased gradually by adding of 0.9 and 1 g COD L-1 (0.25% of protein and 0.75% of sucrose), respectively, keeping constant the protein-carbohydrate COD ratio and the feed flow rate. Finally, two steps in the feed flow rates from 3.2 to 4.3 L d-1 and from 4.3 to 6.2 L d-1 were applied, keeping the same inlet concentration at 6.26 and 4.66 g COD L-1, for RAS and RGS, respectively.
IV. RESULTS AND DISCUSSION
The mathematical model was implemented and solved using the process modeling software tool gPROMS (general PROcess Modeling System; Process System Enterprise Ltd., 2004a,b). Since the biofilm adsorption phenomenon is not modeled, low steady state concentration values are assigned as initial condition values for the biological and chemical species. The total CPU time for model simulations is about 0.8 seconds on an 800 MHz Pentium IV PC.
As mentioned, time variation of the experimental and predicted values of total and soluble COD, VFA (as acetate) concentration, pH and biogas (as methane) flow rate during acclimatization stage (disturbances P1-P5), for RAS and RGS, were analyzed in Fuentes et al. (2007). High COD removal efficiency values (85 and 95% of total and soluble COD, respectively) were obtained, and the biogas production rates showed the fastest responses to disturbances, and the system pH was self-regulated at the typical operation range (6.6-7.2) of healthy metha-nogenic digesters for both reactors (see Figs. 6 and 7).
In that paper, assumptions on the hydrodynamic model and biofilm detachment rate model were evaluated. The simplified wake and bubble theory, used to calculate the fluidization characteristics, simulated successfully the main hydrodynamic events that took place in the reactors. Unexpected failures and changes in the operating conditions which caused hydrodynamic disturbances were included in the simulation and parameter estimation schedules. These disturbances occurred at days 38 and 60 for RAS, and days 35 and 150 for RGS. It was concluded that the ω-function assumed for modeling the biofilm detachment rate resulted to be appropriate for representing bioreactor behavior during non-highly disturbed hydrodynamic conditions. The estimated values of the empirical specific biofilm detachment rate coefficient (kE equal to 1.87 × 10⁻¹⁰ and 1.12 × 10⁻¹⁰ m s2 kg-1 for RAS and RGS, respectively) are here used.
Here, the analysis is focused on the second stage of the experimental campaign, i.e. from disturbance P6 when a HRT higher than 1 day is recovered, at a feed flow rate of 3.2 L d-1, for both reactors (see Fig. 2).
As an example, total COD measured and predicted values for reactor RAS are depicted in Fig. 3. The dotted lines indicate the time duration of each disturbance. Simulation A represents results from the original AFBR model, which assumes the hydrolysis rate as a first-order function in the complex substrate concentration and zero-order in the enzyme concentration, inhibited by VFA (as acetate) (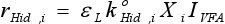 ). As observed, around day 135, when protein (albumin) and carbohydrate (sucrose) are added to bioreactor feeding (P7), simulation results differ from the experimental ones. A successive increase of the particulate material concentration, parallel to the OLR increase, is predicted. It seems to indicate that greater specific hydrolysis rate coefficients are needed to represent the bioreactor behavior.
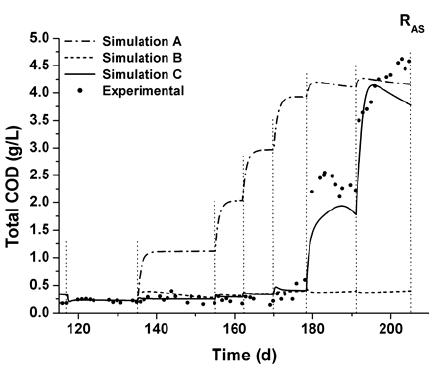
Fig. 3. Total COD experimental and predicted values for RAS during disturbances P6-P12.
A second modeling approach, assuming an instantaneous hydrolysis rate of fed carbohydrate and protein, is represented by Simulation B (Fig. 3). The aim is to identify different hydrolysis kinetics for fed complex substrates and particulate material from non-active biomass decomposition. Therefore, the specific biomass (carbohydrate and protein fractions) hydrolysis rate has been calculated using the same values of the specific hydrolysis rate coefficients as in the original model  .
.
A good agreement between experimental and predicted values from Simulation B is observed up to day 178 (i.e. during disturbances P6-P10). The change in the HRT values (lower than 1 day) due to increases in the feed flow rate from 3.2 to 4.3 L d-1 (P11) and from 4.3 to 6.2 L d-1 (P12) causes a decrease in the COD removal efficiency. It suggests that several processes such as enzyme washout, H2S inhibition and overloading processes could be causing high total COD values.
A hydrolysis rate model of order different to zero with the enzyme concentration is needed to investigate the enzyme washout. In general, the reaction rates of enzymatic hydrolysis are assumed to follow either Michaelis-Menten or first-order kinetics (Souza et al., 2004). Richards (1956), Ottesen (1956), Biszku et al. (1973) and Solti et al. (1975) described the enzymatic proteolysis by the Michaelis-Menten equation, taking into account a pseudo-first order kinetics. Simulation C is based on a Michaelis-Menten kinetics assumed for both carbohydrate and protein hydrolysis (Eq. 5). A VFA non-competitive inhibition function (IVFA) is also considered.

|
i=11,12. (5) |
The enzyme production rate is assumed to be a function of the microorganism growth rate:
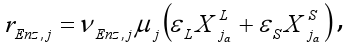
|
j=4,5. (6) |
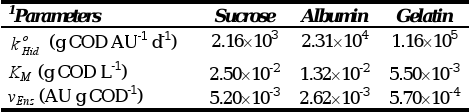
The quantitative calibration of the model parameters is not an easy task with dynamic models in anaerobic digestion due the lack of some measurements, the scarcity and uncertainty of others and the uncertainty related to the process dynamics. Parameters (yield coefficient νEnz, specific hydrolysis rate  , half saturation coefficient KM) used in Eqs. (5) and (6) were obtained from simulation analysis. Magnitude orders of parameters reported by Fuentes et al. (2005) were used as initial values. Table 4 summarizes the calculated values of νEnz, , and KM, from which Simulation C has been obtained.
Table 4. Kinetic parameters of enzymatic hydrolysis model (Eqs. 5 and 6).
1. Enzymatic activity is measured in Anson Unit (AU).
The effects of the change in the HRT during disturbances P11 and P12 for RAS, using parameters presented in Table 4, are drawn in Figs. 4 and 5. The enzymatic hydrolysis rates of sucrose and protein diminish due to washout of enzymes (Fig. 4). Thus, untreated non-soluble and soluble substrates become in the components that mostly contribute to the total measured COD. At this organic loading rate, as protein is not degradated and there is not any other inorganic nitrogen source, a limitation by secondary substrate (IIN) occurs (Fig. 5). It affects the growth and uptake rates of all microorganism trophic groups, which results in the accumulation of organic acids and pH decreases. Then, successive and combined inhibitory effects take place in the bioreactor leading to the suppression of microbial activity and to process failure.
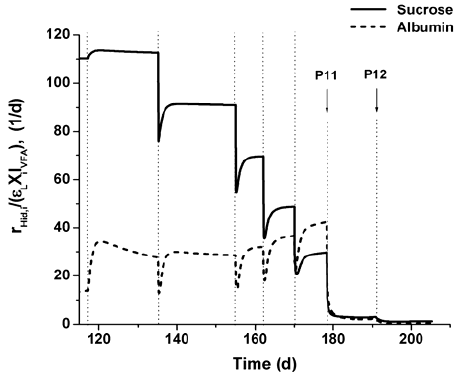
Fig. 4. Sucrose and albumin hydrolysis rate values from Simulation C for RAS during disturbances P6-P12.
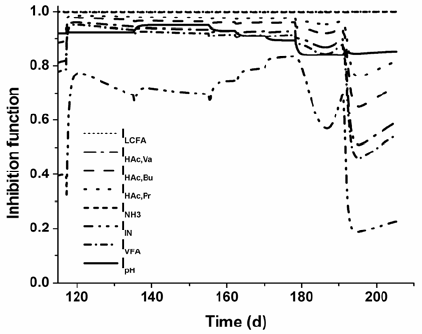
Fig. 5. Inhibition function profiles from Simulation C for RAS during disturbances P6-P12.
The enzymatic hydrolysis is a complex multi-step process. It includes multiple enzyme production, diffusion, adsorption, reaction and enzyme deactivation steps.
Several and modeling-oriented research must be de-veloped in order to reproduce the experimental behavior of reactors via simulation. It was observed (results not shown) that a similar response is obtained when the washout process is combined with the H2S inhibition of methanogens due to the protein degradation.
Similar results were obtained for reactor RGS. The instantaneous hydrolysis hypothesis is acceptable up to day 175 (during P6-P8 disturbances), and then, a decrease in the HRT causes a decrease in bioreactor efficiency. Parameters for gelatin hydrolysis have been included in Table 4.
Figures 6 and 7 show the measured and predicted values of total COD, pH and methane flow rate for reactors RAS and RGS, respectively, during all experimental campaign. Results from Simulation C are there shown.
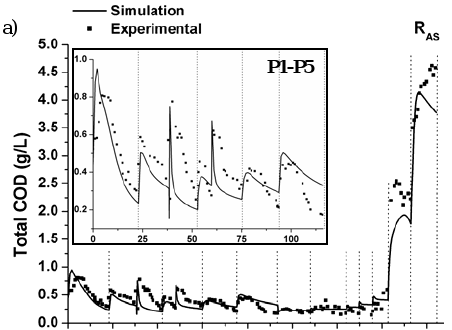
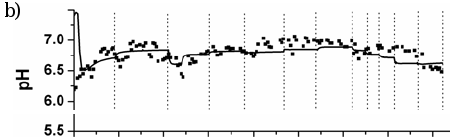
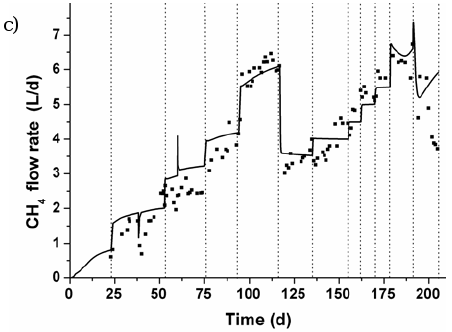
Fig. 6. Experimental and predicted values for RAS: a) total COD, b) pH, and c) methane (CH4) flow rate.

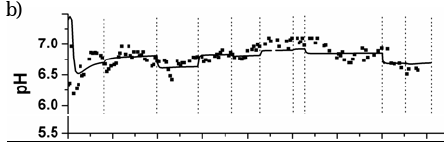
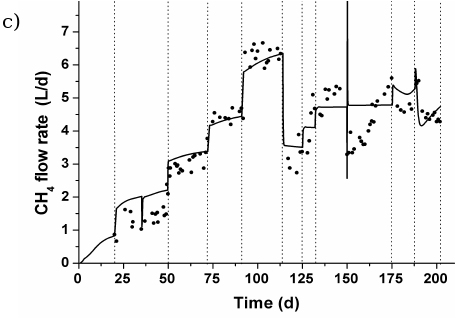
Fig. 7. Experimental and predicted values for RG: a) total COD, b) pH, and c) methane (CH4) flow rate.
A failure in the recirculation pumping system caused a hydrodynamic disturbance in RGS at day 150 (Fig. 7). The bed height fell dawn to its static bed condition (H= Ho) and after fifteen minutes, a new fluidization level (ε ≈ 0.65) was established due to an increase in the inlet superficial velocity Uo from 4.68×10⁻² to 5.23×10⁻² ms-1. It caused the biofilm detachment, and thus, an increase in total COD values. The organic load policy of RGS was delayed with respect to the RAS one.
High COD removal efficiencies were obtained during step-type disturbances in the protein-carbohydrate concentration at a HRT higher than 1 day. More than 85% of total COD was removed up to 4.70 and 3.50 g COD L-1d-1 of OLR for RAS and RGS, including 58 and 43% of complex substrates, respectively. Although the interest in fluidized bed reactors is to fix slow-growing methanogens, rather than fast-growing acidogens, these results indicate that the microbial populations present in both reactors were able to resist increasing organic loading rate and to treat directly a complex substrate as a consequence of mature and well-established biofilms in a unique process unit.
Greeks
δ: biofilm thickness
ε: porosity, phase holdup (volumetric fraction)
μ: microorganism growth rate, viscosity
ν: process rate coefficient
νst: gas molar volume
ρ: density
ω: specific energy dissipation rate  : mass or molar concentration
Subscripts
bh: biomass hydrolysis
bp: bioparticle
c: reactor column
d: biomass death
E: detachment
f : feed
G, g: gas
Hid: particulate material hydrolysis
i: phase component index
in: inlet
j: biochemical and physico-chemical process index
L, l: liquid
out: outlet
p: particle
r: recycle
S: solid
t: terminal
ACKNOWLEDGEMENTS
Financial support from Consejo Nacional de Investigaciones Científicas y Técnicas (CONICET), Agencia Nacional para la Promoción de la Ciencia y la Tecnología (ANPCyT) and Universidad Nacional del Litoral of Argentina is acknowledged.
REFERENCES
1. Angelidaki, I., L. Ellegaard and B.K. Ahring, "A comprehensive model of anaerobic bioconversion of complex substrates to biogas", Biotechnol. Bioeng., 63, 363-372 (1999). [ Links ]
2. Batstone, D.J., J. Keller, I. Angelidaki, S.V. Kalyuzhnyi, S.G. Pavlostathis, A. Rozzi, W.T.M. Sanders, H. Siegrist and V.A. Vavilin, "Anaerobic digestion model no. 1 (ADM1)", IWA Task Group for mathematical modelling of anaerobic digestion processes. IWA Publ., London UK (2002). [ Links ]
3. Bhatia, V.K. and N. Epstein, "Three-Phase Fluidization: A Generalized Wake Model", Proc. International Syrup. Fluid. Appl., Cepadues-Editions, Toulouse, 380-392 (1974). [ Links ]
4. Biszku, E., M. Sajgó, M. Solti and G. Szabolcsi, "On the mechanism of formation of a partially active aldolase by tryptic digestion. Eur. J. Biochem., 38, 283-292 (1973). [ Links ]
5. Borja, R., B. Rincón, F. Raposo, J.R. Domínguez, F. Millán and A. Martín, "Mesophilic anaerobic digestion in a fluidised-bed reactor of wastewater from the production of protein isolates from chickpea flour", Process Biochemistry, 39, 1913-1921 (2004). [ Links ]
6. Efremov, G.I. and I.A. Vakhrushev, "A study of the hydrodynamics of three-phase fluidized beds", Int. Chem. Engng., 10, 37-4l (1970). [ Links ]
7. Fang, H.H.P. and H.Q. Yu, "Mesophilic acidification of gelatinaceous wastewater", J. Biotechnology, 93, 99-108 (2002). [ Links ]
8. Foscolo, P.U., L.G. Gilibaro and S.P. Waldram, "A unified model for particulate expansion of fluidized beds and flow in fixed porous media", Chem. Eng. Sci., 38, 1251-1260 (1983). [ Links ]
9. Fuentes, M., Modeling and dynamic simulation of anaerobic biofilm fluidized bed reactors. Application to the complex effluent treatment, Ph.D. dissertation (ISBN-13: 978-987-05-0709-3), Universidad Nacional del Litoral, Argentina, (2006). [ Links ]
10. Fuentes, M., C. Thompson, M. Mussati, P. Aguirre and N. Scenna, "Modeling of protein hydrolysis kinetic using an alkaline protease from Bacillus Licheniformis", Proc. ENPROMER-2005, Rio de Janeiro, Brazil (2005). [ Links ]
11. Fuentes, M., N. Scenna, P. Aguirre and M. Mussati, "Anaerobic biofilm reactor modeling focused on hydrodynamics", Chem. Eng. Comm., Submitted (2007). [ Links ]
12. Huang, J. and C. Wu, "Specific energy dissipation rate for fluidized bed bioreactors", Biotechnol. Bioeng., 50, 643-654 (1996). [ Links ]
13. Ottesen, M., "The Conversion of Ovalbumin into Plakalbumin, as Followed in the pH-stat", Arch. Biochem. Biophys., 65, 70-77 (1956). [ Links ]
14. Process System Enterprise Ltd., gPROMS Advanced User Guide, Release 2.3, London (2004a). [ Links ]
15. Process System Enterprise Ltd., gPROMS Introductory User Guide, Release 2.3.1, London (2004b). [ Links ]
16. Richards, F.M., "Titration of amino groups released during the digestion of ribonuclease by subtilisin", C.R. Trav. Lab. Carlsberg, Ser. Chim, 29, 322-328 (1956). [ Links ]
17. Solti, M., E. Biszku, M. Sajgó and G. Szabolcsi, "Some structural features of rabbit muscles aldolase as derived from its limited proteolysis", Acta Biochim. Biophys. Acad. Sci. Hung., 10, 185-199 (1975). [ Links ]
18. Sousa Jr, R., G.P. Lopes, P.W. Tardioli, R.L.C. Giordano, P.I.F. Almeida and R.C. Giordano, "Kinetic model for whey protein hydrolysis by alcalase multipoint-inmobilized on agarose gel particles", Braz. J. Chem. Eng., 21, 147-153 (2004). [ Links ]
19. Tsuneda, S., J. Auresenia, Y. Inoue, Y. Hashimoto and A. Hirata, "Kinetic model for dynamic response of three-phase fluidized bed biofilm reactor for wastewater treatment", Biochem. Eng. J., 10, 31-37 (2002). [ Links ]
20. Yu, H. and B.E. Rittmann, "Predicting bed expansion and phase holdups for three-phase fluidized-bed reactors with and without biofilm", Wat. Res., 31, 2604-2616 (1997). [ Links ]
21. Yu, H.Q. and H.H.P. Fang, "Acidogenesis of gelatin-rich wastewater in an upflow anaerobic reactor: influence of pH and temperature", Wat. Res., 37, 55-66 (2003).
[ Links ]
Received: August 2, 2006
Accepted: February 23, 2007
Recommended by Subject Editor: Jose Pinto

