


Services on Demand
Journal

Article
 English (pdf)
 Article in xml format
 Article references
 Send this article by e-mail
Indicators
-
 Cited by SciELO
Related links
-
 Similars in
SciELO
Similars in
SciELO
Share

 Permalink
Latin American applied research
Print version ISSN 0327-0793
Lat. Am. appl. res. vol.39 no.1 Bahía Blanca Jan. 2009
ARTICLES
A wireless sensor network for endotracheal tube cuff pressure monitoring
M. Cipolletti†, F.N. Martin Pirchio†, S. Sañudo†, P. Julián†, W. Villalba‡, F. Masson† and P.S. Mandolesi†
† Instituto de Investigaciones en Ingeniería Eléctrica - IIIE (UNS-CONICET), Dto. Ingeniería Eléctrica y Computadoras, Universidad Nacional del Sur, Bahía Blanca (8000) Argentina. E-mail: pjulian@ieee.org
‡ Hospital Privado del Sur, Las Heras 164, Bahía Blanca (8000), Argentina
Abstract - Endotracheal tubes (ETT) are kept in position using inflatable cuffs. The pressure of the cuff needs to be higher than a minimum value to hold the ETT in place. However, pressures exceeding 20mmHg produce damage of different degrees on the trachea. This paper shows an experimental network of wireless and low power nodes for monitoring the pressure of ETT cuffs (ETTC). All nodes communicate wirelessly through an RF link with a central station that displays values on a PC and generates alarms if values are beyond the limits prescribed by the physician. The system was tested to monitor the condition of several patient ETTC in a coronary intensive care unit of the "Hospital Privado del Sur", in Bahía Blanca, Argentina.
Keywords -Endotracheal Tube Cuff Pressure. Sensor Networks. Low Power Electronics. Health Monitoring
I. INTRODUCTION
Endotracheal intubation is regularly used to establish an open airway in the trachea, which can be used to force ventilation and also as part of an anesthesia delivery system (Mansfield et al. 1993). The tube is inserted in the trachea and is kept in place through the use of an inflatable cuff (see Fig. 1). The cuff is inflated to a certain pressure externally in order to prevent gas leak and pulmonary aspiration. If the pressure of the cuff is excessive, then damage might occur on the mucous and submucous membrane by the restriction of the capilar blood flow. On the other hand, insufficient inflation of the cuff increments the risk of broncoaspiration (Escalante and Andrade, 2005).

Fig. 1. Endotracheal tube and inflatable cuff. A syringe is usually located at the end of the smaller tube to inflate the cuff. The pressure sensor is located at this point.
The pressure of the tracheal capilary perfusion has been estimated to require 22 mmHg and follows a proportional law with respect to the balloon pressure (Ganner, 2001). As reported in Escalante and Andrade (2005) the mucous membrane turns pale at 30 mmHg, white at 37 mmHg, and blood circulation stops at 45 mmHg. These numbers suggest that blood flow is initially affected by balloon pressure levels around 22 mmHg (Braz et al., 1999) and that there exists complete blocking of tracheal capillaries at 37 mmHg. Pressures in excess of the perfusion pressure of mucosa and submucosa might lead to loss of mucosal ciliar (Klainer et al., 1975), ulceration, bleeding, tracheal stenosis (Berlauk, 1986), and tracheoesophageal fistula (Staufer et al., 1981).
In Herrera-Carranza (1997), the authors recommend the use of tubes of appropriate size, with a diameter greater than 30mm in adults; if this recommendation is followed, then a pressure of approximately 20mmHg in the cuff produces an effective seal. However, even if the initial ETTC pressure is low, a series of factors might increase it; for example, the use of nitrous oxide, a gaseous anesthetic commonly used in post anesthesia care units and intensive care units (Braz et al., 1999) due to the diffusion of nitrous oxide into the cuff (Seegobin and van Hasselt, 1984). In addition, in this paper we present experimental evidence showing that in patients who are mechanically ventilated, the positive end-expiratory pressure (PEEP) set by the machine increases the ETTC pressure significantly.
The results reported in Escalante and Andrade (2005) and Curiel et al. (2001) strongly suggest that monitoring the pressure of the ETT cuffs (ETTC) reduce tracheal pain after intubation. In Escalante and Andrade (2005) two groups were analyzed. A first group was monitored three times a day, and the pressure was maintained at 20 mmHg. The second group was not monitored. Twenty four hours after extubation 30% of patients of the first group had moderate pain and 70% no pain at all, compared with 80% of moderate pain and 20% with no pain at all in the second group. The case reported in Curiel et al. (2001) showed that after 24 hours 10% of patients with ETTC pressures less than 42mmHg showed tracheal pain, in contrast with 53.3% of patients in the case where the ETTC pressures exceeded 42mmHg. The results reported in Guyton et al. (1997) suggest that patients with ETTC in excess of 25mmHg may be at risk for ischemic tracheal injury, even if proper cuff inflation techniques are used. A study performed in a Hospital in Sao Paulo, Brazil, (Braz et al., 1999) showed that ETTC pressures in intensive care units and post anesthesia care units are routinely high and that most professionals are unaware of this problem. In view of these factors, several authors have emphasized the need for regular ETTC pressure monitoring (Braz et al., 1999; Fernandez et al., 1990 ).
In this paper we report an experimental network of wireless sensor nodes that can be used to monitor the pressure of ETTC in several patients at the same time. Every node has a pressure sensor with low power consumption conditioning electronics, and a wireless interface that transmits the pressure information to a central computer, or to a similar node in the network. The system has been demonstrated in the "Hospital Privado del Sur", in the city of Bahía Blanca (Argentina), in a coronary intensive care unit. The system is currently working in such a way that nurses can monitor data from all intubated patients on a computer screen. The sampling time can be programmed at will, and alarms are generated every time the pressure is outside the limits prescribed by the doctors.
II. NODE AND SENSOR NETWORK DESCRIPTION
Sensor networks have emerged as a consequence of the evolution of integrated circuit technology that permits the integration of sensors, conditioning and processing electronics and wireless transmission units in a small volume, sometimes even in a single chip (Chong and Kumar, 2003). The underlying idea behind sensor networks is to have a large number of cheap and small volume sensors that can collectively monitor activity in a given area. Minimization of volume in the design of the node directly implies that the node energy supply will be minimum (small batteries or solar cells), therefore the need to make all devices with extremely low power consumption. Several examples have been shown in the literature illustrating applications of sensor networks in medical care (Chong and Kumar, 2003; Shnayder et al., 2005, Fulford-Jones et al., 2004, Malan et al., 2004; Myung et al., 2003). The use of sensor networks for patient care has several advantages (Airespace, 2004). One advantage is an increase in the available time between healthcare professionals and patients, due to the reduction of the time needed for administrative tasks. Another advantage is improved decision making, given that doctors have more information and real time access to patient records, drug information, and medical reports; indeed, having electronic records for patients help significantly to reduce errors in identification, medication, monitoring, location, etc. The availability of continuous monitoring of the patient's vital statistics even if the doctor is away from the patient permits an improved attention and a rapid response to condition changes. This factor contributes not only to an improved patient safety, but also to an increased sense of safety, since the patient knows that he is being constantly monitored.
The trend is to design low power, minimum size sensors for monitoring vital patient variables (Myung et al., 2003), such as temperature, pressure, glucose level, electrocardiogram (ECG) (Fulford-Jones et al., 2004), pulse, arterial pressure, etc., and transmit the data wirelessly to a central unit that can interface with a local network (Malan et al., 2004). To the best of the authors knowledge, no results have been reported about sensor networks for ETTC pressure monitoring.
The node reported in this paper has three main parts: a pressure sensor, conditioning electronics, and a wireless interface to communicate data (see Fig. 2). For the measurement of the ETTC pressure, the selected pressure sensor was the Motorola MPX2010 due to its small size and pressure range. This sensor is based on a resistive differential bridge with two membranes.
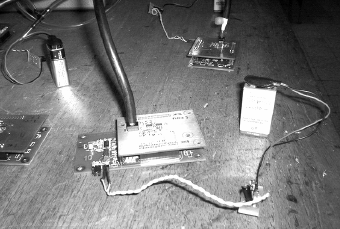
Fig. 2. Sensor pressure board (top) showing the connection between the pressure sensor and the cuff, the wireless board (bottom) and the battery (right).
The pressure range is 0 to 74.98 mmHg, and for 10V power supply datasheets indicate an output voltage range of [0mV - 25mV] (sensitivity of 333 μV/mmHg). In order to reduce the power consumption, and make the sensor electronics compatible with the conditioning electronics and the wireless interface, the sensor was evaluated at 3V. At this voltage supply, the sensitivity is 110 μV/mmHg and the current consumption is 1.95mA. In addition, the noise was characterized with an INA 110 based amplifier and was found to be 38 nV/vHz or 18µV RMS over a bandwidth of 240KHz. These pressure sensors characteristics have variations. This is illustrated in Table 1, where the measured outputs of five test units to five different pressure levels are listed. This evidences the need for a calibration procedure prior to the installation of the the units. Figure 3 shows a picture of the calibration setup, where all sensors were measured and compared using a column of Hg.
Table 1. Pressure sensor variations
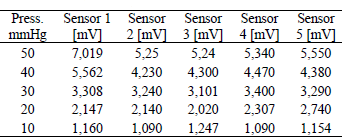

Fig. 3. Five stations during the calibration procedure.
A differential two-stage preamplifier based on the low power TLV 2382 operational amplifier from Texas Instruments, that features a current consumption of 7uA, was used to condition the signal from the sensor. The schematic is shown in Fig. 4.
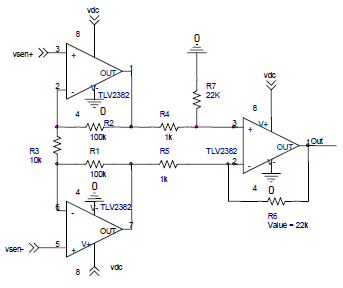
Fig. 4. Schematics of preamplifier. This circuit amplifies the signal from the pressure sensor with a current consumption of 7uA per operational amplifier.
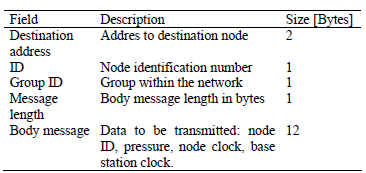
The analog output of the preamplifier is sent to a second board, which has a wireless station based on a chipconn CC1000 RF chip (433MHz) and an ATMEL Atmega 128L low power microprocessor. The microprocessor has an 8-bit A/D converter that performs a digital conversion of the preamplifier output. This data is available to the RF chip that can transmit it to the central station on request. The RF chip can transmit data reliably over distances exceeding 100m at a speed of 4.8KB/s. The message sent over the radio is 17 bytes long, and the structure is detailed in Table 2.
Table 2. Message structure
The central station is a receiver based on the same RF chip, and is connected to a standard PC using the RS232 port. The sensor is in sleep mode during normal operation and wakes up at intervals that can be programmed by the user. Once the sensor is up, it transmits the information and goes back to sleep. All values are displayed on the computer using a Matlab™ application; Fig. 5 is a snapshot of the application screen showing the data measured by the five pressure sensors during a calibration experiment in the lab (no patient involved) where the reduction of pressure was intentionally produced.
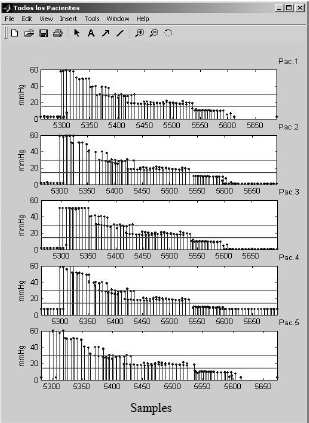
Fig. 5. Graphical interface displayed on the computer, showing the data from five different units1. Samples are taked every 6s.
The most important source of power consumption in the proposed sensor network is due to the power consumed by the communication RF link during transmission time. Therefore, it is critical to reduce the communication activity to a minimum. For debugging and test purposes, sampling times of 100ms and 6s were used. However, once installed permanently in the hospital, the sampling period can be reduced significantly, given that changes in ETTC pressure occur with very slow time constants. Sampling intervals of 10 minutes or more are appropriate.
Current consumption during data transmission is 30mA and the time necessary to transmit the sensor information is 3.6ms. The microprocessor takes 3ms to perform an A/D conversion and assemble the packet, and during this period consumes 15mA. In this period, we need to add the 2mA of the pressure sensor plus preamplifier electronics2. Therefore, if data is transmitted once every ten minutes, the equivalent current consumption of the node would be Ieq = 30×10-3 ·3.6×10-3 /(10×60) + 17×10-3 · 3×10-3 /(10×60) = 180nA + 85nA = 265nA. One battery of 2000mAH can sustain this consumption for several decades. The system (microprocessor + RF chip) current consumption in standby is 26uA, which for the same battery implies an operation time of 12 years. However, a custom digital state machine with a very slow clock can be designed to control the system, reducing the standby current consumption to tens or a few hundreds of nanoamps.
III. EXPERIMENTAL MEASUREMENTS IN AN INTENSIVE CARE UNIT
In order to demonstrate the operation of the units, an experiment was conducted in one of the Intensive Care Units of Hospital Privado del Sur. The unit together with a battery was placed in a box (see Fig. 6), with an external antenna connection and a tube to interface with the ETT cuff. The box was connected to an intubated patient (see Fig. 7), who was mechanically ventilated, and data was recorded for a period of two hours.

Fig. 6. Box containing one station and the battery. The box has a connector for the RF antenna and the tube to interface with the ETT cuff.
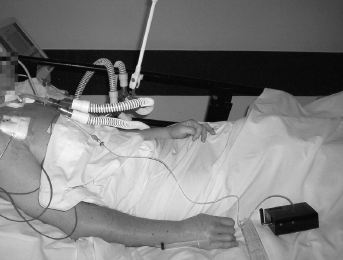
Fig. 7. Picture of mechanically-ventilated patient with the monitoring unit connected.
Figure 8 shows the data recorded during the experiment. The sampling time was set to 100ms in order to see the variations produced by the patient respiration. The PEEP of the mechanical ventilation machine was set to 5 mmHg. Under these conditions the average ETTC pressure was 28mmHg.
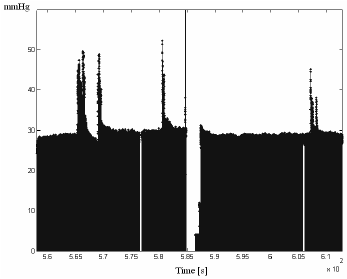
Fig. 8. Data logged over a period of two hours of operation at a sampling time of 100ms. Peaks correspond to variations in PEEP. The drop in the middle of the sequence corresponds to an intentional stop.
At some periods of time, the PEEP of the machine was changed by the physician, and this caused the increase in the ETTC pressure. This effect can be clearly appreciated as peaks in Fig. 8 (the drop in the middle of the sequence corresponds to an intentional stop). The PEEP of the machine can be set up to a maximum value of 20 mmHg. Figure 8 shows that high values of PEEP can produce up to 50mmHg in the ETTC, and evidences the need for adjustment under these circumstances.
Figure 9 shows data recorded during a shorter period of time of 20 seconds. The periodical variations are the result of the positive and negative pressures exerted by the ventilation machine. Actually, this data allows the estimation of the ventilation period, around 4 seconds, which coincided with the period set by the machine.

Fig. 9. Value of ETTC pressure (relative to ambient pressure) measured during an interval of 20s of a patient with mechanically assisted ventilation.
IV. DISCUSSION
An experimental sensor network has been proposed for monitoring the ETTC pressure of patients in a healthcare environment. Nodes have been built using low power electronics and wireless interfaces. A central computer is connected to the network of sensors, and requests information from the individual sensors with a frequency that can be programmed. Limit values can be programmed by the physicians in order to generate alarms when the pressure falls outside them.
The prototype built, together with the relatively low sampling rate required by this application, permits us to conclude that ETTC sensing nodes without battery replacement are possible. Integration of sensor and electronics in a single chip, or a system-on-package, will permit the miniaturization of the node. This will increase the robustness of the sensor a factor of importance because patient movements occur frequently, and might disconnect or damage the device- and it will also reduce the cost.
As evidenced by the results in the literature, frequent monitoring and adjustment of ETTC pressure contributes to minimize intubation damage, and therefore to improve patient's health and comfort. The proposed system provides an automated way to detect those ETTC that need pressure adjustment without requiring attention or time from the healthcare professionals. Indeed, this mechanism could be used by a machine to automatically keep the ETTC pressure correct. Moreover, as the need for manual pressure measurement is eliminated the system provides a convenient platform to perform more intensive medical studies, in a more efficient way, with a larger number of patients and for longer periods of time than those reported so far (Escalante and Andrade, 2005; Curiel et. al., 2001; Braz et. al., 1999).
Notes
1 As the interface was intended to use in Argentine hospitals, all labels and indications are in Spanish.
2 The power supply of the preamplifier stage is activated by the microprocessor only when the unit is on, and not all the time.
ACKNOWLEDGMENT
The authors want to thank Hospital Privado del Sur, and its many professionals, physicians and nurses that helped throughout the development stages of the system.
REFERENCES
1. Airespace Technology, "Improving patient care through wireless mobility," white paper; Online: www.airespace.com (2004). [ Links ]
2. Berlauk, J., "Prolonged endotracheal intubation vs. tracheostomy," Crit. Care Med., 14, 42-6 (1986). [ Links ]
3. Braz, J.R.C., L.H.C. Navarro and I.H. Takata, "Endotracheal tube cuff pressure: need for precise measurement," Sao Paulo Med. J., 117, 243-247 (1999). [ Links ]
4. Chong, C. and S.P. Kumar, "Sensor networks: evolution, opportunities, and challenges," Proc. of the IEEE, 91, 1247-1256 (2003). [ Links ]
5. Curiel, G.J.A., R.F. Guerrero and M.M. Rodriguez, "Presión del manguito en la intubación endotraqueal: Debe medirse en forma rutinaria?" Gac. Medica Mexicana,137, 179-182 (2001). [ Links ]
6. Escalante, D.S. and S.R.C. Andrade, "Eficacia de la monitorización de la presión del manguito del tubo endotraqueal para reducir el dolor traqueal después de la extubación en México," Revista de la Asociación Mexicana de Medicina Crítica y Terapia Intensiva, 19, 50-53 (2005). [ Links ]
7. Fernandez, R., L. Blanch, J. Mancebo and N. Bonsoms, "Endotracheal tube cuff pressure assessment: pitfalls of finger estimation and need for objective measurement," Crit. Care Med., 18, 3-6 (1990). [ Links ]
8. Fulford-Jones, T.R.F., G. Wei and M. Welsh, "A Portable, Low-Power, Wireless Two-Lead EKG System," Proc. of the 26th IEEE EMBS Annual International Conference, San Francisco (2004). [ Links ]
9. Ganner, C., "The accurate measurement of endotracheal tube cuff pressures," Br. J. Nurs., 10, 1127-1134 (2001). [ Links ]
10. Guyton, D.C.,M.R. Barlow and T.R. Besselievre, "Influence of airway pressure on minimum occlusive endotracheal tube cuff pressure. Clinical Investigation," Critical Care Medicine, 25, 91-94 (1997). [ Links ]
11. Herrera-Carranza, M., Iniciación de la ventilación mecánica. Puntos clave, Editorial Auroch, First Edition, Spain, 27-32 (1997). [ Links ]
12. Klainer, S.A., H. Turndorf and H.W. Wu, "Surface alterations due to endotracheal intubation," Am. J. Med., 58, 74-83 (1975). [ Links ]
13. Malan, D., T.R.F. Fulford-Jones, M. Welsh and S. Moulton, "CodeBlue: An Ad Hoc Sensor Network Infrastructure for Emergency Medical Care," Int. Workshop on Wearable and Implantable Body Sensor Networks (2004). [ Links ]
14. Mansfield, J.P., R.P. Lyle, W.D. Voorhees and G.R. Wodicka, "An Acoustival Guidance and Position Monitoring System for Endotracheal Tubes," IEEE Trans. Biomedical Engineering, 40, 1330-1335 (1993). [ Links ]
15. Myung, D., B. Duncan, D. Malan, M. Welsh, M. Gaynor and S. Moulton, "Vital Dust: Wireless sensors and a sensor network for real-time patient monitoring," 8th Annual New England Regional Trauma Conference, Burlington, MA (2003). [ Links ]
16. Nordin V., "The trachea and cuff induced tracheal injury," Acta Otolaryngol, 71: 345, 7-71 (1977). [ Links ]
17. Seegobin, R.D. and G.L. van Hasselt, "Endotracheal cuff pressure and trácela mucosal blood flow: endoscopic study of effects of four large volume cuffs," British Medical Journal, 288, 965-968 (1984). [ Links ]
18. Shnayder, V., B. Chen, K. Lorincz, T.R.F. Fulford-Jones and M. Welsh, "Sensor Networks for Medical Care", Harvard University Technical Report TR-08-05 (2005). [ Links ]
19. Stauffer, J., D. Olsen and H.T. Petty, "Complications and consequences of endotracheal intubation and tracheostomy", Am. J. Med., 70, 65-76 (1981). [ Links ]
Received: November 16, 2007.
Accepted: March 30, 2008.
Recommended by Subject Editor José Guivant.

