


Serviços Personalizados
Journal

Artigo
 Inglês (pdf)
 Artigo em XML
 Referências do artigo
 Enviar este artigo por email
Indicadores
-
 Citado por SciELO
Links relacionados
-
 Similares em
SciELO
Similares em
SciELO
Compartilhar

 Permalink
Latin American applied research
versão impressa ISSN 0327-0793
Lat. Am. appl. res. vol.39 no.3 Bahía Blanca jul. 2009
Analysis of ventricular late potentials in high resolution ecg records by time-frequency representations
† Gabinete de Tecnología Médica. Departamento de Electrónica y Automática.
Facultad de Ingeniería, Universidad Nacional de San Juan, San Juan, Argentina
lorosco@gateme.unsj.edu.ar, laciar@gateme.unsj.edu.ar
Abstract — This study proposes the application of different linear and quadratic Time-Frequency Representations (TFR) for the analysis of Ventricular Late Potentials (VLP) in High-Resolution Electrocardiographic (HRECG) records. The TFR used here were Short-Time Fourier Transform (STFT), Wigner-Ville (WV) and Choi-Williams (CW) distributions. These techniques were used to evaluate the risk of Ventricular Tachycardia (VT) in post-infarction patients. For comparison, the same analysis was made on HRECG records of subjects presenting Low Arrhythmia Risk (LAR). For all TFR and both populations, two indexes on the Time-Frequency (T-F) plane were considered: a) Energy of VLP normalized with respect to the total energy of the beat (ENTOTAL) and b) Energy of VLP normalized with respect to the energy of QRS complex (ENQRS). The results indicate that the two T-F indexes of the LAR group show higher mean values than those of the VT group, for all TFR used. In addition, the ENQRS index for the WV distribution obtained the best valuation as a diagnostic test, showing the highest sensitivity and specificity values. It can be concluded that T-F analysis of HRECG is a promissory technique of diagnosis to identify post-infarct patients with high risk of VT.
Keywords — Ventricular Late Potentials. High-Resolution ECG. Time-Frequency Representations.
I. INTRODUCTION
In developed countries, cardiovascular pathologies represent the first cause of mortality (NHLBI, 2007). Within this group of pathologies, the Acute Myocardial Infarction (AMI) is responsible for 75% of heart disease mortality. From the total population suffering an AMI, about 25% to a 35% die within the first 48 hours of the ischemic event (Merck, 2007). The patients who survive the infarct can develop during the first year a malignant Ventricular Tachycardia (VT) with a probable death, caused by a reentry mechanism generated in the infarction zone, which alters the pattern of normal conduction of the cardiac electrical impulse (Wimmer et al., 2006).
A special type of cardiac electrical signals called Ventricular Late Potentials (VLP) can be detected in post-infarct patients with this reentry arrhythmogenic substrate. The VLP are cardiac signals of very low amplitude (between 1 and 20 μV) and high frequential content (between 40 and 250 Hz), which are located at the end of the QRS complex and at the beginning of the ST segment (Berbari and Steinberg, 2000). The generation of these potentials in post-infarct myocardium patients indicates a greater risk to develop spontaneous VT that can possibly lead to the patient's sudden death. Therefore, an early detection of VLP can identify post-infarct patients with a high risk of VT and, consequently, provide them a preventive medical treatment (Kunavarapu and Bloomfield, 2004).
Due to their particular characteristics, the VLP are not detectable in the conventional surface electrocardiogram (ECG). For this reason, other electrocardiographic techniques must be used in order to detect these cardiac micropotentials. The High-Resolution ECG (HRECG) is the specific electrocardiographic technique oriented to the detection of VLP. This technique has a greater amplitude resolution (converters A/D of 12 or more bits are generally used) and a sample rate greater than 1 KHz (AAMI, 1998). The main problem of HRECG in VLP detection is linked to the low Signal-to-Noise Ratio (SNR) of these micropotentials, which are usually masked by noise. The most widely used technique to improve the SNR of VLP is signal averaging with temporal coherence, that consists on averaging a set of heart beats, previously detected and aligned. The application of this method results in the so-called signal-averaged HRECG (AAMI, 1998).
In a previous study, a time-domain analysis of VLP in signal-averaged HRECG records was made (Orosco and Laciar, 2006). In such work, the classical temporal indexes for VT risk evaluation (Breithard et al., 1991) were computed and acceptable results were obtained. However, the temporal indexes show a high dependence on background noise. Therefore, other techniques should be investigated as well.
The last few years have seen a growing interest on time-frequency analysis of biological signals. Representations like the Short-Time Fourier Transform (STFT), the Vigner-Wille (VW) and Choi-Williams (CW) distributions, are used in this area. For instance, some of these techniques were used to extract and analyze early ictal activity in electroencefalographic signals (Sum et al., 2001); and to analyze heart rate variability in ECG records (Chan et al., 2001). In respiratory sleep disorders, T-F techniques are used to detect arousals (Cho et al., 2005). It is also worth-mentioning the analysis of changes of nonstationarity and time variation of neurological signals under some pathological conditions (Tong et al., 2007). These TFRs are also used to analyze spectroscopic optical coherence tomography signals (Graf and Wax., 2007)
In this paper, a VLP analysis technique by means of Time-Frequency Representations (TFR) is applied to signal-averaged HRECG records acquired in: a) a group of patients with a previous history of AMI who later showed ventricular tachycardia and b) a population of patients without evidence of cardiac disease, considered the control group. The purpose of this study is to determine the most significant indexes of the Time-Frequency (T-F) analysis of VLP that allow evaluating the VT risk in post-infarction patients.
II. MATERIALS
In this paper, an analysis is made on a total of 132 HRECG records of patients clinically classified into 2 groups: a) a VT group conformed by 59 patients who have undergone an AMI and later suffered ventricular tachycardia (spontaneous or induced during electrophysiological study); and, b) a LAR group of 73 patients showing no evidence of cardiac disease and, therefore, considered of low arrhythmia risk. All the records were acquired through the HRECG commercial system Predictor® (Corazonix Corp.) from the Veterans Hospital of Oklahoma, U.S.A. The orthogonal XYZ leads were acquired during 10 minutes, with a sampling frequency of 2000 Hz.
III. METHODOLOGY
A. Time-Frequency Analysis in HRECG Records
In this study, different TFR were applied to the Vector Magnitude of the averaged and filtered XYZ leads of HRECG records.
The construction of this vector is ilustrated in Fig.1. From the acquired XYZ leads of a continuous HRECG record (Fig.1a), the procedure consists on applying an algorithm to detect QRS complexes. Then, each QRS complex is aligned to each other and averaged. The algorithms are consecutively applied to each lead of this record, in order to obtain a signal-averaged HRECG record (Fig.1b), which shows a better signal-to-noise ratio than the original one. After that, the averaged signal of each lead is filtered in order to enhance the high frequency micropotentials and to attenuate the low frequency components (waves P and T) existing present in the HRECG signal. Following standard recommendations (Breithardt et al., 1991; Cain et al., 1996), a Butterworth, 4th order, bandpass filter has been applied, with a bandwidth of 40-250 Hz. Filtered signals Xf, Yf and Zf (Fig. 1c) are then combined in a Vector Magnitude (VM) (Fig. 1d), defined as:
 | (1) |

Figure 1. Computation of the Vector Magnitude in a HRECG record.
In this study, a linear TFR and two T-F distributions of Cohen's class were used (Semmlow, 2004): Short-Time Fourier Transform (STFT), Wigner-Ville Distribution (WVD) and Choi-Williams Distribution (CWD), which are defined in Eqs. 2, 3 and 4, respectively:
 | (2) |
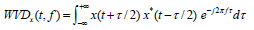 | (3) |
 | (4) |
Once TFR were applied to the VM, two different energy indexes were calculated: a) Energy of the VLP normalized with respect to the total energy of the beat (ENTOTAL), and, b) Energy of the VLP normalized with respect to the one of the QRS complex (ENQRS). These indexes are defined in Eqs. 5 and 6, respectively.
 | (5) |
 | (6) |
where TFR(t,f) is the selected time-frequency representation defined in Eqs. 2, 3 or 4; (tmin, tmax), and (fmin, fmax) represent the time and frequency limits in the T-F plane region where it is considered that VLP are located. Besides, QRSon and QRSoff are the time onset and offset points of the QRS complex; fs/2 is the half of the sampling frequency; and beaton and beatoff are the time limits of the beat. The constants k1,, k2 and k3 constitute the energy normalization parameters result from multiplying the number of rows and columns of the T-F region of VLP, QRS complex and beat, respectively.
B. Diagnostic Value of Time-Frequency Analysis
In order to evaluate the effectiveness of the T-F analysis in HRECG records as a diagnostic test, the Receiver Operating Characteristic (ROC) curves have been constructed for each index (Molinero, 2002). In these curves, (1-specificity) vs sensitivity for different cutpoints are ilustrated. Sensitivity is defined as the probability of correctly classify an individual whose real state is the one defined as positive with respect to the condition studied by the clinical test. Specificity is the probability of correctly classify an individual whose real state is the one defined as negative (Lopez and Píta, 2001).
ROC curves provide a global representation of the diagnostic accuracy. They are always increasing, which reflects the relationship between sensitivity and specificity. If the diagnostic test considered does not allow discriminating between groups, the ROC curve would be a diagonal line linking the bottom left and upper right vertices. The exactitude of the test increases as the curve representation lies closer to the upper left corner (i.e., 100% of sensitivity and 100% of specificity, corresponding to a test of perfect discrimination between groups).
IV. RESULTS
A. Time-Frequency Analysis in HRECG records
The T-F analysis technique for VLP detection was applied to each signal-averaged HRECG record of the 132 patients.
Figure 2 (a) illustrates the VM for a LAR group subject. The marks of initial and final QRS endpoints are shown with solid lines, whereas the temporal segment of interest for VLP analysis is delimited with dashed lines. Figure 2 (b), (c) and (d) show the STFT, the CW and the WV distributions, respectively, of the signal-averaged HRECG record for the same subject. The boundaries of T-F region are shown with dashed lines, delimiting the zone of interest to detect the VLP presence on the T-F plane. Figure 3 illustrates the VM (Fig. 3 (a) and its corresponding STFT (Fig. 3 (b)), the CW distribution (Fig. 3 (c)) and the WV distribution (Fig. 3 (c)) for a VT group patient. Comparing Figs. 2 (b), (c) and (d) with Figs. 3 (b), (c) and (d), it can be seen that the energy for the LAR subject is concentrated in the T-F region of the QRS complex (the clear-toned area), whereas for the VT patient, the energy is spread towards the end of the QRS complex, reflecting the presence of VLP. It can also be noted in both figures that the time-frequency resolution of the WV and CW distributions are better than that of STFT. In the linear TFR (STFT) there is a time-frequency tradeoff, namely, if the window is made smaller to improve the time resolution, then the frequency resolution is degraded, and vice versa. This tradeoff is known as uncertainty principle and it establishes that the product between frequency and time resolution must be greater than a given minimum. In the quadratic TFR (WVD and CWD), the time and frequency resolutions are improved simultaneously, but the quadratic nature of the transform creates cross-terms or cross-products whenever multiple frequencies are superimposed (Semmlow, 2004).

Figure 2. (a) Vector magnitude, (b) STFT, (c) CW distribution and (d) WV distribution, for a subject of LAR group. The dashed lines delimit the T-F region of analysis
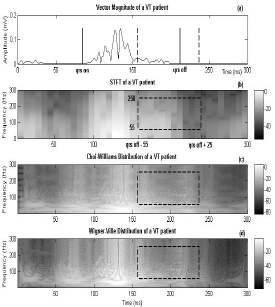
Figure 3. (a) Vector magnitude,(b) STFT, (c) CW distribution and (d) WV distribution, for a subject of VT group. The dashed lines delimit the T-F region of analysis.
Before the computation of the energy indexes, the best time (tmin and tmax) and frequency limits (fmin and fmax) of the VLP zone in T-F plane were determined. The frequency bounds ranged between 40 Hz to 250 Hz, because this is the typical bandwidth for these cardiac micropotentials (Berbari and Steinberg, 2000). For the time interval, the final endpoint of the QRS complex was taken as the reference point (Orosco and Laciar, 2006) and the time limits were moved left and right of this reference point through a range of - 60 ms to + 40ms, respectively. The above defined energy indexes were calculated for all TFRs, while varying the time and frequency limits for each computation. The results showed that the best frequency bounds were 55 Hz and 250 Hz and the time ones were qrs off-55 ms and qrs off+25 ms.
Figures 4, 5 and 6 illustrate the results of the energy indexes for LAR and VT groups. In panels (a) and (b) of these figures, the results of each energy index for each patient of both populations are shown. The lower panels (c) and (d) illustrate the mean and standard deviation values of each index for all patients of each group. These latter values are also shown quantitatively in Table 1. From this table and from the lower panels of Figs. 4, 5 and 6, the mean value of the energy indexes for the LAR group is higher than that corresponding to the VT group.

Figure 4. Results for energy indexes obtained from T-F analysis of STFT. Upper panels show: (a) ENTOTAL and (b) ENQRS , for each patient of LAR and VT groups. Inferior panels (c and d) show the results of mean and standard deviation values of each energy index for both groups

Figure 5. Results for energy indexes obtained from T-F analysis of CW distribution. Upper panels show: (a) ENTOTAL and (b) ENQRS , for each patient of LAR and VT groups. Lower panels (c and d) show the results of mean and standard deviation values of each energy index for both groups.
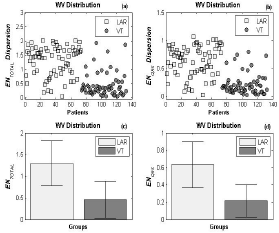
Figure 6. Results for energy indexes obtained from T-F analysis of WV Distribution. Upper panels show: (a) ENTOTAL and (b) ENQRS , for each patient of LAR and VT groups. Inferior panels (c and d) show the results of mean and standard deviation values of each energy index for both groups.
Table 1. Mean and standard deviation for energy indexes for: (a) STFT, (b) CW Distribution, and (c) WV Distribution, for LAR and VT groups

B. Diagnostic Value of Time-Frequency Analysis
In order to establish the diagnostic value of energy detailed in Table 1, the ROC curves were built for each index (ENQRS and ENTOTAL for STFT, CW and WV distributions) and shown in Fig. 7.

Figure 7. ROC curves of ENTOTAL and ENQRS for STFT, CWD and WVD
A zooming of the squared area of Fig. 7 and shown in Fig. 8, lets perceive that the curve, corresponding to ENQRS index for WVD, has the best valuation as a diagnostic test, because this curve is the nearest one to the upper left corner of the graph which, again, corresponds to an ideal test of perfect discrimination.

Figure 8. Zoom zone of Fig. 7. The arrow indicates the point with best values of sensitivity and specificity.
The cutpoint of the best ROC curve corresponding to an energy value of ENQRS =0.3235, which attains the best values for sensitivity (83,1%) and specificity (86,3%). It can also be mentioned that this index classifies correctly a large fraction composed of 63 subjects from the total of 73 subjects of the LAR group, and 49 of the VT group with a total of 59 patients.
V. CONCLUSIONS
In this study, a time-frequency (T-F) analysis of ventricular late potentials (VLP) in signal-averaged HRECG records was proposed. This technique was evaluated with a group of 59 patients presenting a previous history of acute infarct of myocardium who later developed episodes of Ventricular Tachycardia (VT), as well as to a group of 73 patients with no evidence of cardiac disease and Low Arrhythmia Risk (LAR).
The goal of this study was to determine the most significant indexes from the T-F analysis that allow evaluating the VT risk in post-infarct patients.
The results obtained show that from among all the computed indexes, three of them (namely, ENQRS (WVD), ENTOTAL (WVD), and ENTOTAL (CWD)) have shown the best statistical results. It was also noted that these indexes present higher mean values for the LAR group than those obtained for the VT group. On the other hand, the ENQRS index for Wigner-Ville distribution obtained the best valuation as a diagnostic test, showing the highest values of sensitivity (83.1%) and specificity (86,3%) for a cutpoint of ENQRS=0.3235.
Despite the simplicity of computing the linear TFR as compared with the quadratic TFR, the results obtained here show that these last ones have higher sensitivity and specificity values.
A global conclusion may state that that time-frequency analysis of VLP in signal-averaged HRECG records is a promissory diagnosis technique to identify post-infarct patients with high VT risk.
As a future work, this T-F technique will be evaluated in more numerous populations of post-infarction patients. Besides, new indexes will be proposed and other VLP analysis techniques will be tested in signal-averaged HRECG records.
ACKNOWLEDGEMENTS
For the current research, L. Orosco has been financially supported through a scholarship from Agencia Nacional de Promoción Científica y Técnica (ANPCyT). E. Laciar has been supported with grants from Consejo Nacional de Investigaciones Científicas y Técnicas (CONICET) and Universidad Nacional de San Juan (UNSJ), all of them Argentine institutions.
REFERENCES
1. AAMI, Technical Information Report of the Signal-Averaged ECG Subcommitee, American Association for the Advancement of Medical Instrumentation (AAMI), TIR-23 (1998). [ Links ]
2. Berbari, E. and J. Steinberg, A Practical Guide to the Use of the High-Resolution Electrocardiogram, Futura Publishing Company Inc., New York, USA (2000). [ Links ]
3. Breithardt, G., M.E. Cain, N. El-Sherif, N. Flowers, V. Hombach, M. Janse, M.B. Simson and G. Steinbeck, "Standards for analysis of ventricular late potentials using high-resolution or signal-averaged electrocardiography. A statement by a Task Force Committee of the European Society of Cardiology, the American Heart Association and the American College of Cardiology," Circulation, 83, 1481-1488 (1991). [ Links ]
4. Cain, M.E., J.L. Anderson, M.F. Arnsdorf, J.W. Mason, M.M. Scheinman and A.L. Waldo, "American College of Cardiology expert consensus document. Signal-Averaged Electrocardiography," J. Am. Coll. Cardiol., 27, 238-249 (1996). [ Links ]
5. Chan, H.L., H. Huang and J. Lin, "Time-Frequency Analysis of Heart Rate Variability During Transient Segments," Annals of Biomedical Engineering, 29, 983-996(14). Springer (2001). [ Links ]
6. Cho, S., J. Lee, H. Park and K. Lee, "Detection of arousals in patients with respiratory sleep disorders using a single channel EEG," Conf Proc IEEE Eng Med Biol Soc., 3, 2733-2735 (2005). [ Links ]
7. Graf, R.N. and A. Wax, "Temporal coherence and time-frequency distributions in spectroscopic optical coherence tomography," J Opt Soc Am A Opt Image Sci Vis, 24, 2186-2195 (2007). [ Links ]
8. Kunavarapu, C. and D.M. Bloomfield, "Role of noninvasive studies in risk stratification for sudden cardiac death," Clinical Cardiology, 27, 192-197. (2004). [ Links ]
9. López, I. and S. Píta, "Curvas ROC" http://www.fisterra.com/mbe/investiga/curvas_roc/curvas_roc.htm (2001). [ Links ]
10. Merck, Manual Merck de diagnóstico y tratamiento, 11a edición. Elsevier España (2007). [ Links ]
11. Molinero, L.M., Valoración de pruebas diagnósticas. http://www.seh-lelha.org/pdf/pdiagnos.pdf (2002). [ Links ]
12. NHLBI, National Heart, Lung and Blood Institute "Morbidity and Mortality. 2007 Chart book on cardiovascular, lung and blood diseases", http://www.nhlbi.nih.gov/resources/docs/07-chtbk. pdf (2007). [ Links ]
13. Orosco, L. and E. Laciar, "Time analysis of ventricular late potentials in high resolution ecg records of post-infarct patients with risk of ventricular tachicardia," 9° Simposio Argentino de Informática en Salud (SIS 2006), Mendoza (Argentina), ISSN 1850-2822, 124-132 (2006). [ Links ]
14. Semmlow, J.L., Biosignal and Biomedical Image Processing. Marcel Dekker Inc., New York, USA (2004). [ Links ]
15. Sum, M., M.L. Scheuer and R.J. Sclabassi, "Extraction and Analysis of Early Ictal Activity in Subdural Electroencephalogram," Annals of Biomedical Engineering, 29, 878-886 (2001). [ Links ]
16. Tong, S, Z. Li, Y. Zhu and N.V. Thakor, "Describing the nonstationarity level of neurological signals based on quantifications of time-frequency representation," IEEE Trans Biomed Eng., 54, 1780-1785 (2007). [ Links ]
17. Wimmer, A., S. Dey and F. Morady, "A nonsustained tachycardia: What is the mechanism?," Heart Rhythm., 3, 1103-1104 (2006). [ Links ]
Received: October 18, 2007.
Accepted: October 9, 2008.
Recommended by Guest Editors D. Alonso, J. Figueroa, E. Paolini and J. Solsona.

