


Servicios Personalizados
Revista

Articulo
 Inglés (pdf)
 Articulo en XML
 Referencias del artículo
 Enviar articulo por email
Indicadores
-
 Citado por SciELO
Links relacionados
-
 Similares en
SciELO
Similares en
SciELO
Compartir

 Permalink
Latin American applied research
versión impresa ISSN 0327-0793
Lat. Am. appl. res. vol.40 no.1 Bahía Blanca ene. 2010
ARTICLES
Lift and drag coefficients behavior at low reynolds number in an airfoil with miniflaps gurney submitted to a turbulent flow. Part 2
J. Colman1, J. Marañón Di Leo1,2, J. S. Delnero1,2, M. Martinez1, U. Boldes1 and F. Bacchi1
1 Laboratorio de Capa Límite y Fluidodinámica Ambiental (LACLYFA), Facultad de Ingeniería, UNLP. Calle 116 e/47 y 48 - (1900) La Plata - Pcia. de Bs. As. - Argentina.
2 Consejo Nacional de Investigaciones Científicas y Técnicas, Avda. Rivadavia 1917, CP C1033AAJ,
Cdad. de Buenos Aires, Argentina. jcolman@ing.unlp.edu.ar
Abstract - Following the work performed in Part 1, new wind tunnel experiments were conducted in order to investigate the influence of different sizes of Gurney mini-flaps upon the aerodynamic behavior of a low Reynolds number airfoil HQ 17. The airfoil, with and without the Gurney mini-flaps, are immersed in a low Reynolds number turbulent flow. Lift and drag coefficients were calculated for the plain wing and for the wing with mini-flaps of 1%, 1.5%, 2% and 2.5% height of the chord and plotted as a function of the angle of attack ). The experimental data, including the power density spectrum of the instantaneous longitudinal and vertical velocities and load, show that the Gurney mini-flap acts enhancing the lift coefficient of the airfoil coupled with an increased drag, primarily due to the particular mini-flaps wake structure. We also found that the airfoil performance, for the four mini-flaps tested, is almost independent of the scales of the incoming turbulence.
Keywords - Flow control; Low Reynolds Number Airfoils; Turbulence; Aerodynamics.
NOMENCLATURE
| CL | lift force coefficient |
| CLmax | maximum lift force coefficient |
| CD | drag force coefficient |
| CD0 | parasite drag force coefficient |
| D | measured drag force [N] |
| Emax, | maximum efficiency |
| F | frecuency [Hertz] |
| H | Gurney miniflap height |
| L | measured lift force [N] |
| S | wing section surface [m2] |
| S(f) | Power Density Spectra Distribution [m2/s] |
| Str | Strouhal number |
| U | mean longitudinal velocity [m/s] |
| V | mean vertical velocity [m/s] |
| a | angle of attack [degrees] |
| ? | density [Kg/m3] |
I. INTRODUCTION
The authors presented in Part 1 an extended introduction regarding the use of Gurney mini-flaps of different sizes as passive flow control devices (Colman et al., 2008).
The purpose of this Part 2 is to extend the research work started by the authors in Part 1, for another mini-flaps sizes, with the aim to contribute to a better understanding of the effect of the incoming turbulent flow and mini-flaps sizes, upon the behavior of the lift and drag coefficients of a low Reynolds number airfoil HQ17. In this part were tested Gurney mini-flaps of 1%, 1.5%, 2% and 2.5% height (H) of the wing chord (see Fig. 1). The chosen sizes of the mini-flaps employed in the present work and in our previous work, are in agreement with other authors, like Schatz et al. (2004), Bechert et al. (2000), Thiele et al. (2007) Bloy and Durant (1995) and Bloy et al. (1997). For mini-flaps sizes larger than 2.5% the lift increment continuous to rise, but the drag increment is even bigger, producing decrement in the airfoil performance (Liebeck, 1978; Katz and Largmann, 1989). Those authors state that for mini-flap sizes larger than the boundary layer thickness (in our case less than 2% of the airfoil chord) the drag starts to increase considerably, producing an airfoil's efficiency reduction. Also, they found maximum airfoil efficiency for mini-flap sizes from 1.3% to 2%, depending on the incident flow and the baseline airfoil.
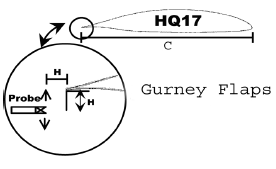
Figure 1. Scheme of the vortex measurements setup.
Troolin et al. (2006) report that the boundary layer thickness, in the trailing edge, is around 2% of the airfoil chord. Because of that we used mini-flap sizes up to 2.5%.
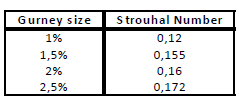
The mini-flap acts increasing the circulation around the airfoil by shifting the Kutta condition below the airfoil's sharp trailing edge, as we explained previously (Colman et al., 2008). Troolin et al. (2006), also, report that using PIV techniques, the vortex street shedding had a frequency representing Strouhal numbers from 0.13 to 0.18.
Flow control involves passive and active devices that produce desirable changes on the near walls flows and/or free shear flows (Gad-el-Hak, 1998; 2001). Passive systems, unlike active ones, do not require extra energy (Lachmann, 1961).
Flow control main objectives are: to delay or move forward the turbulent transition zone, to eliminate or increase turbulence, to prevent or to promote boundary layer separation, in order to reduce the aerodynamic drag, to increase the lift force, to improve flow mixture and to induce noise reduction, all by fluid dynamics methods (Ekaterinaris, 2004).
At low Reynolds numbers conditions (values between 10,000 and 1,000,000 based on free upstream velocity and on the wing chord) the development of a separation bubble on the upper surface of a wing, might strongly influence the flow field. In this case, for a given angle of attack, the flow field is highly complex. If the surface is regular and clean the boundary layer remains laminar until the pressure gradient changes from favorable to unfavorable. This fact determines the airfoil performance. Detached flow forms a very unstable free shear layer that easily becomes turbulent. In these conditions the flow could reattach due to the increasing income of external turbulence, making the boundary layer more energetic (Green, 1996). This reattachment of the previously detached flow constitutes the so called 'separation bubble'. Some of the required conditions for this bubble to appear are a function of the Reynolds number, the pressure distribution, the camber, the surface roughness and the incoming flow turbulent conditions.
In low Reynolds number conditions the flow follows a direction tangent to the airfoil surface until the detachment point and the turbulent transition takes place in the free shear layer due to its increasing susceptibility to transition. The turbulent flow incoming from the higher velocity region promotes the external flow reattachment, forming the previously mentioned laminar bubble. Downstream the reattachment point, the recently formed turbulent boundary layer has more available energy to resist the adverse pressure gradient avoiding a new separation. The boundary layer's capability to resist a detachment increases as the Reynolds number increases, Lissaman (1983).
The separation bubble appearance is closely linked to a Reynolds number range depending on the airfoil. Besides, it varies with the flow conditions in the surroundings (Carmichael, 1981).
The question seems to be, 'how to control the flow around a low Reynolds number airfoil in order to improve its performance?'
It is well known that Gurney mini-flaps generate vortices whose frequencies depend on the geometry and on the incoming flow (Colman et al., 2008). Our main goal is to determine the frequency those vortices are generated, in order to better understand their effect on the total airfoil circulation, and then, on the lift and drag forces and the corresponding aerodynamic efficiency.
The vortex detachment frequency will be measured using hot wire anemometry techniques trying to compare these frequency values with those obtained in the load measurements.
II. EXPERIMENTAL DETAILS
The experiments were carried out at the Boundary Layer and Environmental Fluid Dynamics Laboratory (LACLYFA) wind tunnel at the Faculty of Engineering at the Universidad Nacional de La Plata, Argentina (Boldes et al., 1995). Figure 1 shows the scheme of Gurney mini-flap configuration and the anemometer sensor location.
The tested model was an untwisted wing with a rectangular platform of 45cm of chord length and 80cm of span. The models were horizontally placed in the test section as shown in Colman et al. (2008).
The reference mean velocity (U) was measured by means of a portable hot wire anemometer Dantec Flowmaster. This anemometer was placed 100cm upstream from the tested wing and 50cm above the wind tunnel floor. The tests were conducted at a reference mean velocity of 9.7 m/sec, giving a Reynolds number based on such velocity and the wing chord, of 3.5 x 10⁵. The reference free stream mean velocity was taken at a wing model's height. The vertical mean velocity profile of the incoming flow is shown in Fig. 2.
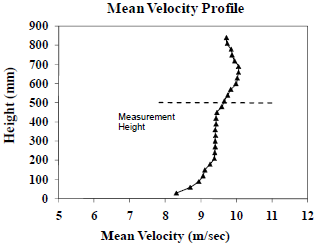
Figure 2. Potential law Mean Velocity Distribution.
The model was tested within the range from -10° to 20° of angle of attack.
To ensure that the airfoil would be submitted to a two dimensional flow, two big end plates, similar those used by Bechert et al. (2000), were located at the end of the wing tips (Colman et al, 2008). Smoke and wind threads were used to verify if the flow were two dimensional.
The present experiments examine the lift and drag behavior of the low Reynolds number airfoil HQ17 provided with four different Gurney mini flaps.
A lack of computational and/or experimental data was observed upon the aerodynamic behavior of low Reynolds airfoils with Gurney flaps, tested at Reynolds number below 5 x 10⁵ in a turbulent environment. For that reason we chose to perform our experiments at a similar Reynolds number.
The performed experiments included: the calculation of the power density spectrum of the instantaneous longitudinal and vertical velocity components in the near wake of the mini-flap (see Fig. 3 and 4). Figure 6 shows the corresponding aerodynamic load on the model. The purpose of this analysis was to explore a possible correlation between the frequency velocity peaks in the mini-flap wake and the aerodynamic load peaks. This analysis is very important because the Gurney mini-flap acts generating lift by discrete steps instead of continuous force.

Figure 3. Power Density Spectrum (U component)
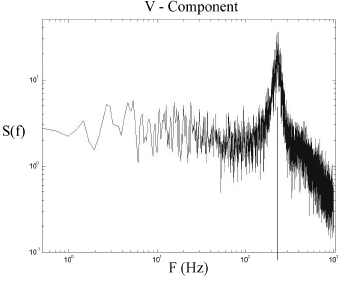
Figure 4. Power Density Spectrum (V component).

Figure 5 Measurement Grid

Figure 6. Horizontal load spectrum
The experiments were performed on the previously mentioned wing, with four Gurney mini-flaps of 1%, 1.5%, 2% and 2.5% height (H) of the airfoil chord, alternatively. They were located on the lower surface of the wing model.
The anemometer probe (X-wire Dantec sensor probe 55R51) was located at two horizontal distances behind the mini-flap: H and 2H. At each of those horizontal distances, the turbulent velocities were measured in 11 vertical points, with a constant separation of H/4, from 3 H/4 below the mini-flap to 3 H/4 above the trailing edge of the wing (Fig. 5). The acquisition frequency was 2000 Hz per channel.
A two component aerodynamic balance, built by the authors according to Tusche (1984), with a double load cells (strain-gages type) Wheatstone bridge was used. The signal was acquired with signal conditioners and Vishay series 2310 amplifiers, connected to a PC.
Under these conditions the lift and drag forces could be simultaneously measured, and then, the corresponding aerodynamic coefficients. Loads were acquired at a frequency of 500Hz.
All the experiments were carried out with an incoming turbulence of 3.8%, corresponding to the upstream position of the wing model.
The experimental results had good agreement with those described by Schatz et al. (2004) in their computational experiments. The particular characteristics of the wake had direct influence upon the increase of the section drag coefficient (Schatz et al., 2004), due to its three-dimensional characteristics.
Due to the minimal frontal area of the wing sections, no blockage correction was applied to the results.
The section lift and drag coefficients (CL and CD) were calculated and plotted, as a function of the Reynolds number and angle of attack. The lift and drag coefficients were corrected for wind tunnel wall and wing tip effects.
Temperature was continuously measured in order to adjust the air density values.
The wind tunnel essays and the data processing procedures used to determine the turbulent incoming flow characteristics and the wind loads (lift and drag), are similar to those previously used in our laboratory, explained in Delnero et al. (2005).
Visualization tests with smoke were performed in order to see the general flow configuration around the airfoils. Laminar-turbulent transition, if present, will also be visualized. However, regarding the turbulent characteristics of the incoming flow, it is possible that no transition will occur being all the boundary layer turbulent, instead.
The recirculation bubble and the laminar-turbulent transition determination are of first order importance to understand how these devices work and to act on them as a way to control the airfoil global circulation.
The experiments were developed in the following steps:
- Generation of the turbulent velocity profile
- Building of the model and set up into the wind tunnel, for the wing with the mini-flaps.
- Data acquisition with the aerodynamic balance and the hot wire anemometer.
- Analysis and data process.
Figures 3 and 4 shows the power density spectra of the instantaneous longitudinal and vertical velocities. The measurements position were 2% of the airfoil chord downstream from the trailing edge, for a wing with a 1.5% height mini-flap. The peaks corresponding to the particular Gurney mini-flap wake can be observed, as described by Jang et al. (1998), Chung (2004) and Schatz et al. (2004).
For the 1.5% Gurney mini-flap, we measured the instantaneous velocities in the point 4 of the wake, at a 2H distance from the trailing edge (see Fig. 5 for details), found the maximum peak there.
 | (1) |
The Strouhal number (Eq. 1) measured for us in that points of the wake were 0.155, closely related with values reported by other authors, like Troolin et al. (2006) (See Table 1).
Table 1
Both peak frequencies, corresponding to the u and v components, are coincident around 235 Hz. In Fig. 6 we could also show the load peak at that frequency.
Figure 7 shows the measured CL versus a evolution of the HQ17 for the wing with and without the three Gurney flaps. The CD vs a and the L/D ratio for the three Gurneys are plotted in Fig. 8 and 9, respectively.

Figure 7. CL vs. a curve.
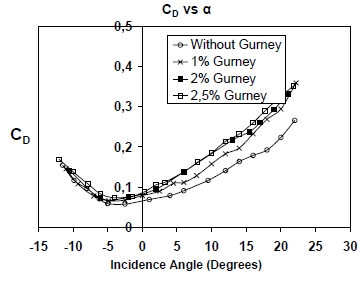
Figure 8. CD vs. a curves for the wing with and without flap
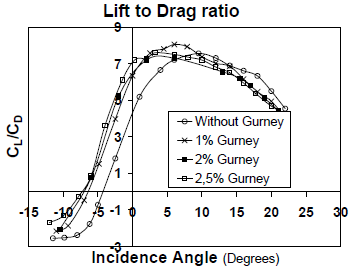
Figure 9. Airfoil Lift to Drag ratio curves
In the load frequency spectrum, as expected, a peak appears at the same frequency as the vortex shedding seen in the Gurney mini-flaps wake. In addition, some other lower peaks appear, corresponding to the harmonics and natural frequencies of the mechanic settling and load measurement system.
III. ANALYSIS OF THE RESULTS
CL and CD coefficients are determined from the measured lift (L) and drag (D) forces through the following expressions (Eq. 2):
 | (2) |
 |
As showed in Fig. 7, the airfoil with Gurney mini-flaps produces, in all cases, a larger lift force than the same airfoil without this device. Besides, larger lift forces are observed as the Gurney mini flap chord lengthens. No remarkable variation is noticed in the CLmax angle, which remains almost constant for all flap lengths as well as the CL-CD curve slopes. However, both, CLmax angle and CL-CD slopes differ from those observed in the airfoil without mini-flap. The zero-lift angle of attack changes from -4°, for the airfoil with no flap, to -7° for the airfoil with Gurney mini-flap.
It is interesting to remark that in all cases the stall condition appears gradually with these devices.
The CD vs. a curve (Fig. 8) shows that the drag force becomes larger as the flap becomes longer. For negative angles of attack the presence of flap seems to make no difference in CD and CDo (parasite drag coefficient). For positive angles of attack a larger difference is observed. As expected, the lowest drag value corresponds to the case where flaps are absent.In Fig. 9 it can be seen that all the aerodynamic CL/CD ratios curves are similar in shape and the Gurney mini-flap effect is to shift them to the left an slightly to the right, for lower angles of attack.
A deeper analysis reveals that for angles of attack lower than 7° the airfoil with no flap is the least efficient, regardless its chord length, while the highest efficiency is achieved by the airfoil with the H = 1% Gurney. Each airfoil shows its highest efficiency for different angles of attack. The airfoil without flap reaches its highest efficiency at a 9.5° angle of attack, while the airfoils with H = 1%, 2% and 2.5% flaps reach it at 6°, 6° and 3.25° angles of attack, respectively.
With a 1% mini-flap the increase of CLmax was 20% above than the corresponding value for the clean airfoil. For 2% and 2.5% mini-flaps sizes, such increments were 23.3% and 27.4%, respectively (Table 2). The mini-flaps acts increasing airfoil's slope, shifting to the left the zero lift angle of attack and also lowering the stall angle. So, airfoils with such devices had a lower stall angle than the clean wing.
Table 2

As expected, were observed a CD0 increase in all cases analyzed for the airfoil with mini-flaps, in comparison with the clean airfoil. Such increments were 15%, 23% and 31% for the mini-flaps of 1%, 2% and 2.5% respectively. Such increments are more important as the angle of attack grows (See Table 3).
Table 3

VI. CONCLUSIONS
Trailing edge Gurney mini-flaps demonstrated to enlarge both lift and drag forces. Regarding these results we observe that this kind of flap can be used as a passive flow control device or as a low complexity and easy to mount active lift enlarging device. It is important to note that the Gurney mini flap acts in a discrete fashion with the flow. In other words, it generates a vortex shedding with a given frequency that causes a lift increasing (see Figs. 6 and 7).
During the tests it was determined that this frequency depends on several factors. Controlling this vortex in order to gain control on the lift force generated will be a goal.
In the visualization tests we could observe the general flow pattern around the airfoil. No recirculation bubbles were found at low angles of attack. Only at very high angles of attack, near the stall, this bubble appears.
It should be assumed that the whole boundary layer is turbulent since it was not possible to find the laminar-turbulent transition. In any case, further work is needed in this field in order to improve visualization techniques.
Due to mechanical reasons, it is not possible to place this flap at the very extreme of the trailing edge. Thus, to use it as an active flow control device it should be placed a certain distance ahead; either, on the upper surface or in the lower surface, depending on the desired effect.
It's well known that classic trailing edge high lift devices had the double effect of increase the maximum CL and also lowering the stall angle of attack, by shifting the CL vs. a curve to the left and up. Only using a combination of leading and trailing edge high lift devices, such curve shifts to the left and grows up to right, in comparison with the clean wing, increasing both the maximum lift coefficient and the stall angle of attack.
In that sense, the mini-flap as a trailing edge or near trailing edge device, shifts such curve only to the left and up, increasing the maximum lift coefficient but also decreasing the stall angle of attack. We also found that for mini-flaps sizes less than the lower surface boundary layer thickness, near the trailing edge, the achieved aerodynamic efficiency will be better than for mini-flaps of bigger sizes. These facts will be reflected in the corresponding airfoil polars.
From the top and the trailing edge of a mini-flap two shear layers emerge which roll up into a pattern of alternating counter rotating vortices establish an absolute wake instability. The Karman vortex street in the wake of a cylinder exhibits this type of instability. Absolute instabilities can be found in laminar and turbulent flows. They are characterized by a clear peak in the spectrum of the fluctuations in the wake and its surroundings. For typical lifting conditions the shear layer rollup process within the near wake was always different for the upper and lower vortices: the shear layer separating from the pressure side of the airfoil began its rollup immediately behind the trailing edge of the mini-flap creating a stronger vortex, while the shear layer from the suction side initiated its rollup more downstream generating a weaker vortex. It seems reasonable to infer that the increased strength of the lower vortex and its proximity to the downwind surface of the mini-flap deflects the location of the free rear stagnation point. The shear layer separating from the pressure side of the airfoil is influenced by the intermittent shedding of the vortex structures originated along the upstream surface of the mini-flap. Such structures have been recently visualized (Troolin et al., 2006). They suggested that this interaction could be part of a mechanism responsible for a significant portion of the overall lift increment.
The authors are convinced that it's necessary to continue this research, focusing in a carefully and deeper analysis of the near wake fluid dynamic structure and their interaction with an active mini-flap device.
V. ACKNOWLEDGEMENTS
We thank Eng. Mauricio E. Camocardi and Eng. Daniela G. François for their collaboration in the experiments and data processing, and Dra. Ana Scarabino, for her collaboration in signal processing.
REFERENCES
1. Bechert, D.W., R. Meyer and W. Hage, "Drag reduction of airfoils with miniflaps. Can we learn from dragonflies?" AIAA Paper 2000-2315, Fluids 2000, 19-22 June, Denver, Co., USA (2000). [ Links ]
2. Bloy, A.W. and M.T. Durant, "Aerodynamic Charac-teristics of an aerofoil with Small Trailing Edge Flaps", Wind Engineering, 19, 167-172 (1995). [ Links ]
3. Bloy, A.W., N. Tsioumanis and N. T. Mellor, "Enhanced Aerofoil Performance Using Small Trailing-Edge Flaps", Journal of Aircraft, 34, 569-571 (1997). [ Links ]
4. Boldes, U., J. Colman and V. Nadal Mora, "The Boundary Layer Wind Tunnel at the Faculty of Engineering, University of La Plata, Argentina", Latin American Applied Research, 25, 75-85 (1995). [ Links ]
5. Carmichael, B.H., "Low Reynolds Number Air-foil Survey." NASA Contractor Report 165803, November (1981). [ Links ]
6. Colman, J., J. Marañón Di Leo, J.S. Delnero, M. Martinez, U. Boldes and F. Bacchi, "Lift and drag coefficients behaviour at low Reynolds number in an airfoil with Gurney flap submitted to a turbulent flow. Part 1", Latin American Applied Research, 38, 195-200 (2008). [ Links ]
7. Chung, M.Y. ES30D Fluid Mechanics II, Chap. 11 Flow Control and Wind Design, School of Engineering & Centre for Scientific Computing, University of Warwick, Great Britain (2004). [ Links ]
8. Delnero, J.S., J. Marañón Di Leo, F.A. Bacchi, J. Colman and U. Boldes "Experimental determination of the influence of turbulence scale on the lift and drag coefficients of low Reynolds number airfoils". Latin American Applied Research, 35, 183-188 (2005). [ Links ]
9. Ekaterinaris, J.A. "Prediction of active flow control performance on airfoils and wings", Aerospace Science and Technology, 8, 401-410 (2004). [ Links ]
10. Gad-el-Hak, M., "Frontiers of Flow Control", Flow Control: Fundamentals and Practices, eds. M. Gad-el-Hack, A. Pollard and J.P. Bonnet, Springer-Verlag, Berlin, 109-153 (1998). [ Links ]
11. Gad-el-Hak, M., "Flow control: The future", Journal of Aircraft, 38, 402-418 (2001). [ Links ]
12. Green, R.B. and R.A. McD. Galbraith, "Comment on dynamic airfoil flow separation and reattachment", Journal of Aircraft, 33, 1211-1216 (1996). [ Links ]
13. Jang, C.S., J.C. Ross and R.M. Cummings, "Numerical investigation of an airfoil with a Gurney flap". Aircraft Design, 1, 75-88 (1998). [ Links ]
14. Katz J. and R. Largman "Effect of 90 degree flap on the aerodynamics of a two element airfoil". Journal of Fluids Engineering, 111, 93-94 (1989). [ Links ]
15. Lachmann, G.V., Boundary Layer and Flow Control, 1/2, Pergamon Press, Oxford, Gran Bretaña. (1961). [ Links ]
16. Liebeck, R.H., "Design of subsonic airfoils for high lift", Journal of Aircraft, 15, 547-561 (1978). [ Links ]
17. Lissaman, P.B.S., "Low-Reynolds-Number Airfoils", Ann. Rev. Fluid Mech., 15, 223-239 (1983). [ Links ]
18. Schatz, M.; B. Gunther and F. Thiele, "Computational Modeling of the Unsteady Wake Behind Gurney-Flaps", 2nd AIAA Flow Control Conference, Portland, Oregon, USA (2004). [ Links ]
19. Thiele, F., E. Wassen, B. Guenther, J.S. Delnero, J. Marañón Di Leo, U. Boldes, J. Colman, F. Bacchi, and M. Martinez, "A combined numerical and experimental study of miniflaps at varying positions on an airfoil," 45th AIAA Aerospace Sciences Meeting and Exhibit. Reno, Nevada, USA (2007). [ Links ]
20. Troolin, D.R., E.K. Longmire and W.T. Lai, "Time resolved PIV analysis of flow over a NACA 0015 airfoil with Gurney flap", Experiments in Fluids, 41, 241-254 (2006). [ Links ]
21. Tusche, S., Interner Bericht: Beschreibung des Konstruktiven Aufbaus und Kalibrierung von 6-Komponenten-DMS Windkanalwaagen, DLR, Goettingen, Germany (1984). [ Links ]
Received: April 18, 2008.
Accepted: April 1, 2009.
Recommended by Subject Editor Walter Ambrosini.

