


Servicios Personalizados
Revista

Articulo
 Articulo en XML
 Referencias del artículo
 Enviar articulo por email
Indicadores
-
 Citado por SciELO
Links relacionados
-
 Similares en
SciELO
Similares en
SciELO
Compartir

 Permalink
Latin American applied research
versión impresa ISSN 0327-0793
Lat. Am. appl. res. vol.40 no.3 Bahía Blanca jul. 2010
Biodegradation kinetics of benzene and toluene as single and mixed substrate: estimation of biokinetics parameters by applying particle swarm optimization
D.E.G. Trigueros†, A.N. Módenes† and M.A.S.S. Ravagnani‡
† Chemical Engineering Department, West Paraná State University
Faculty Street, n 645, Garden Santa Maria, 85903-000, Toledo - PR - Brazil
‡ Chemical Engineering Department, State University of Maringá
Colombo Avenue, n 5790, 87020-900, Maringá - PR - Brazil
estelita_trigueros@yahoo.com.br
Abstract - This paper aims to describe the microbial biodegradation kinetics of benzene and toluene as single and mixed substrates. Particle Swarm Optimization (PSO) is used as the parameter identification procedure. Initially, the Monod and Andrews models were used. To predict the interactions between the substrates, more sophisticated models of inhibition and the SKIP model were applied. The development of the changes on the competitive inhibition model was also described. The models were evaluated using experimental data on Pseudomonas putida F1 activity found in the literature. Simulation results showed that the best description of the biodegradation process of a pure substrate can be achieved by the Andrews model and in the case of a mixture by the modified competitive inhibition model. These results were expected because both substrates are catabolized by the same metabolic pathway through Pseudomonas putida F1. The SKIP model also captured the substrate interactions well. The performance of PSO was excellent and the methodology developed in this work can be considered as very efficient.
Keywords - Benzene. Competitive Inhibition. Particle Swarm Optimization. Toluene.
I. INTRODUCTION
The mono-aromatics hydrocarbons benzene and toluene are found in oil derivatives and are widely used in chemical industries as raw materials for synthesis of other products (Phelps and Young, 2001). The benzene is involved in the production of rubber, plastics, pesticides and inks. The toluene is an important commercial chemical product generally used as a dilution agent of inks and as a solvent in the production of resins, glues and oils.
These composites are considered dangerous substances to the human health mainly for being depressors of the central nervous system. Besides, they cause damages to the respiratory, gastrointestinal and reproductive systems. Benzene is proved to be a carcinogenic and mutagen substance (Fernandes et al., 2002), being able to cause leukemia. Hence, the extreme toxicity of benzene and toluene and their frequent presence in industrial discharges and fuel spilling as environmental contaminants have accelerated the research efforts to develop the green biodegradation technologies based on the last achievements of system modeling and optimization. The key knowledge for the biodegradation process optimization of toxic compounds must be searched about the kinetics of the microbial growth and the relationship between the substrates in the system.
Several papers showed that microbial metabolism of a compound in a mixture can be strongly influenced by the presence of other compounds in the mixture (Reardon et al., 2000; Deeb et al., 2001; Brandt et al., 2004). In order to understand synergetic and/or antagonistic interactions (Jo et al., 2007) of the substrates in the mixture it is necessary to consider the metabolic pathway of each compound for the microorganism. According to Harder and Dijkhuizen (1982) homologous and heterologous compounds are those that use the same and different metabolic pathways, respectively. The presence of other compounds in a mixture of homologous substrates can result in positive effects due to the increased microbial growth and the induction of degradative enzymes. Nevertheless negative effects such as competitive inhibition have been also reported (Chang et al., 1993; Oh et al., 1994; Bielefeldt and Stensel, 1999; Reardon et al., 2000; Lin et al., 2007), decreasing the biodegradation substrate rates in the mixture.
Hamed et al. (2003) studied the biodegradation of benzene and toluene, individually and in a mixture, by using Pseudomonas putida F1 strain. The authors experimentally investigated the interactions among the substrates in the mixture. However, their efforts did not extend beyond the formalization of these phenomena in mathematical models.
The main objective of this paper is to evaluate the kinetics of microbial biodegradation of benzene and toluene through different hypothesis on microbial degradation activity and by validating them through the use of experimental data published in the literature. This goal was achieved by applying Particle Swarm Optimization during the parameters identification procedure.
II. MATHEMATICAL MODEL
A. Microbial Kinetics of Compounds Utilization
The modeling strategy was built by gradually increasing complexity on the kinetic hypothesis related to the biodegradation process in the population level. Specific growth rates described by the Monod (Eq. 1) and Andrews (Eq. 2) models were used for evaluation of pure substrates degradation by cells.
 | (1) |
 | (2) |
The mathematical modeling of the mixed substrate microbial kinetics is sufficiently complex (Patnaik, 2000). When microorganisms grow at expenses of a mixture of substrates, some phenomena such as catabolite repression, induction and enzymatic inhibition must be considered. These phenomena promote sequential or simultaneous substrates utilization. Thus, the quantitative description of kinetics effects, including interaction of the benzene-toluene mixture, should be modeled by more complex models having into account competitive (Yoon et al., 1977), uncompetitive (Segel, 1975) and noncompetitive (Segel, 1975) inhibitions. In this work the sum of the kinetics parameters interactions - SKIP model (Yoon et al., 1977) was also used.
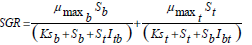
Assuming that the overall specific growth rate (SGR) can be expressed in an additive form of two individual specific growth rates, the system description can be described by Eq. 3.
 | (3) |
The specific growth rates of benzene and toluene mixture described by the competitive inhibition model are described by Eq. 4.
 | (4) |
In whereas specific growth rates on benzene and toluene, when the uncompetitive inhibition phenomenon is involved, can be described by Eq. 5.
 | (5) |
The specific growth rates on benzene and toluene, by applying the noncompetitive inhibition model is given by Eq.6.
 | (6) |
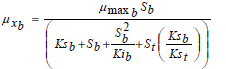
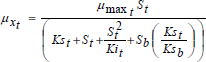
New findings in kinetics modeling show that when the iterations between substrates can not to be qualified, it is possible to model the system by the SKIP model. Applying the SKIP model, the benzene and toluene specific growth rates can be written by Eq. 7.
 | (7) |
All these unstructured models assume the hypothesis that experimental data are based only in microbial physiology. The biomass growth (Eq. 8) and the depletion of growth associated key substrates (Eq. 9-10) balance equations can be written as follows.
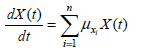 | (8) |
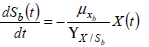 | (9) |
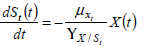 | (10) |
Hamed et al. (2003) conducted batch experiments for degradation of single substrates, where the initial biomass concentrations were 45 mg L-1 of benzene and 46.15 mg L-1 of toluene. For degradation of benzene-toluene mixture the initial biomass concentration was 16.36 mg L-1.
The model ordinary differential equations (ODE) were determined by substituting the different possible specific growth rate equations for single substrates degradation (Eqs. 1-2) and mixture substrates degradation (Eqs. 4-7) into Eqs. (8-10). Each ODE system (Eqs. 8-10) was numerically solved by using Maple® software by applying the fourth and fifth orders Runge-Kutta-Fehlberg (RKF45) algorithms.
Based on hypothesis about kinetics describing microbial behavior in the presence of single and multiple substrates, different working conditions were simulated and experimental data was analyzed.
B. Parameters Identification Procedure
The identification of model parameters can be considered as a key step in the model development procedure. In this work, Particle Swarm Optimization (PSO) was used to minimize differences between experimental and simulation results. Maple® was used to develop the PSO program. PSO is a global optimization procedure that was created by Kennedy and Eberhardt (2001). It is based on the social behavior of some animals. The PSO method was selected because it converges quickly to the global optimum, avoiding local optimum. Moreover, it is faster and easier to program than other optimization algorithms.
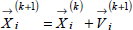
In the PSO method, each particle of the swarm can be represented by a vector that corresponds to a possible solution. Thus, each particle possesses a position and a velocity operator in the search space with a dimension equal to the number of parameters, which results in a swarm with a size equal to the number of particles. The particle position vector behaves under the restriction of three conditions (the current vector position; the best vector position determined by the particle and the best vector position determined by the swarm), that allow delimiting a geographically seeking space according to a linear vectorial combination, bringing out the particle to assume a new particle position vector. The current position of the particle, given by Eq. 11, with predetermined search range is used for initialization of the population.
 | (11) |
Figure 1 shows as the trajectory of a particle in a swarm is adjusted by using the velocity and position updates, according to Eq. 12.
 | (12) |

Fig.1 - Trajectory of the particle in the PSO.
The first term of Eq. 12 keeps each particle in the previous direction; the magnitude of this vector depends on the inertia factor (w), the variable that controls the degree of convergence of the search. The second and third terms represent the influence of the best individual position and the best position of the swarm, respectively. Their magnitudes depends on the values of the acceleration constants (c1 and c2) and on the variables (l1 and l2). The variables are normalized in the interval of 0-1 and they modify the velocities of the particles in each iteration, disrupting their trajectories in order to achieve a global optimum and avoiding local optima. The values of the constants used in the identification procedure were c1=1 and c2=2. An appropriate value for the inertia factor was obtained by applying Eq. 13, with winitial=0.9 and wend=0.4. From then, the particles move to new positions according to the Eq. 14.
 | (13) |
 | (14) |
When the specified number of iterations is reached, the best search solution is used as information in the procedure of restriction of the search space. In this step the parameters with high influence on the global objective function are restricted. The evaluation of the parameters sensitivity was done in the graphical mode by using Maple®. Moreover, the search for the best parameters values was guided by the microbiological meaning of each parameter and served as a base to predetermine the parameter search range, where the best evaluated values were preserved, after repeated searches and analysis of the obtained results.
The end of the search is determined based on the swarm best global position, where the search stop criterion is given by Eqs. 15 to 16.
 | (15) |
 | (16) |
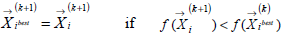
The scheme of the PSO algorithm is shown in Fig. 2. The following search parameters are pre-defined for a population initialization: number of individuals or particles, number of iterations, number of parameters, limit of search, factors of inertia and acceleration constants. Further step includes an evaluation of the objective function global minimum by using the nonlinear least squares regression analysis.
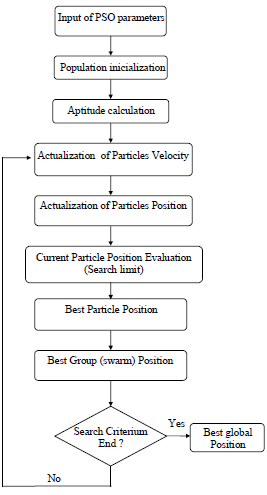
Fig.2 - Scheme of PSO algorithm.
An AMD Sempron computer 2.8 GHz and 512 MB of RAM memory was used to run the PSO method. For the objective function (Eq. 17) minimization, 300 vectors solution (particles) and 25 iterations were used.
 | (17) |
III. RESULTS AND DISCUSSION
The evaluation of the model efficiency was carried out on the objective function minimum value, which corresponds to the experimental data best fitting. The results obtained by using PSO global search method can be considered good. The minimum objective function values for each model describing pure substrate degradation are presented in Table 1, and for the benzene-toluene mixture in Table 2, respectively.
Table 1. Estimated parameter values on the base of experimental data for pure substrate and objective function 
Table 2. Estimated parameter values on the base of experimental data for mixture substrates and objective function 
The evaluated parameters values by PSO method are also shown in Table 1 for the biomass growth on single substrate, and in Table 2 for the biomass growth on the benzene-toluene mixture. During the search of stoichiometric and kinetics constants values by using PSO, the procedure was guided by the microbiological meaning and on this bases the range of parameters changes were determined and the best current constants values were preserved. The descriptions of the biodegradation process on pure substrate by using controls models of Monod (results not shown) and Andrews (Fig. 3-6) showed that the Andrews model gives more information about the system response, when initial concentration of toxic substrate is close to the toxic critical values (shown in Table 1).
Fig.3 - Benzene utilization profile.
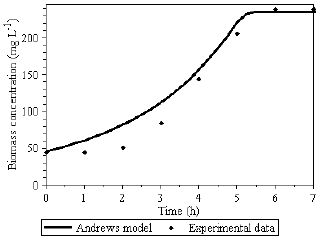
Fig. 4 - Biomass growth on benzene profile.
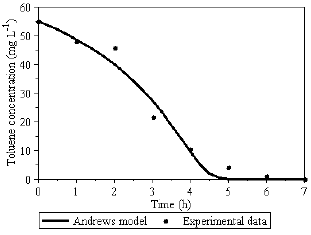
Fig. 5 - Toluene utilization profile.

Fig. 6 - Biomass growth on toluene profile.
Following the strategy to model the single substrates degradation and to compare them with simultaneous degradation of two toxic substrates mixture, the Andrews model was applied for the description of the system where benzene (Fig. 3 and 4) and toluene (Fig. 5 and 6) are used as single substrates.
Figures 3 to 6, illustrate that the deviation between the model and experimental data occurs mainly in the biomass concentration profile. As a key component of the system, the biomass experimental data have to be determined with special caution. It means that every assay for biomass experimental data have to be carried through duplicates, triplicates etc., to minimize standard errors. Especially important for the parameters identification procedure is the knowledge about the "exact" value of the initial biomass concentration X0.
This is one reason that may explain the difficulty in describing the biomass growth. The difficulty in evaluating the initial cells concentration is often reported (Chang, et al., 1993; Wang and Loh, 1999) and hence X0 has been estimated as an adjustable parameter in the biodegradation equations.
The inability of the models of Monod and Andrews to describe exactly the biomass growth during benzene utilization can be explained because of the inhibitory effect of the metabolic intermediate produced during the process. This difficulty was also reported by Reardon et al. (2000) which suggested the 2-hydroxymuconic-semialdehyde as intermediate.
Regarding the biodegradation of benzene-toluene mixture, it can be noted that the modified competitive inhibition model and the SKIP model fitted the experimental data well (shown in Table 2). However, the other evaluated models also showed good fit with experimental data, especially for substrate utilization, but not for the biomass growth.
The Andrews model was successfully applied to describe the set of experiments on single substrates taken from Hamed et al. (2003), for an initial concentration of 60 mg L-1 of benzene and a 55 mg L-1 concentration of toluene. The substrate inhibition effect occurred above 30 mg L-1 of benzene and 28 mg L-1 of toluene concentrations. Based on this observation, it was considered toadd the substrate inhibition term (S2/Ki) into the competitive inhibition model where the degradation of the benzene-toluene mixture takes place. Thus, the specific growth rates on the substrates mixture are given by Eqs. 18 and 19. Simulation results of benzene-toluene utilization and biomass growth in a mixture by the modified competitive inhibition model are shown in Figs. 7 and 8, respectively
 | (18) |
 | (19) |

Fig. 7 - Benzene-Toluene mixture utilization profile.
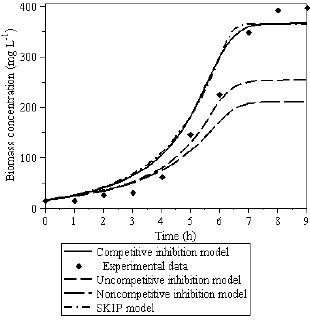
Fig.8 - Biomass growth on the benzene-toluene mixture.
First, the toluene concentration in the mixture is exhausted (see Fig. 7) and the remaining benzene concentration at the 6th hour is about 20 mg L-1. It means that the biomass growth after the 6th hour occurs only by utilizing this remaining toxic compound. One can assume that the catabolite repression mechanisms or other internal cell control tools and these mechanisms are not involved in this case, and the specific growth rates and yield coefficients on benzene and toluene are similar (Table 2).
Applying different and more sophisticated models for the description of the substrate mixture biodegradation the understanding about the system behavior is not changed. As one can see, the modified competitive inhibition model performs very well describing the benzene-toluene mixture utilization. The simulated biomass and substrates profiles differ from the experimental ones because of the prolonged lag phase (up to the 3rd hour) whose description is not taken into account in the kinetic models. Usually, in the wastewater treatment, the microbial adaptation to the toxic environment takes time and if the lag phase is long, the modeling efforts are concentrated on the point where the process starts. The indicator of the start-up has to be search in the substrates profile where the measurements of the initial substrates concentrations are more correct than the initial biomass concentration measurements.
Based on this understanding, it is possible to evaluate more precisely the differences between the models and experimental data. All the applied kinetic models to describe experimental data published by Hamed et al. (2003) have faced difficulties to fit biomass concentration profiles. However, the uncompetitive and noncompetitive inhibition models presented higher difficulties to describe the biomass growth, as presented in Fig.8.
The overall response of the SKIP model also captured the substrate interactions very well, as can be seen in Figs. 7 and 8, which can be explained by the influence of the interaction parameters and the saturation constant estimated (Iij,Ksb,Kst). If Itb=Ksb/Kst and Ibt=Kst/Ksb then the SKIP model can be reduced to the competitive inhibition model.
A support for the hypothesis about microbial degradation of the benzene-toluene mixture by Pseudomonas putida F1 (Hamed et al., 2003) is that the involved induced enzymes of this species may catalyze simultaneous utilization of similar substrates. The experimentaldata obtained by these authors show trend for si multaneous utilization of the benzene-toluene mixture. The preferable substrate species was toluene. Hence, the interpretation of Iij interaction coefficients has to be directed on phenomenon - internal metabolite interactions in multi-substrate environment (Chang et al., 1993; Oh et al., 1994; Reardon et al., 2000; Abuhamed et al., 2004; Jo et al., 2007). The parameters values estimated in this work by applying the SKIP model confirmed this behavior (Itb=5.00 and Ibt=0.20). It means that the inhibition degree of toluene on the benzene biodegradation is higher than the inhibition degree of the benzene on the toluene biodegradation. Abuhamed et al. (2004) estimated Itb=5.16 and Ibt=0.49 values and Reardon et al. (2000) estimated Itb=5.00±0.30 and Ibt=0.01±0.003 values.
The metabolic pathways of the aerobic biodegradation of toluene and benzene by Pseudomonas putida F1 (see Fig. 9) show that the common enzyme toluene dioxigenase (Tod) is involved in the catabolism of these compounds (Zylstra and Gibson, 1989), and based on this fact, a simultaneous biodegradation of the benzene-toluene mixture is possible as well. It means that a competition between substrates for the active sites of the enzyme can be involved, and this competition will depend on the substrates concentration ratio. For some particular ratios of substrates concentrations the competition can be involved and for other ratios the simultaneous utilization of the substrates will take place. The term which considers substrate inhibition in the competitive inhibition model shows good results, which are an evidence for the substrates interactions and the influence on microbial metabolite activity.
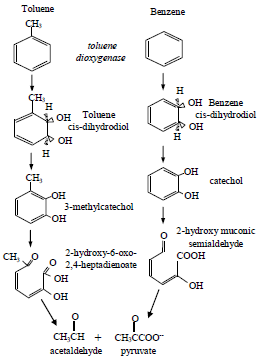
Fig.9 - Metabolic pathways of toluene and benzene in Pseudomonas putida F1.
Examples of Andrews model response to the pure substrate concentration influences are shown in Fig. 10. The critical substrate concentration (Eq. 20) and SGR maximum values (Eq. 21) are obtained by taking the first derivative on Eq. 2 and equalizing it to zero.
 | (20) |
 | (21) |

Fig. 10 - SGR simulation of P. putida F1 on benzene and toluene.
The maximum specific growth rate on benzene were determined to be 0.35 h-1 and 0.33 h-1 on toluene and their corresponding critical substrate concentrations values were 17.34 mg L-1 and 22.67 mg L-1, respectively (see Fig. 10).
The biodegradation efficiency is enhanced when it occurs simultaneous utilization of metabolic pathways. This intensification can be imputed to high rates of microbial growth and occurs due to nonspecific enzyme induction for the similar substrates biodegradation or due to the convergence of the metabolic pathway for the utilization of multi-substrate. In this case, the maximum specific growth rates on benzene and on toluene increased when both were used in mixture in comparison with the maximum specific growth on individual compounds, respectively (see Figs. 11 and 12). The values increased from 0.35 h-1 to 0.45 h-1 on benzene and from 0.33 h-1 to 0.44 h-1 on toluene.

Fig. 11 - SGR simulation of P. putida F1 on benzene-toluene mixture by modified competitive inhibition model (benzene is an inhibitor).

Fig. 12 - SGR simulation of P. putida F1 on benzene-toluene mixture by modified competitive inhibition model (toluene is an inhibitor).
According to the Fig. 11 as the toluene concentration increases, the SGR on benzene decreases. The same behavior is verified in the Fig. 12, i.e., as the benzene concentration increases, the SGR on toluene decreases. Quantitatively, this decrease is higher observed in the SGR on benzene, showing a higher degree of inhibition by the toluene.
IV. CONCLUSIONS
In this work, the biodegradation kinetic models were applied to describe the overall specific growth rate and the microbial physiology on toluene and benzene toxic compounds as pure substrates and in mixture. Particle Swarm Optimization was used in the parameter identification procedure, coded in the Maple® environment. The mathematical models evaluated and the kinetic parameters obtained fit successfully the experimental data from P. putida F1 activities. The simulation results show that the best description of the biodegradation process of pure toxic substrate can be achieved by the Andrews model. The biodegradation process of a mixture of toxic substrates is well modeled when the modified competitive inhibition and the SKIP models are applied. Additionally, the SKIP model quantifies successfully the interactions between benzene and toluene compounds during their biodegradation. The evaluation of the SGR models capacity to predict microbial behavior in the range of the operational conditions was performed by using surface response analysis. The developed methodology in this work can be considered as very efficient in the prediction of the biodegradation kinetics of mixed toxic compounds, and therefore, it can be sufficiently useful in the modeling of complex microbial activities where multiple substrates are involved.
| NOMENCLATURE | |
| Iij | interaction parameter (dimensionless) |
| K | number of iteration |
| Ks | saturation constant (mg L-1) |
| Ki | inhibition constant (mg L-1) |
| SGR | overall specific growth rate |
| Si | ith substrate concentration (mg L-1) |
 | simulated value of substrate concentration (mg L-1) |
 | experimental value of substrate concentration (mg L-1) |
 | maximum experimental value of substrate con-centration (mg L-1) |
| S* | substrate concentration at which specific growth rate is maximum (mg L-1) |
| X | biomass concentration (mg L-1) |
 | simulated value of biomass concentration (mg L-1) |
 | maximum experimental value of biomass con-centration (mg L-1) |
| YX/S | yield coefficient |
| t | time (h-1) |
 | current position vector for the ith particle |
 | new position vector for the ith particle |
 | current velocity vector for the ith particle |
 | new velocity vector for the ith particle |
 | best position vector for the ith particle |
 | best position vector of the group |
| Greek letters | |
| μx | individual specific growth rate (h-1) |
| μmax | maximum specific growth rate (h-1) |
| μ* | maximum value of μx at s* (h-1) |
| k | iteration |
| ω | inertia factor |
| Subscript | |
| b | benzene |
| t | toluene |
REFERENCES
1. Abuhamed, T., E. Bayraktar, T. Mehmetoglu and U. Mehmetoglu, "Kinetics model for growth of Pseudomonas putida F1 during benzene, toluene and phenol biodegradation," Process Biochem., 39, 983-988 (2004). [ Links ]
2. Bielefeldt, A.R. and h.d. Stensel, "Modeling competitive inhibition effects during biodegradation of BTEX mixtures," Water Res., 33, 707-714 (1999). [ Links ]
3. Brandt, B.W., F.D.L. Kelpin, I.M.M.V. Leeuwen and S.A.L.M. Kooijman, "Modelling microbial adaptation to changing availability of substrates," Water Res., 38, 1003-1013 (2004). [ Links ]
4. Chang, M.-K., T.C. Voice and C.S. Criddle, "Kinetics of competitive inhibition and co-metabolism in the biodegradation of benzene, toluene, and p-xylene by two Pseudomonas isolates," Biotechnol. Bioeng., 41, 1057-1065 (1993). [ Links ]
5. Deeb, R.A., H.-Y. Hu, J.R. Hanson, K.M. Scow and L. Alvarez-Cohen, "Substrate interactions in BTEX and MTBE mixtures by an MTBE-degrading isolate," Environ. Sci. Technol., 35, 312-317 (2001). [ Links ]
6. Fernandes, M., L.S.R. Brickus, J.C. Moreira and J.N. Cardoso, "Atmospheric BTX and polyaromatic hydrocarbons in Rio de Janeiro, Brazil," Chemosphere, 47, 417-425 (2002). [ Links ]
7. Hamed, T.A., E. Bayraktar, T. Mehmetoglu and U. Mehmetoglu, "Substrate interactions during the biodegradation of benzene, toluene and phenol mixtures," Process Biochem., 39, 27-35 (2003). [ Links ]
8. Harder, W. and L. Dijkhuizen, "Strategies of mixed substrate utilization in microorganisms," Philos Trans R. Soc. London B, 297:459-480 (1982). [ Links ]
9. Jo, M.-S., E.R. Rene, S.-H. Kim and H.-S. Park, "An analysis of synergistic and antagonistic behavior during BTEX removal in batch system using response surface methodology," J. Hazard. Mater., 152, 1276-1284 (2007). [ Links ]
10. Kennedy, J. and R.C. Eberhart, Swarm Intelligence, Morgan Kaufmann Publishers, San Francisco (2001). [ Links ]
11. Lin, C.W., Y.-W. Cheng and S.-L. Tsai, "Multi-substrate biodegradation kinetics of MTBE and BTEX mixtures by Pseudomonas aeruginosa," Process Biochem., 42, 1211-1217 (2007). [ Links ]
12. Oh, Y.-S., Z. Shareefdeen, B.C. Baltzis and R. Bartha, "Interactions between benzene, toluene and p-xylene (BTX) during their biodegradation," Biotechnol. Bioeng., 44, 533-538 (1994). [ Links ]
13. Patnaik, P.R., "Are microbes intelligent beings? An assessment of cybernetic modeling," Biotechnol. Advances, 18, 267-288 (2000). [ Links ]
14. Phelps, C.D. and L.Y. Young, "Biodegradation of BTEX under anaerobic conditions: a review," Advances in Agronomy, 70, 329-357 (2001). [ Links ]
15. Reardon, K.F., D.C. Mosteller and J.D.B. Rogers, "Biodegradation kinetics of benzene, toluene and phenol as single and mixed substrates for Pseudomonas putida F1," Biotechnol. Bioeng., 69, 385-400 (2000). [ Links ]
16. Segel, I.H., Enzyme kinetics, John Wiley & Sons, New York (1975). [ Links ]
17. Wang, S.-J. and K.-C. Loh, "Modeling the role of metabolic intermediates in kinetics of phenol biodegradation." Enzyme Microb. Technol., 25, 177-184 (1999). [ Links ]
18. Yoon, H., G. Klinzing and H.W. Blanch, "Competition for mixed substrates by microbial populations," Biotechnol. Bioeng., 19, 1193-1210 (1977). [ Links ]
19. Zylstra, G.J. and D.T. Gibson, "Toluene degradation by Pseudomonas putida F1: nucleotide sequence of the todC1C2BADE genes and their expression in Escherichia coli," J. Biol. Chem., 264, 14940-14946 (1989). [ Links ]
Received: June 14, 2008
Accepted: June 8, 2009
Recommended by Subject Editor: Orlando Alfano

