


Services on Demand
Journal

Article
 English (pdf)
 Article in xml format
 Article references
 Send this article by e-mail
Indicators
-
 Cited by SciELO
Related links
-
 Similars in
SciELO
Similars in
SciELO
Share

 Permalink
Latin American applied research
Print version ISSN 0327-0793
Lat. Am. appl. res. vol.41 no.2 Bahía Blanca Apr. 2011
ARTICLES
Testing of an opto-electronic sensor for the high-throughput measurement of seed spatial distributions
J. Coronel§, L. Ornella, P. Bulacio, G. Nardón and E. Tapia*
CIFASIS-CONICET, 2000 Rosario, Argentina.
Dto. de Mecánica, Univ. Nac. de Rosario, 2000 Rosario, Argentina
* Dto. de Electrónica, Univ. Nac. de Rosario, 2000 Rosario, Argentina
§ coronel@cifasis-conicet.gov.ar
Abstract - We present testing results of an intelligent opto-electronic seed sensor system allowing the high throughput measurement of seed spatial distributions. With this aim, we evaluate the correlation between actual and sensor estimated distances between seeds. The tests take into account two important features in farming performance: the planter speed and the sensor-soil distance. While the former one determines the man-hours required, the later one determines the feasibility of sensor mounting and its useful life. Results show that precise measurements can be obtained with the proposed sensor at typical planter speeds, even with the sensor on top of the drop tube.
Keywords - Precision Agriculture; Opto-Electronic; Seed Sensor; Embedded Microcontroller; Corn Crop.
I. INTRODUCTION
Precision Agriculture involves a broad spectrum of technologies (Scarlett, 2001). The aim of these technologies is the optimization of agriculture resources. In this paper, we focus on the optimization of sowing performance through the study of the Seed Spatial Distribution (SSD). It has been noted by many authors (Bragachini et al., 2002; Nielsen, 2006), that plant spacing variability, which can be estimated from SSDs, strongly affects yield crop.
A closely related quantity to the SSD, actually its inverse, is the Seed Rate (SR). Raw SR estimations are obtained using Opto-Electronic Seed Sensors (OESS) designed for counting the number of seeds within a predefined time window. Usually, rather large time windows are used, in the order of 9 [sec]. As a result, the precision of SR measurements depends on the variability on the planter speed: the larger the planter speed, the smaller the precision of SR measurements. Hence, the indirect estimation of SSDs from SRs is particularly limited. Aiming to overcome this problem, a OESS system for the precise measurement of SSDs was devised. Our approach is based on the distributed SSD measurement across a number of OESS units, in multiple seed lines, and a central unit to which all OESS units report (Fig. 1).

Figure 1: OESS System.
We build upon previous work of Steffen (1985) and Dragne et al. (1999). In particular, similarly to Steffen (1985) our system can deal with high SRs. In addition, similarly to Dragne et al. (1999), our system employs OESS units with embedded microprocessors. However, in our proposal, just standard hardware components are used. This is a key requirement for the design of low cost and highly scalable electronic devices.
In this paper, the testing results of core OESS units used in the proposed system are presented. OESS units were specifically designed for allowing the real tracking of a fixed number of seed events, i.e., we focus on the time between seed events instead of the number of seeds within a fixed time window. This feature allows, the system operation within a broad spectrum of SRs, and the real time measurement of SSDs.
The following functional constraints were considered in the design of core OESS units: (a) they must be able to accurately estimate local SSDs, and (b) they must be quite independent of their position and the planter speed. Point (a) is associated with the feasibility of overall OESS system. Point (b) is related to the installation of individual OESS units on the seed drop tube and the operation in real sowing environments (seed rate and planter speed).
Based on the above requirements, we present a correlation study between real and estimated SSDs at individual OESS units taking into account: i) OESS unit correlation vs. planter speed and ii) OESS unit correlation vs. OESS unit mounting position on seed drop tube. Preliminary results were presented in Coronel et al., (2008). In current work, we improve the experimental protocol regarding the minimization of sensor mounting effects on the seed trajectory. This paper is organized as follows. Section II reviews the OESS architecture and setting to measure SSD in lab. Section III shows the results of statistical analysis of the OESS measurements. Finally, section IV presents the conclusions and further work.
II. MATERIALS AND METHODS
A. Seed
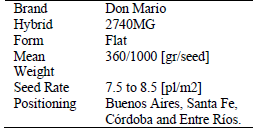
Due to the strong relationship between plant spacing variability of corn (Zea mays) and its yield (Bragachini et al., 2002; Nielsen, 2006), we tested our OESS design with corn seeds. Table 1 shows seed specifications used in lab tests. Our study was done over pneumatic seeder mechanism with straight drop tube.
Table 1: Corn Seed-Specification.
B. Test Bench
We study the performance of OESS unit independently of the seed meter operation events (variability, multiples and misses). The OESS unit was tested using a planter test bench with a mono-grain pneumatic system of positive pressure. To simulate the planter speed, the bench uses a grease coated canvas belt. The speed of the belt and the seed meter mechanism are controlled by engines and frequency inverters. The seed meter mechanism was equipped with a plaque model Small Flat Corn of 30 hollows.
The use of a test bench has the limitation of the length of the belt, in this case 9 [mt]. However, the SSD on the grease belt is influenced by the planter performance like real conditions, except for the bounce of seeds that are typically minimized by the grease on the belt. Plant factors such as the seed-bed preparation quality, weather conditions after planting, plant emergence efficiency are not considered in this study.
C. OESS System
Hardware
The following constraints on the hardware architecture of OESS units were considered: i) large capacity and powerful processing, and ii) integrated communication ports. For a fast prototype development a demo-board model DEMO9S08DZ60 was used. It is a test board for the MC9S08DZ to quick application development and has integrated USB-BDM[1]. It also includes some useful peripherals like RS-232 interfase and CAN 2.0B physical layer. This board allows checking the hardware using the same components selected in the design stage with a low investment. However, it needs an auxiliary board to complete the hardware. The auxiliary board contains: i) filters, amplifier and comparator to detect the seed signal; ii) keypad and display for setting firmware parameters, iii) CAN interfase and iv) fixed 5.0V regulator for the extra features. Additionally, to protect the hardware during the lab testing the I/O digital ports were connected through optocouplers. A simplified block diagram of the OESS architecture used for lab test is shown in Fig. 2, and in Fig. 3 is shown the lab and field prototypes of the OESS.

Figure 2: Block Diagram of OESS Hardware.
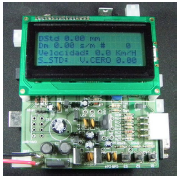
(a) Lab Prototype

(b) Field Prototype
Figure 3: OESS Prototypes
Firmware
The seed sensor firmware is a multi-process machine which manages events and executes the required tasks by a queue of events. The events are target by routines associated with specific process that run on parallel. Routines like timers and seed events control are programmed as high priority interrupts. In this way, all the routines are executed as real time. Figure 4 shows the general procedure of the seed sensor firmware. When an event is taken from the event queue the main program calls the specific routine associated with the target process.
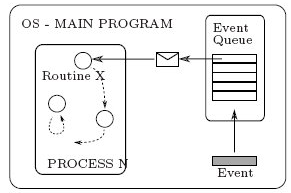
Figure 4: Simplified Diagram of Operating system of OESS unit.
D. Test procedure
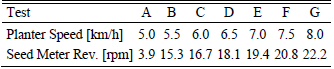
We use a typical seed rate of corn (Zea mays) and sunflower (Helianthus) crops in Argentine (Bragachini et al., 2002). All tests were performed with equal seed rate of 5 [seed/mt], i.e., a seed per 200 [mm]. Table 2 shows the planter speed used to evaluate the OESS performance, and the corresponding seed meter setting to provide 5 [seed/mt]. A total of 7 planter speeds were evaluated, trying to cover the velocities used in the field work.
Table 2: Test Bench Settings used to test the OESS unit.
Additionally, we evaluated the OESS unit performance according to its position on the seed drop tube. Three positions were considered: D1 = 7.5 [cm], D2 = 27.0 [cm] and D3 = 42.5 [cm], distances with respect to belt as shown in Fig. 5. The distance of the seed drop tube to the belt is 40 [mm] and the thickness of the grease is 8 to 10 [mm]. For each OESS unit position and planter speed were realized a set of 10 repetition.

Figure 5: Test Positions of OESS unit on the Seed Drop Tube.
Test procedure:
Step 1: Start the belt and the seed meter mechanism in stationary mode speed, e.g., a planter (belt) speed of 6 [km/h] and a seed meter revolution of 16.7 [rpm] (Table 2, test C).
Step 2: Turn on the turbine of the pneumatic seed meter to Start Sowing.
Step 3: When the first seed is arrived to the opposite side of the belt, turned off the bench.
The OESS unit records the delay between seeds, gap, into a memory buffer once a seed passes through the sensor. The buffered data is composed by: seed number, belt speed and gap time. After that, as soon as the OESS unit detects zero speed or a sow change state (eg. "no seed"), the buffer data is send to the PC. The SSD on the belt is used as a reference to corroborate the distribution estimated by OESS. Considering that measures are correct and seeds are not dropped out, the number of counted seeds by the sensor and the number of seeds over the belt could by different if: i) seed drops simultaneously, e.g., "double seed" where the sensor may fail the measure of some of them; or ii) if a "phantom" takes place, e.g, caused by electronic noise or seed scraps where the sensor may create a spurious measure.
The above procedure was used to evaluate the performance of the OESS unit for estimating SSDs under different sensor positions and the planter speeds.
E. Data analysis
Round seeds are usually recommended for the seed meter mechanism used in our testing protocol. However, in our case, seeds (DM 2740MG) are flat. This difference was used to add randomness to the seed distribution test.
The data analysis was performed as follows. First, we compared the histograms of the sensor data and the belt data, Fig. 6. After that, we analyzed the level of correlation between the sensor data and belt data, Fig. 7 and Fig. 8. The correlation was computed by the Spearman's Rank Correlation Coefficient. Spearman correlation analysis does not require assumptions about the probability distribution of the data. The InfoSTAT[2] and the R-Project3[3] software packages were used to perform the analysis.

Figure 6: Histograms of SSD for each OESS position, D1, D2 and D3. Fist row is the OESS data and second row is the belt data.
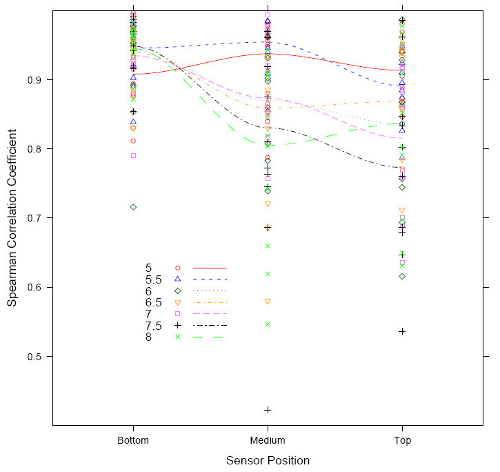
Figure 7: Spearman Correlation vs. OESS Position. Pa rameterized with planter speed, 5 to 8 [km/h]. Dots represents the Spearman correlation _ of all test and lines the LOESS regression of each set of repetitions.

Figure 8: Spearman Correlation vs. Planter Speed. Parameterized with OESS position, D1, D2 and D3. Dots represents the correlation r of all test and lines the LOESS regression of each set of repetitions.
III. RESULTS
A. Histogram analysis
A vertical scanning on the histograms of Fig. 6 shows the comparison among the real SSD (on the belt) and the estimated SSD (on the sensor). The horizontal scanning shows the SSD on three positions (OESS vs. the seed drop tube), which are independent of the planter speed.
These histograms display the following results:
- The OESS histograms look like the belt ones, which reflects a correct behavior of core OESS units.
- Main peaks are in the theoretical seed distribution (200 mm, 1 gap). Other two less important peaks replicate one seed fail (400 mm, 2 gaps) and two seed failures (600 mm, 3 gaps).
- The belt histograms show that the OESS units do not bother the drop course of seeds, i.e., the belt histograms are similar for the three positions of the OESSs.
- The sensor accuracy is increased when the OESS units are closed to the belt (D1). On the other hand, when OESS units are close to the seed meter mechanism (D3), the histograms mainly reflect the expected regular distribution of the seed meter output.
These observations confirm that i) the position of the sensor does not alter the SSD, and ii) the distribution of the sensor data and belt data are similar. As a result, the experimental behavior of OESS is correct. In the next section we will consider a deeper study of correlation between the sensor and belt data.
B. Correlation analysis
Figure 7 and Fig. 8 show the relationship between the sensor and belt seed distribution through the Spearman Correlation Coefficient (r). As expected, smaller distances to the belt and smaller planter speeds present higher r values. That is, when an OESS unit is closed to the belt and the planter speed is slow, the SSD caught by the OESS is almost that of the belt. In addition, we summarize the correlation analysis by LOESS (Locally Weighted Scatterplot Smoothing) regression between the test repetitions. Through these curves, we infer that a cut point related to the planter speed could exist: red and blue curves of Fig. 7 (5.0 and 5.5 [km/h]) show a low dependency with planter speed. However, for higher speeds is necessary to decrease the OESS position for keeping a high correlation. In these cases, the rebounds of seeds within drop tube change the seed speeds and their trajectories. Consequently, the estimations obtained far of the belt are expected to be less precise. In case of Fig. 8, the effect of the OESS position is the factor under analysis. Overall, the curves show that correlation is degraded when either the OESS distance to the ground or the planter speed are increased: the D1 position is almost independent of planter speed because of its proximity to the belt.
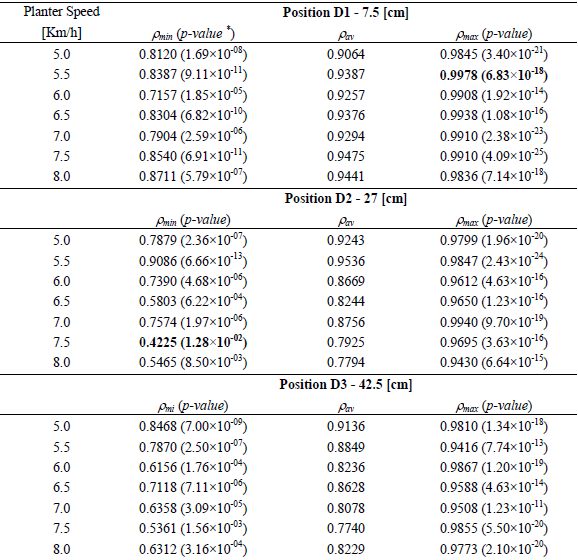
Table 3 shows the r behavior and corresponding p-value for a set of 10 evaluations. The r behavior is summarized by, its minimum value (rmin), its mean value (raverage), and its maximum value (rmax). All of r coefficients have a good p-value, i.e., the worst result r = 0.42 did not rejected the null hypothesis, it has a p-value = 0.0128. This result was obtained for the test F, repetition #1 and D2 location.
Table 3: Spearman Correlation Study Results
IV. CONCLUSION
The correlation analysis confirms that the core OESS units are precise. OESS units work well at a broad range of mean planter speeds, and they can be installed at the middle top of the drop tube. As expected, best correlation results were obtained for OESS units installed near to the ground and the slowest planter speeds. However, these conditions are not practically useful. In particular, the sensor cannot be installed in the foot of the tube. These results support future studies of the proposed OESS units in field work. Finally, simulation studies for evaluating CAN information traffic limits with regard to the number of OESS units are now in progress.
[1] Universal Serial Bus - Background Debug Mode.
[2] www.infostat.com.ar
[3] www.r-project.org
ACKNOWLEDGMENTS
We would like to thank to E. Bertini for the accessories of the seeder meter mechanism. This research is supported by the CONICET and the AGENCIA Argentina through the project PICT-02226.
REFERENCES
1. Bragachini, M., A.V. Martini, A. Mendez, F. Pacioni and M. Alfaro, "Siembra de maíz, eficiencia de implantación y su efecto sobre la producción de grano,".Proceedings of 3rd Taller de Agricultura de Precisióon del Cono Sur. IFAC, Carlos Paz, Cóordoba, Argentina (2002). [ Links ]
2. Coronel, J., G. Nardón, L., Ornella and E. Tapia, "Estimating the spatial seed distribution using sensors with embedded microprocessors: A correlationstudy," Proceedings of XXXVII Congresso Brasileiro de Engenharia Agrícola. CIGR, SBEA, ASABE, Iguassu Falls City, Parana, Brazil (2008). [ Links ]
3. Dragne, R., J. White and N. Tevs, Seed counting apparatus for a planter monitor, Pat. US5969340 (1999). [ Links ]
4. Nielsen, R., Effect of plant spacing variability on corn grain yield. Tech. rep., Pardue Univ. Agronomy Dept. URL www.agry.purdue.edu/ext/corn/research/psv/Report2005.pdf (2006). [ Links ]
5. Scarlett, A., "Integrated control of agricultural tractors and implements: a review of potential opportunities relating to cultivation and crop establishment machinery," Computers and Electronics in Agriculture, 30, 167-191 (2001). [ Links ]
6. Steffen, D., High rate seed sensor, Pat. US4555624 (1985). [ Links ]
Received: June 9, 2009.
Accepted: May 11, 2010.
Recommended by Subject Editor José Guivant.

