Servicios Personalizados
Revista
Articulo
Indicadores
-
 Citado por SciELO
Links relacionados
-
 Similares en
SciELO
Compartir
Anales de la Asociación Química Argentina
versión impresa ISSN 0365-0375
An. Asoc. Quím. Argent. v.94 n.1-3 Buenos Aires ene./jul. 2006
REGULAR PAPERS
New solubility models based on descriptors derived from the Detour Matrix
Talevi,a,b A.; Castro,b E. A.; Bruno-Blanch,a L.E.
a Medicinal Chemistry, Department of Biological Sciences, Faculty of Exact Sciences, La Plata National University, La Plata, Argentina.
b Research Institute of Theoretical and Applied Physical Chemistry (INIFTA), Department of Chemistry, Faculty of Exact Sciences, La Plata National University, La Plata, Argentina.
Fax: +54 221 425 4642, E-Mail: lbb@biol.unlp.edu.ar
Received April 28th, 2006. In final form May 15th, 2006
Dedicated to Prof. Imre G. Csizmadia on the occasion of his 75th birthday
Abstract
New molecular descriptors were derived from already-known descriptors obtained from the Detour Matrix (also known as Maximal Topological Distance Matrix or Maximum Path Matrix) and applied to the prediction of aqueous solubility of 46 structurally heterogeneous compounds, constructing one-variable models through linear regression. The correlation coefficients between these descriptors and the experimental values of solubility were compared to those obtained with more than 1,600 widely-used descriptors included in commercial software Dragon, confirming the very good performance of the proposed descriptors. The best-performance descriptors were then applied, in combination with Dragon's descriptors, to generate two five-variable models for the estimation of solubility. The F-Statistical and the p-value for this models confirmed high statistical significance. We also present the distribution of molecular weights, solubility values, number of H donors, number of H acceptors and number of heteroatoms for the 46 compounds employed, which show molecular diversity. The results indicate that the proposed descriptors can be applied in QSAR and QSPR studies.
Resumen
Nuevos descriptores moleculares fueron derivados de descriptores ya conocidos obtenidos a partir de la Matriz Detour (también conocida como Matriz de Distancias Topológicas Máximas o Matriz de Máximos Recorridos) y aplicados a la predicción de la solubilidad acuosa de 46 compuestos estructuralmente heterogéneos, construyendo modelos de una variable mediante regresión lineal. Los coeficientes de correlación entre estos descriptores y los valores de solubilidad experimental fueron comparados con aquellos obtenidos con más de 1600 descriptores de uso extendido incluidos en el software comercial Dragon, confirmando el muy buen desempeño de los descriptores propuestos. Estos descriptores fueron aplicados, en combinación con descriptores del software comercial, para generar modelos de cinco variables para estimar la solubilidad acuosa. El estadístico F y el valor p de estos modelos confirmaron alta significancia estadística. Se presenta asimismo la distribución de pesos moleculares, valores de solubilidad, número de donores de H, número de aceptores de H y número de heteroátomos para los 46 compuestos empleados, lo cual demuestra la diversidad molecular de los mismos. Los resultados indican que los descriptores propuestos pueden ser aplicados en estudios QSAR y QSPR.
Introduction
Although rational drug design has focused, in the past, on drug activity and potency, modern approaches can not obviate the importance of ADME (Absorption, Distribution, Metabolism, and Excretion) /Tox(toxicity) properties in a drug development cycle. This comes out from the fact that numerous active compounds that have shown to be successful at early phases of development usually fail in later stages because of unacceptable physical properties that jeopardize the drug bioavailability and its toxic profile. Modern approaches involve moving ADME/Tox evaluations into early discovery stages, such as lead identification and optimization, to be conducted in parallel with activity and selectivity assays [1].
Some years ago, Lipinski et al. derived, from the analysis of large databases of oral-bioavailable drugs, the famous Lipinski's "rule of five". It states that a compound in order to be potentially available through oral administration, has to accomplish at least three of the four following rules: molecular weight below 500, no more than five hydrogen bond donors, calculated octanol-water partition coefficient (clog P) below 5 and less than 10 hydrogen bond acceptors. If two or more parameters are out of range then a poor absorption or permeability is probable. [2] As we can easily observe, Lipinski's rule proposed that oral bioavailability supposes a balance between aqueous solubility of the drug and the ability of the compound to diffuse passively through biological barriers. Aqueous solubility governs both the rate of dissolution of the compound and the maximum concentration reached in gastrointestinal fluid. Although these two factors contribute to oral bioavailability (the flux of drug across the intestinal membrane is proportional to its concentration gradient between the intestinal lumen and blood), excessively polar compounds have problems at the stage of crossing through the gastrointestinal membrane and other biological barriers. Lipinski's rule does not apply to those compounds which are transported by active mechanisms.
From the previous exposure, it is clear that aqueous solubility is a critical factor to be taken into consideration in a drug development program. This property not only affects drug bioavailability. High aqueous solubility is associated to shorter metabolization and elimination times and, therefore, lower toxicity and side effects are expected in water soluble compounds. [3,4] This explains the high number of theoretic models that have been proposed in the past to predict aqueous solubility. [2,5-9]. From the early studies of Yalkowsky et al. [5] in the ´70s, several approaches which include thermodynamic calculations, group contribution approximations and multivariate linear models were introduced.
This work constitutes a contribution to this field. We tried to derive, from previously defined descriptors, new ones that somehow synthesized in a single number the various parameters of the Lipinski's rule of five. For this purpose we considered combinations of topological molecular indexes derived from the Detour Matrix and molecular features such as number of H donors, numbers of H acceptors and number of heteroatoms present in the molecule. Information on the Detour Matrix, definition of the new descriptors and their physicochemical sense, and validation of these descriptors is explained in the Experimental Section.
Experimental
Topological indices are descriptors derived from molecular representations called graphs. A graph is a hydrogen-depleted scheme in which atoms are represented as vertices and chemical bonds (no matter their nature: single, double or triple) are represented as simple edges. Many matrixes can be derived from the molecular graph, such as the Adjacency matrix A (in which each element aij is equal to 1 if i and j are adjacent vertices and equal to 0 otherwise) and the Distance matrix D (in which every entry dij represents the number of edges along the shortest path between i and j). [10]
The entries of the so-called Detour matrix DD, in the other hand, represent the maximum topological distances between two given vertices. It was first introduced by Harary in 1969, in the context of Graph Theory. [11] However, it was not introduced into chemical literature until 1994. [12] The use of the Detour Matrix was deflated, though, because until a few years ago there was no efficient method (but visual inspection) available to construct the matrix. Logically, when there is no cycle present in the considered molecular structure, the Distance and the Detour matrixes are identical. This is not the case when there is one or more rings in the molecule; therefore, the Detour Matrix has been proposed as a tool to characterize cyclic structures. [13] For illustrative purposes, Fig. 1 presents the graph associated to the chemical structure of toluene and the correspondent Distance and Detour Matrixes. Fig. 2 shows that both the Wiener index and the Detour index can also be descriptive of the degree of molecular ramification.
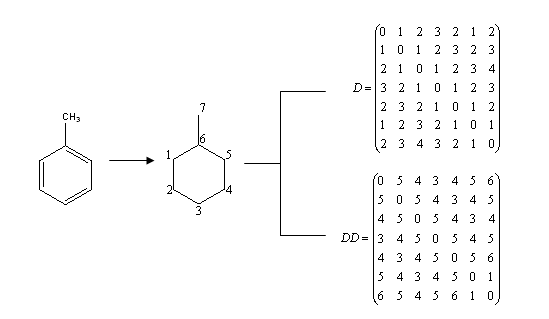
Fig. 1. Graph derived from toluene structure and Distance and Detour Matrix (D and DD, in that order) correspondent to toluene. Numeration of the graph is arbitrary, but topological indexes, as invariants, remain the same no matter the proposed numeration.
In the same way that the Wiener index is obtained from the half sum of the elements of the Distance Matrix, the Detour index dd is obtained from the half sum of the elements of the Detour Matrix, or, what is the same, from the sum of the matrix entries above the main diagonal. [12, 14]

Fig. 2. Detour matrices constructed from the molecular structures of n-pentane, neo and isopentane and detour index values associated to them. As can be appreciated, dd can be useful in the description of degree of ramification, which is related to several molecular properties (such as boiling point).
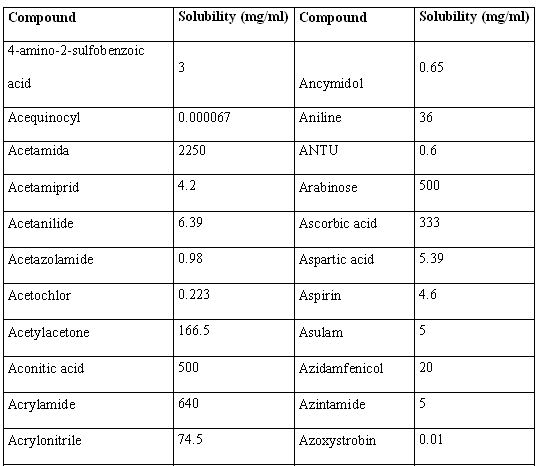
Molecular structures of the 46 compounds used in this study can be observed in Fig.3. Histograms showing the distribution of molecular weights, logarithm of the solubility (expressed in mg/ml) and other molecular features used in this study are presented in Fig. 4. Table 1 offers the solubility values of each of the compounds utilized in this study. The 46 structures of compounds, whose solubility at 25 °C had been experimentally measured, were extracted from the Merck Index 13th edition [15]; solubility values were checked in ChemIDplus [16], an online chemical database developed by the US National Library of Medicine (US NLM) containing 379,000 chemical records. Values for number of H donors and H acceptors were extracted from Pubchem database, also developed by US NLM [17]. Pubchem count of H donors and acceptors is based on a substructure- and partial-charge (Gasteiger sigma charges) classification of the acidity/basicity of the hydrogens in the structure. The method was derived from a standard force field atom type classification scheme. We preferred Pubchem calculation criteria, which take into account the chemical environment of each atom to define it or not as H donor or acceptor, over the one from Lipinski, who defined the number of donors as the mere sum of –OHs and –NHs in the chemical structure and the number of acceptors as the sum of Ns and Os. Lipinski himself accepted that this very simple calculation is a rough measure, especially of the H bond accepting ability, because of its´ variation across atom types. [2] From visual analysis of both figures 3 and 4 it can be stated that the 46 compounds selected for this study are structurally heterogeneous and that the studied property tends to a normal distribution along the ranges of values considered.


Fig. 3. Molecular structures of compounds

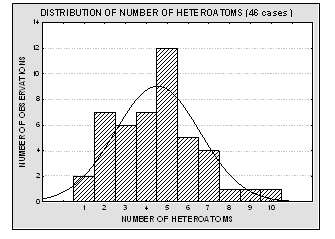
Fig. 4. Histograms showing the distribution of molecular weights, solubility values, number of H donors and acceptors and number of heteroatoms for the 46 molecules used in the present study. The modeled property (aqueous solubility) is well – distributed over more than four logarithmic units, and it tends to normal distribution. The experimental data is therefore acceptable for a QSPR study.
Table 1. Solubility values for the 46 structures used in the present work.

Plentiful literature was found which demonstrates linear, polynomial and exponential correlations between dd and the boiling point of alkanes, cycloalkanes and aromatic compounds. Good correlations between combinations of the Detour index and the Wiener index and boiling points were also found in literature. [14,18-21] Having in mind that the boiling point of compounds from homologous series usually correlates well with molecular weight (MW), we decided to investigate the relationship between the dd and the MWs of the 46 compounds used for the present study. Inspection of the correlation between dd and MW (Fig. 5) pushed us to explore possible relationships between the square and cubic roots of dd and the MW. For these and all posterior statistical analysis we employed the statistical package Statistica 7.0 [22]. Results of this analysis can be viewed in Fig. 5. It is noticeable that cubic root of dd, in the first place, and square root of dd, in second place, are quite better lineally correlated with the molecular weight of the 46 structures. The correlation coefficient obtained through the best polynomial fit between MW and dd was, although acceptable (r = 0.9380), is below those obtained through linear correlation with both square and cubic roots of dd.
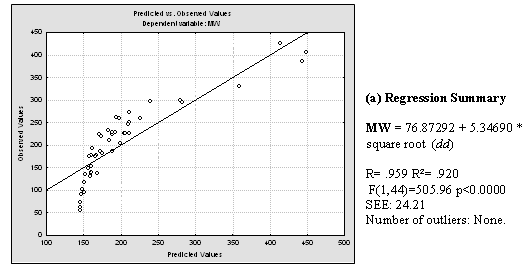


Fig. 5. a) Results of applying linear regression between MW and dd values for the 46 studied molecules. b) Idem for MW and the square root of dd and MW. c) Idem for MW and cubic root of dd. Regression data is showed next to the plot of predicted versus observed MW values.
It is clear that the Detour Index may be an appropriate descriptor to explain the differences in the aqueous solubility values that could be explained through the molecular weight of compounds (related to the first parameter in the Lipinski´s rule). However, there are a lot of examples of compounds that, although sharing the same graph and therefore the same topological indexes, have very different solubilities because of the other three parameters included in Lipinski´s rule (number of H donor and acceptors and log P). We may take as an example the compounds presented in Fig. 6.
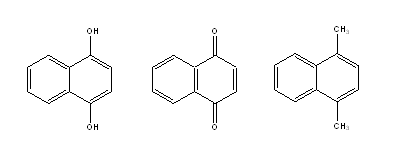
Fig. 6. Three molecules with very different expected solubility values but identical Detour index dd.
Very different solubility values may be expected for these three molecules (even though they have the same MW and identical Detour Matrix) based on the possibilities of each one to form H bonds. With the hope of including in one unique descriptor the other parameters considered by Lipinski, we defined the following descriptors:
D/D = dd/(D + 0.1)
D/A = dd/A
D/B = dd/( A+ D)
D/h = dd/h
where dd is, as already defined, the Detour Index; D is the total number of H donors in the considered molecule; A is the total number of hydrogen acceptors and h is the total number of heteroatoms. The 0.1 term in the D/D definition is introduced only to prevent dividing by 0, considering that several of the 46 molecules used do not have any H donor functional group. We also considered, having in mind the good correlation between MW and dd square and cubic roots, the square and cubic roots of the four descriptors above.
The physicochemical sense of these descriptors is immediately noticed. MW is directly correlated with dd and the solubility tends to decrease, in homologous series, when MW increases. The more H donor and acceptors present in the molecule the more water soluble the compound will be. If none H donor or acceptor is present in the molecule, the water solubility would be jeopardized or non existent (as is the case of alkanes). Therefore, the defined descriptors will take high values in compounds with slight aqueous solubility, while they will tend to extremely large values in non soluble compounds.
We calculated the above defined descriptors for the 46 structures considered. We compared the correlation coefficient of these descriptors with those obtained with 1,612 widely-used descriptors that can be calculated with the help of the commercial software Dragon. [23] Dragon is currently extensively used in QSAR and QSPR studies, [24-26] for what we believe the proposed comparison is adequate as one of the steps in the validation of the defined descriptors. We thought that if the defined descriptors outperformed the results of previously defined and widely used descriptors the suitability of these descriptors to develop new QSAR and QSPR models would be demonstrated (specially for the case of solubility-related models). We also compared the "Quality factor" Q, introduced some years ago by Pogliani for comparison of linear combination of connectivity indexes. [27, 28] Q is defined as the ratio between the correlation coefficient (r) and the standard error on the estimate (SEE). Results of these comparisons can be observed in Table 2.
Table 2. Correlation coefficients of the introduced descriptors and the logarithm of the experimental solubility values of the 46 compounds. We also present the correspondent "Quality factors". MaxD stands for the maximum element of the Detour Matrix. The ten descriptors calculated with Dragon that correlate best with the log s of the 46 compounds are showed, as long as their Q values. The same information is showed for mlog P. Dragon nomenclature was retained for the descriptors calculated with the commercial software.

Only 89 (5.5 %) of the 1612 descriptors calculated through Dragon have a correlation coefficient with the log (solubility) values above 0.80. In contrast, twelve of the descriptors we have defined in the present work and show good correlation coefficients above 0.84. Four of the defined descriptors correlate better than 100 % of the Dragon descriptors. All of them can be used to derive one-variable models whose SEE is below one logarithmic unit, which means a high percentage of the 46 molecules would be predicted within the actual order of magnitude. This is quite outstanding if we consider that the molecules used are structurally heterogeneous. The descriptor that showed best performance can explain, alone 79 % of the variance for the experimental data. Our descriptors' correlation with solubility is quite better than that of mlog P, a descriptor usually included in solubility models. This is reflected by the noticeable difference in r and q values. Among Dragon´s descriptors that correlated the most constitutional descriptors [29] and 3D-MoRSE signals [30].
Finally, we derived two five-descriptor models combining two of our best-performance descriptors (square root (D/h) and square root (D/B)) with Dragon descriptors. We checked the correlation between the descriptors included in the model in order to obey the non-redundant descriptors' principle. [31, 32] The two models generated were:
log (solubility mg/ml) = 2.7469 – 0.1619 square root (D/B) + 0.3960 C-006 – 21.5910 X5Av - 0.0719 mlogP2 + 0.1476 H-051
N = 46 r = .9442 r²= .8916 Outliers: 2 (4.4 %)
F(5,40)=65.78 p<.00000 SEE: 0.61
where C-006 corresponds to the number of CH2RX fragments present in the molecule (X being any heteroatom atom); X5Av corresponds to the average valence connectivity index of the fifth order; mlog P2 corresponds to the square of Moriguchi octanol – water partition coefficient and H-051 corresponds to number of H attached to alpha C.
log (solubility mg/ml) = 4.36396 – 0.13032 square root (D/h) + 0.66006 nOH – 1.35650 R1e - 0.08139 mlogP2 + 0.71426 nCconjR
N = 46 r = .9567 r² = .9152 Outliers: 2 (4.4 %)
F(5,40) = 86.35 p < 0.0000 SEE: .54
where nOH corresponds to the number of –OH present in the molecule; R1e corresponds to R autocorrelation of lag 1 weighted by Sanderson electronegativities; mlog P2 corresponds to the square of Moriguchi octanol-water partition coefficient and nCconjR corresponds to the number of exo-conjugated C.
From the p and F statistical values we can assure both models have high statistical significance, being able to explain about 90 % of the variance in the experimental data. The standard error on the estimate is quite below the logarithmic unit, with 80 % of the residuals below 0.5 logarithmic units in the first model and 90 % in the second. The number of outliers (cases with residuals outside +/- 2 SEE) is very low in both models.
Although we decided to generate five variables models, the ratio (number of variables in the model/number of cases) is quite small (almost 1/10). Provided that ratios below ¼ are considered acceptable, we could have included at least three extra variables in our models without jeopardizing the statistical significance (and the more variables included in the model, the smaller SEE and the higher r2 obtained). We decided for the principle of parsimony.
Conclusions
Based on the results, we can conclude that:
• A set of new descriptors with clear physicochemical meaning was introduced from simple operations over previously defined and validated descriptors. The definition of these descriptors was inspired in the popular Lipinski´s "rule of five".
• The ability of new descriptors to predict aqueous solubility was compared to that of 1,612 extensively-used. The correlation coefficient between the descriptors and the aqueous solubility values for 46 structurally heterogeneous compounds, and the quality factor r/SEE, were selected as comparison criteria. The performance of four of the new descriptors was above that of all the descriptors from the commercial software. The performance of the remaining new descriptors was very good, similar to that of the descriptors of the Dragon software with highest correlation coefficient.
• Two five-variable models for aqueous solubility combining the two best-performance new descriptors and some of the 1,612 Dragon descriptors were generated. These models explained about 90 % of the variance of the experimental data and presented SEE far below one logarithmic unit. This is even more significant if we do not forget the structurally heterogeneous training set.
We consider the descriptors defined as promissing for their application in QSAR and QSPR studies. Further work will focus on determining, with the analysis of oral-bioavailable drug databases, the range of the defined descriptors in which optimal bioavailability is observed.
Acknowledgments E. A. Castro is a member of CONICET, Argentina. L.E. Bruno-Blanch is a researcher of the Facultad de Ciencias Exactas, Universidad Nacional de La Plata. A. Talevi is a CONICET fellow. This work was supported by Agencia de Promoción Científica y Tecnológica (PICT 06-11985/2004) and Universidad Nacional de La Plata, Argentina.
References
[1] Yu, L.H.; Adedoyin, A. DDT. 2003, 8, 852. [ Links ]
[2] Lipinski, C. A; Lombardo, F.; Dominy, B. W.; Feeney, P. J. Adv. Drug Deliv. Rev. 2001, 46, 3. [ Links ]
[3] Hansch, C.; Bjorkroth, J. P.; Leo, A. J. Pharm. Sci. 1987, 76, 663. [ Links ]
[4] Smith, C. J.; Hansch, C. Food Chem. Toxicol. 2000, 38, 637. [ Links ]
[5]. Amidon, G. L; Yalkowsky, S. H.; Anik, S. T.; Valvani, S.C. J. Phys. Chem. 1975, 79, 2239. [ Links ]
[6] Katritzky, A. R.; Maran, U.; Lobanov, V. S.; Karelson, M. J. Chem. Inf. Comput. Sci. 2000, 40, 1. [ Links ]
[7] McFarland, J. W. J. Chem. Inf. Comput. Sci. 2001, 41, 1355. [ Links ]
[8] Klopman, G.; Wang, S.; Balthasar, D. M. J. Chem. Inf. Comput. Sci. 1992, 32, 474. [ Links ]
[9] Pogliani, L. J. Chem. Inf. Comput. Sci. 1996, 36, 1082. [ Links ]
[10] Devillers, J.; Balaban, A. T. Topological Indices and Related Descriptors in QSAR and QSPR. Gordon and Breach Science Publishers, 1999, pp 1-168. [ Links ]
[11] Harary, F. Graph Theory. Addison – Wesley, 1969. [ Links ]
[12] Ivanciuc, O.; Balaban, A. T. Commun. Math. Chem. 1994, 30, 141. [ Links ]
[13] Randic, M. J. Chem. Inf. Comput. Sci. 1997, 37, 1063. [ Links ]
[14] Trinajstic, N.; Nikolic, S.; Lucic, B. J. Chem. Inf. Comput. Sci. 1997, 37, 631. [ Links ]
[15] The Merck Index., An Encyclopedia Of Chemicals, Drugs, And Biologicals, 13th Ed. Merck & Co. Whitehouse Station, NJ, 2001. [ Links ]
[16] http://chem.sis.nlm.nih.gov/chemidplus/ChemIDplus . Toxicology and Environmental Health Information Program. U.S. National Library of Medicine. [ Links ]
[17] http://pubchem.ncbi.nlm.nih.gov/ Pubchem. U.S. National Library of Medicine. [ Links ]
[18] Lukovits, I. The Detour Index. Croat. Chem. Acta. 1996, 69, 873. [ Links ]
[19] Firpo, M.; Gavernet, L.; Castro, E. A.; Toropov, A. A. J. Mol. Structure (Theochem), 2000, 501-502, 419. [ Links ]
[20] Castro, E. A.; Tueros, M.; Toropov, A. A. Comput. Chem. 2000, 571. [ Links ]
[21] Devillers, J.; Balaban. A. T. Topological Indices and Related Descriptors in QSAR and QSPR. Gordon and Breach Science Publishers. 1999, 296. [ Links ]
[22] Statsoft, Inc. STATISTICA. Version 7.0. Tulsa, OK: Statsoft. 2004. [ Links ]
[23] Dragon Academic version is a product of Milano Chemometrics and QSAR research group, Milano, Italy. [ Links ]
[24] Fernández, M.; Caballero, J.; Morales Helguera, A.; Castro, E. A.; Pérez González. M.; Bioorg. Med.. Chem. 2005, 13, 3269. [ Links ]
[25] Gupta, M. K.; Sagar, R.; Shaw, A. K.; Prabhakar; Y. S. Bioorg. Med. Chem. 2005,13, 343. [ Links ]
[26] Puzyn, T; Falandysz, J. Atmospheric Environment. 2005, 39,1439. [ Links ]
[27] Pogliani, L.; J. Chem. Inf. Comput. Sci. 1996, 36,1082. [ Links ]
[28] Pogliani, L. ; J. Phys. Chem. 1994, 98, 1494. [ Links ]
[29] Broto, P.; Moreau, G.; Vandicke, C. Eur. J. Med. Chem. 1984, 19, 66. [ Links ]
[30] Schuur, J.; Selzer, P.; Gasteiger, J. J. Chem. Inf. Comput. Sci. 1996, 36,334. [ Links ]
[31] Yuanzhi Song, Jianfeng Zhou, Sanjun Zi, Jiming Xieb, Yong Yec. Bioorg. Med. Chem. 2005, 13, 3169. [ Links ]
[32] Xue, C. X.; Zhang, X. I.; Liu, M. C.; Hu, Z. D.; Fan. B. T. J. Pharmaceut. Biomed. 2005, 38, 497. [ Links ]


