


Servicios Personalizados
Revista

Articulo
 Inglés (pdf)
 Articulo en XML
 Referencias del artículo
 Enviar articulo por email
Indicadores
-
 Citado por SciELO
Links relacionados
-
 Similares en
SciELO
Similares en
SciELO  uBio
uBio
Compartir

 Permalink
Revista argentina de antropología biológica
versión On-line ISSN 1514-7991
Rev Arg Antrop Biol vol.21 no.2 La Plata jun. 2019
http://dx.doi.org/10.24215/18536387e006
doi:10.24215/18536387e006
TRABAJOS ORIGINALES
Cross-sectional study of child and adolescent growth in Ecuador
Estudio transversal del crecimiento infantil y de adolescentes en Ecuador
Wilmer Tarupi1 *, Yvan Lepage2, Roland Hauspie (†)3, Maria L. Felix1, Claude Monnier2, Joanne Campbell1, Mathieu Roelants4, Ricardo Hidalgo1 & Martine Vercauteren2
1 Facultad de Ciencias de la Salud Eugenio Espejo. Universidad UTE. Quito.Ecuador
2 Laboratoire d'Anthropologie et de Génétique Humaine. Université Libre de Bruxelles. Brussels. Belgium
3 Vrije Universiteit Brussel. Brussels. Belgium
4 Katholieke Universiteit Leuven. Leuven. Belgium
Financiamiento: Coopération Universitaire pour le Développement" (CUD) (Belgium) and the "Universidad UTE" (Ecuador).
* Corresponding a: Wilmer Alexander Tarupi Montenegro. MD, MSc (Epidemiology). Facultad de Ciencias de la Salud Eugenio Espejo, Universidad UTE. Avs. Occidental y Mariana de Jesús (s/n), Quito. Ecuador. E-mail: wtarupi@ute.edu.ec
Recibido: 16 Abril 2018
Aceptado: 5 Abril 2019
ABSTRACT
Child growth is internationally recognized as an important indicator for monitoring health in populations. There exists a wide controversy regarding the use of international growth standards versus local references. This study seeks to construct reference growth curves for school-age Ecuadorian children and adolescents, and to compare them with World Health Organization (WHO) standards, in order to identify the differences and their public health implications. The study authors enrolled 2891 children (1644 girls and 1247 boys) aged 5 to 18 years, from a variety of climatic zones and ethnic groups. LMS method was used to construct Ecuadorian curves for height, weight and Body Mass Index. Comparisons of Ecuadorian and WHO curves were graphically illustrated. U.S children were taller than Ecuadorian children across all age ranges, with larger differences between the two populations in children over 13 years. Consequently, estimates of low height and extremely low height, as well as overweight, obese and undernourished, were significantly different between WHO standards and the Ecuadorian references. Population-specific growth curves may be more adequate for growth monitoring of Ecuadorian children than WHO growth curves. We advocate for the construction of an Ecuadorian growth reference for clinical use based on national population, from conception to maturity, as an accurate instrument for monitoring growth.
KEY WORDS: body height; body mass index; growth charts; child; Ecuador
RESUMEN
El crecimiento infantil es reconocido internacionalmente como un indicador importante para monitorear la salud en las poblaciones. Existe una gran controversia con respecto al uso de estándares de crecimiento internacional versus referencias locales. Este estudio busca construir referencias de crecimiento para niños y adolescentes ecuatorianos, y compararlas con los estándares de la Organización Mundial de la Salud (OMS), para identificar las diferencias y sus implicaciones para la salud pública. Se incluyó 2891 niños (1644 niñas y 1247 niños) de 5 a 18 años de una variedad de zonas climáticas y grupos étnicos. El método LMS se utilizó para construir las curvas ecuatorianas de altura, peso e índice de masa corporal. Las comparaciones de curvas ecuatorianas y de la OMS se ilustraron gráficamente. Los niños de EE. UU., fueron más altos que los niños ecuatorianos en todos los rangos de edad, con mayores diferencias entre las dos poblaciones en niños mayores de 13 años. En consecuencia, las estimaciones de baja altura y altura extremadamente baja, así como sobrepeso, obesidad y desnutrición, fueron significativamente diferentes entre los estándares de la OMS y las referencias ecuatorianas. Las curvas de crecimiento específicas de la población pueden ser un parámetro de monitoreo del crecimiento para niños ecuatorianos más adecuado que las curvas de crecimiento de la OMS. Abogamos por la construcción de una referencia de crecimiento ecuatoriana para uso clínico basada en la población nacional, desde la concepción hasta la madurez, como un instrumento preciso para monitorear el crecimiento.
PALABRAS CLAVE: estatura; índice de masa corporal; gráficos de crecimiento; niños; Ecuador
Understanding variation in human growth and development has long been a primary objective in the fields of human biology and public health (Tanner, 1981; WHO 1995). Moreover, from a life-cycle perspective of social and health inequalities, global efforts to improve early childhood growth are acknowledged and motivated by its consequences on survival, cognition, and productivity into adulthood. Increasing public health concerns regarding childhood obesity, and the implementation of growth standards for children under 5 years of age created the need to develop an appropriate single growth reference for screening, surveillance and monitoring of growth for school-age children and adolescents (de Onis et al., 2007a). Due to the heterogeneity of data sets worldwide, the World Health Organization (WHO) decided to reconstruct the 1977 National Center for Health Statistics (NCHS)/WHO growth references from 5 to 19 years (Hamill, Driz, Johnson, Reed & Roche, 1977), using the original sample and applying the Box-Cox power exponential (BCPE) method (de Onis et al., 2007a, b). Therefore, WHO curves are not "international", but from a specific country (USA) with a high obesity index (Lejarraga, 2007a). The new standards adopt a fundamentally prescriptive approach designed to describe how all children should grow, rather than the more specific and accurate goal of describing how children grow at a specific time and geographic place.
A much-debated topic is whether a growth chart should be local, national or international (Milani et al., 2012). Some authors agree with the use of international standards (Johnston, 1986), while others argue that estimating prevalence of malnutrition in certain populations and providing an accurate nutritional assessment of specific individuals may be difficult, suggesting, when possible, constructing new reference values, using local standards from subjects with a similar genetic composition (Cameron, 1986; Marrodán, 2005). Furthermore, anthropometric measurements are greatly influenced by genetic (Hauspie, 1998, 2003; Hauspie, Das, Prece & Tanner, 1982; Mueller, 1986), sociocultural (Bielicki & Waliszko, 1991; Skuse, 1998), nutritional, environmental, and economic factors (Bustos, Amigo, Muñoz & Martorell, 2001; Habicht, Martorell, Yarbrough, Malina & Klein, 1974; Monnier, Vercauteren & Susanne, 2003; Monnier et al., 2011; Tanner, 1986; Vercauteren, 2005). Under this premise, many Latin-American countries have developed their own growth chart references, and have made a decision about the usefulness of prescriptive estimates (Duran et al., 2016; Lejarraga, 2007a, b; López, Izaguirre & Macías, 2013).
In general, most growth research published by human biologists can be assigned to one of three subjects. The first topic includes questions about how children grow, and about normal variation and growth variation between populations (Duran et al., 2016); the second, on the evolutionary, environmental, intergenerational, biocultural, genetic and other factors that affect the growth process (Alwasel et al., 2013); and the third, on the consequences of certain growth traits and growth patterns (Ruiz-Castell et al., 2013). In line with the last topic and taking into account the scarce information about growth in Ecuador, we aim to construct reference growth curves for school-age Ecuadorian children and adolescents, and compare them with World Health Organization (WHO) standards, in order to identify the differences and their public health implications and consequences. Ecuador is one of the most ethnically diverse countries in the world, and contains the most varied ecosystems. This reality can raise concerns regarding the anthropological characteristics of its inhabitants and also, in relation to the instruments to be used in the diagnosis of growth and nutritional status of children and adolescents.
The objectives were to construct reference growth curves for height, weight and Body Mass Index (BMI), for school-age Ecuadorian children and adolescents, and compare them with WHO standards.
MATERIALS AND METHODS
Population
These reference growth curves are based on primary data collected between 2012 and 2013, in five provinces of Ecuador. The target population of this study was comprised of children and adolescent students aged 5 to 18 years living in Tulcán, Quito (Andean region), Santa Elena (Coast region) and Tena (Amazon region), covering different climatic zones and different ethnic groups inhabiting the three regions. The study sample comprised 2891 children (1644 girls and 1247 boys) (Table 1). The measurements were obtained in private and public schools.
TABLA 1. Participant distribution by sex and age group. (After doing sensitivity and restriction analysis)
| Age (y) | Girls | Boys | Total |
| 5+ | 37 | 31 | 68 |
| 6+ | 90 | 64 | 154 |
| 7+ | 84 | 65 | 149 |
| 8+ | 153 | 71 | 224 |
| 9+ | 110 | 91 | 201 |
| 10+ | 159 | 111 | 270 |
| 11+ | 160 | 105 | 265 |
| 12+ | 191 | 160 | 351 |
| 13+ | 163 | 135 | 298 |
| 14+ | 138 | 128 | 266 |
| 15+ | 126 | 94 | 220 |
| 16+ | 115 | 88 | 203 |
| 17+ | 95 | 79 | 174 |
| 18+ | 23 | 25 | 48 |
| Total | 1644 | 1247 | 2891 |
Study inclusion criteria were:
-
boys and girls born in Ecuador,
-
aged between 5 and 18 years, and
-
currently enrolled in educational institutions.
Participants were recruited using a stratified random sampling according to age, sex, educational institution and place of living. The study was preceded by a formative stage of training of medical students in body measurements.
The physical measures were obtained following conventional methods according to the biometric techniques proposed by WHO (WHO, 1995). Height was measured to the nearest 1.0 mm using a portable stadiometer. Weight was measured to the nearest 0.1 kg using a digital scale. Date of birth was available for most participants from official school records. Age and socio-demographic information were given by parents and adolescents. The data were digitalized and subjected to a thorough quality analysis. Suspect values (due to rare occasions of measurement error, or typing errors) were eliminated or corrected (wherever possible). The data were subjected to sensitivity and restriction analyses of outliers, only after this rigorous verification and correction. To avoid the influence of unhealthy measurements, observations falling above +3 SD and below -3 SD of the sample median were excluded, prior to constructing the references. For the indicator height-for-age, 3 boys, and 9 girls had extreme outlier height measurements that were set to missing in the data set. For the weight-based indicators (i.e. weight for-age and BMI-for-age), the same cleaning approach was used. As a result, 12 observations for boys (0.7%) and 30 observations for girls (1.8%) were excluded.
WHO standards
The WHO growth curves are based on three data sets from two national surveys in children and adolescents from the United Stated, performed from 1971 to 1975. The first and second data were from the Health Examination Survey (HES) Cycle II (6 - 11 years) and Cycle III (12 - 17 years). The third data set was from the Health and Nutritional Examination Survey (HANES) Cycle I (birth to 74 years), from which only data from the 1 to 24 years of age-range were used. The total sample size was 22,917 (11,410 boys and 11,507 girls). The Box-Cox transformation method was used to reconstruct the curves (Hamill et al., 1977; de Onis et al., 2007a).
Data analysis
The LMS method was used to construct the curves; it is based on the use of Box-Cox transformation to normality through the calculations of a skewness parameter. The LMS parameters are the power in the Box-Cox transformation (L), the median (M), and the generalized coefficient of variation (S). Given these parameters, and the assumption that the residuals follow a normal distribution, any desired percentile can be calculated. The method assumes that the data can be normalized by using a power transformation, which stretches one tail of the distribution and shrinks the other, removing the skewness. The optimal power to obtain normality is calculated for each of a series of age groups and the trend summarized by a smooth (L) curve. Trends in the mean (M) and coefficient of variation (S) are similarly smoothed. These curves are subsequently estimated through an iterative algorithm using penalized cubic splines, where the degree of smoothing is determined by assigning a number of equivalent degrees of freedom (EDF). The resulting L, M and S curves contain the information to draw any centile curve and to convert the measurements (even extreme values) into standard deviation score (SDS or Z-score), which can be used to test the normality assumption, and, if the data are normally distributed after transformation, more extreme centiles can be estimated with reasonable accuracy. (Cole, 1989; 1990; 1995; Cole & Green, 1992).
The appropriate number of equivalent degrees of freedom was selected as described by Pan & Cole (2004), based on deviance (Cole & Green, 1992) and Q-tests (Royston and Wright, 2000; van Buuren & Fredriks, 2001). Conventional Q-Q plot of the residuals of weight, height and BMI by sex are presented in Figures 1 and 2.
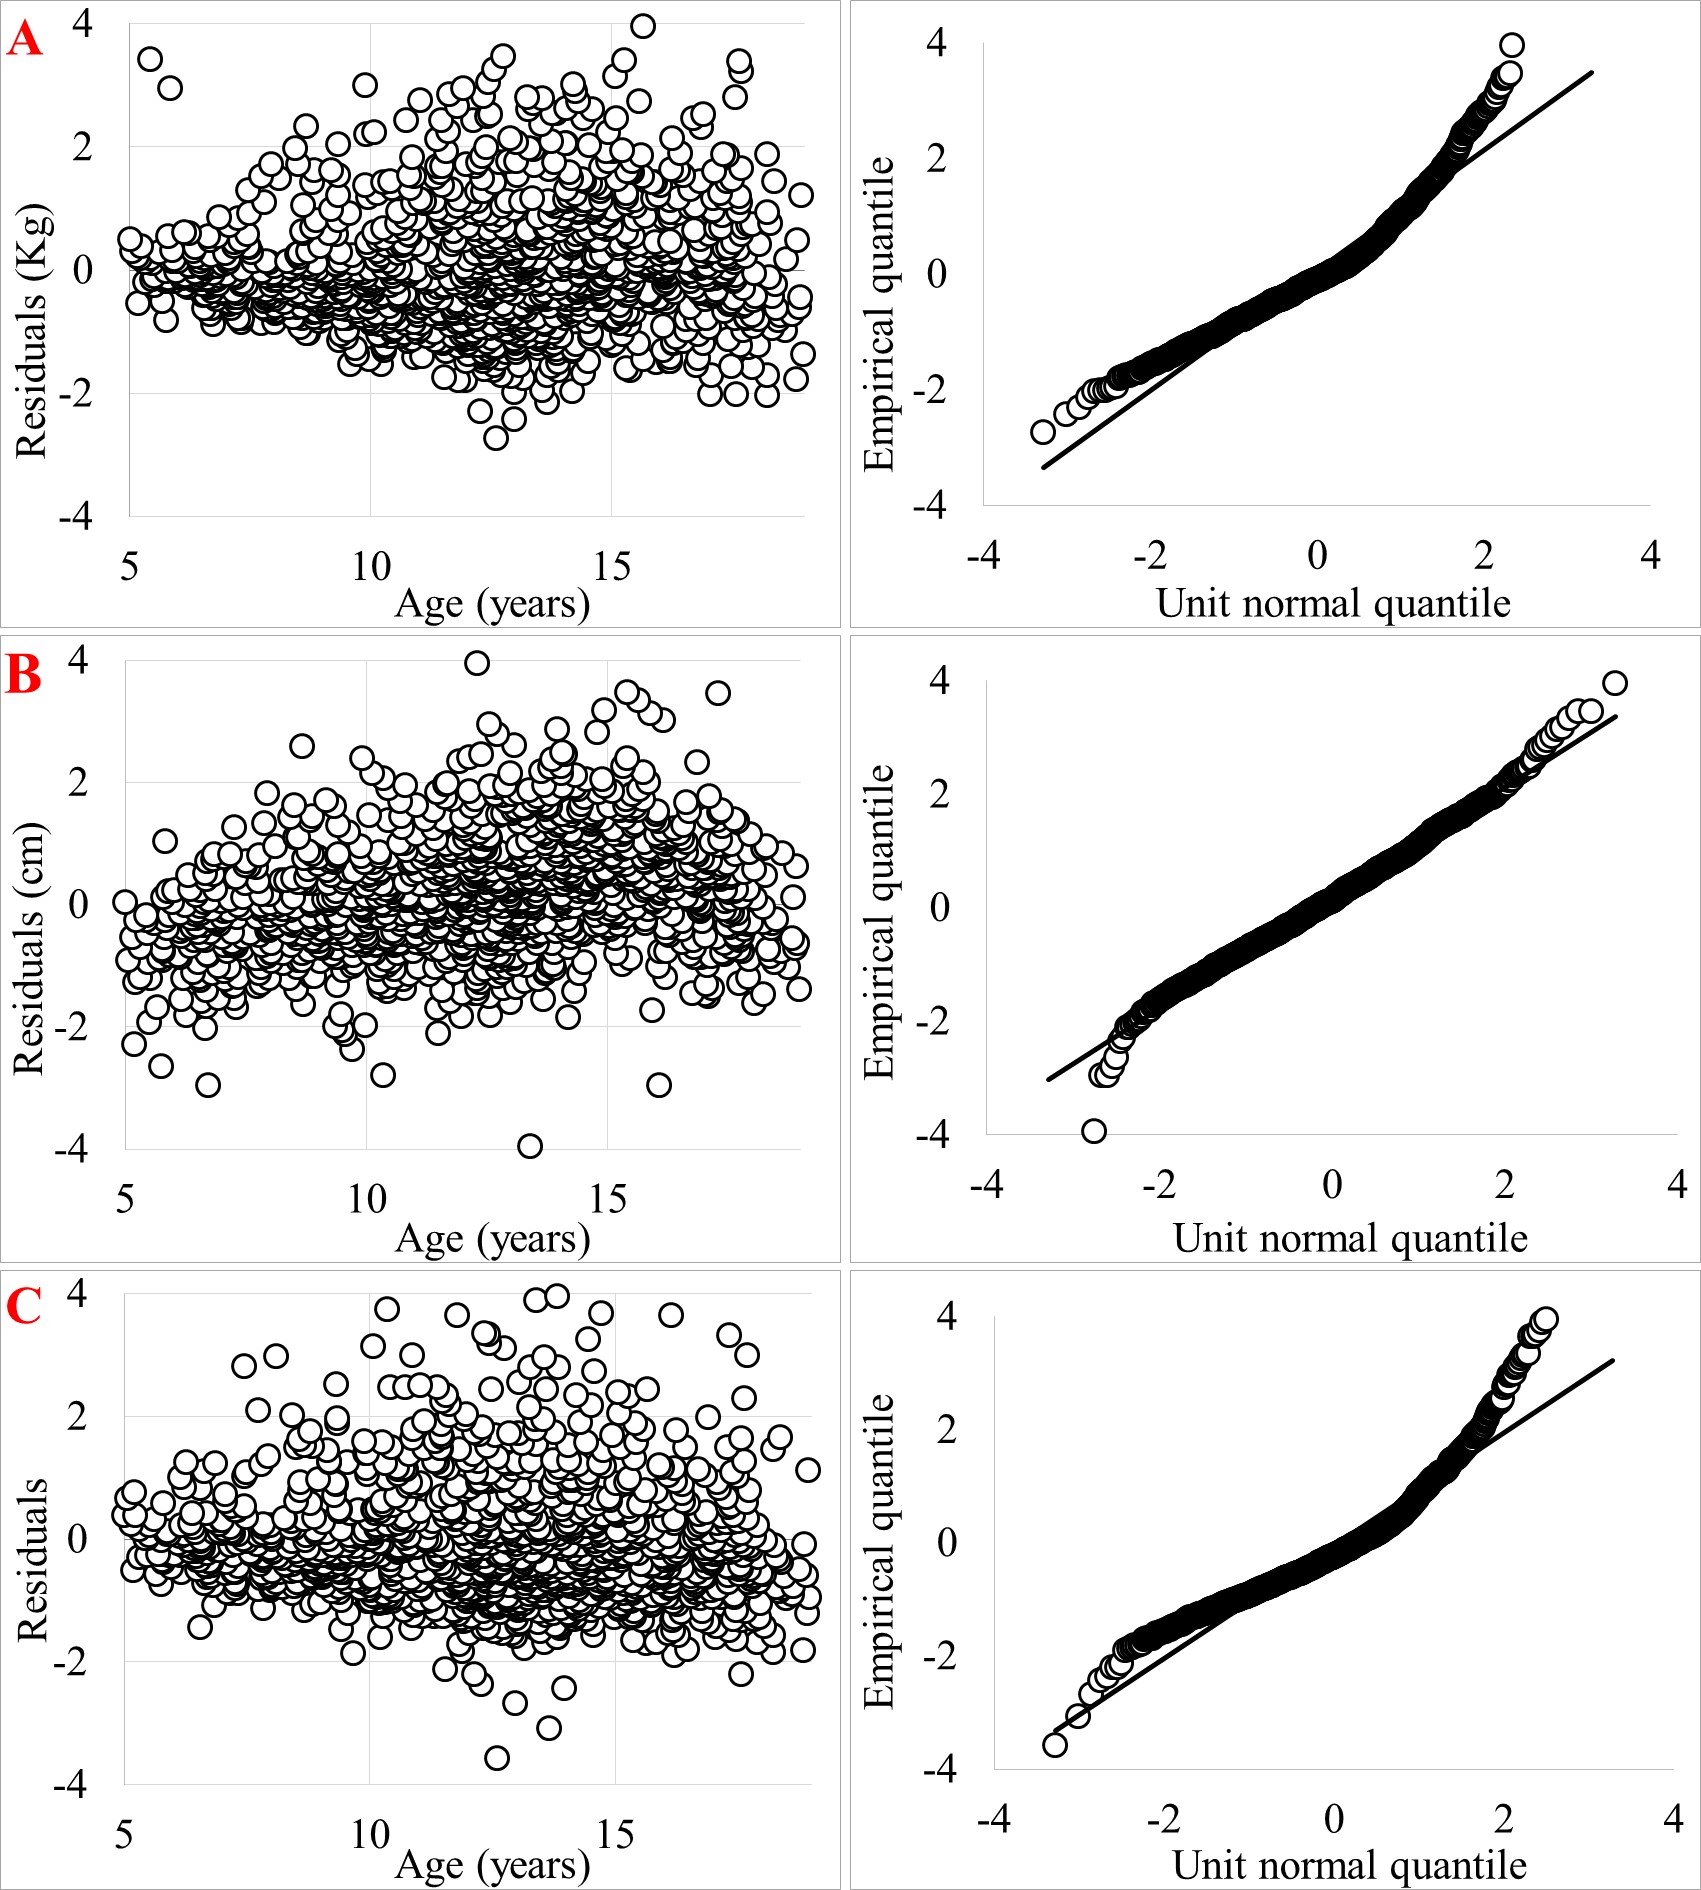
Fig. 1. Conventional Q-Q plot of the residuals of weight (A), height (B) and BMI (C). Boys.

Fig. 2. Conventional Q-Q plot of the residuals of weight (A), height (B) and BMI (C). Girls.
Ecuadorian references and WHO standards for girls and boys, including height-for-age, weight-for-age and BMI were compared. The weight comparison was only performed for the 5-10 years old group, because there is no weight-for-age curve beyond this age within the WHO growth standards (de Onis et al., 2007a).
According to the definitions of WHO growth indicators: Low height is considered < 2 Z-score in height-for-age curve; Extremely low height < 3 Z-score in height-for-age curve; Underweight< 2 Z-score in weight-for-age curve (children from 5+ to 9+ years old); Extremely Underweight < 3 Z-score in weight-for-age curve (children from 5+ to 9+ years old); Thin < 2 Z-score in BMI curve; Severely Thin< 3 Z-score in BMI curve; Overweight > 2 Z-score in BMI curve and, Obesity > 3 Z-score in BMI curve (WHO, 2006). In order to compare the results, we decided to use these definitions, as well as to present the growth curves in terms of Z-scores.
Ethical considerations
The study protocol conforms to the ethical guidelines of the 1975 Declaration of Helsinki and was approved by both partner institutions’ ethics committees: The Belgian "Commission Universitaire pour le Développement" (CUD) and the Ecuadorian "Universidad UTE" (UTE) Review Board. All participants were enrolled via verbal and written informed consent.
RESULTS
Z-score curves for height, weight, and BMI from age 5 to 19 years are plotted by sex in Figures 3, 4, 5, 6, 7 and 8. Tables of Z-scores accompanying LMS parameters are presented in Tables 2, 3 and 4.
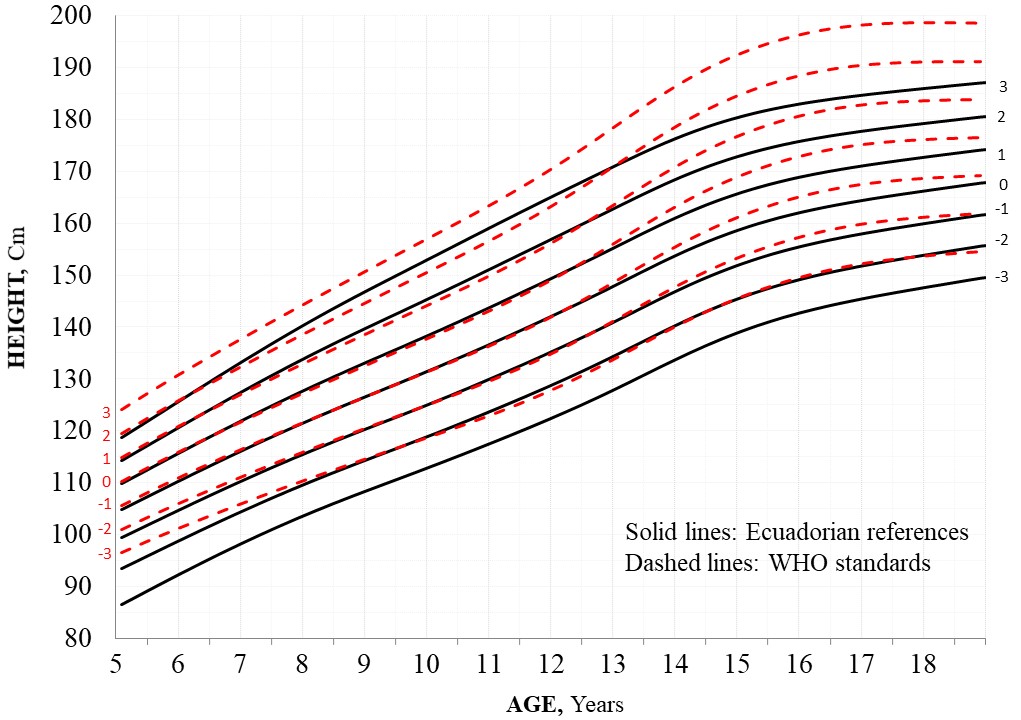
Fig. 3. Height-for-age [Z-scores] curves for boys - Ecuador and WHO comparison.
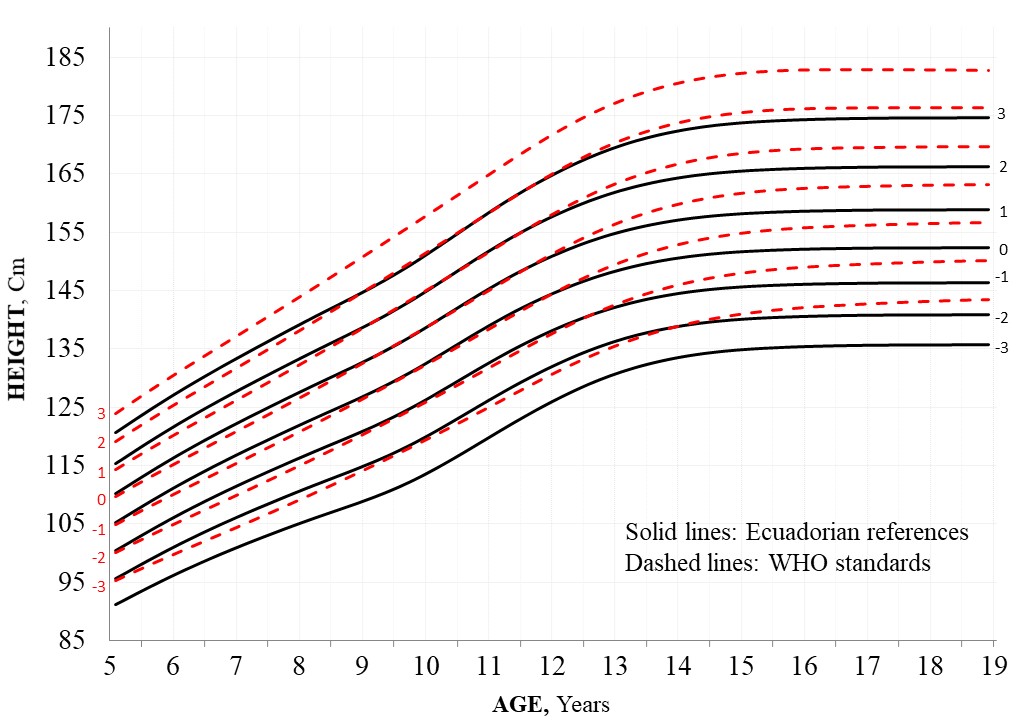
Fig. 4. Height-for-age [Z-scores] curves for girls - Ecuador and WHO comparison.
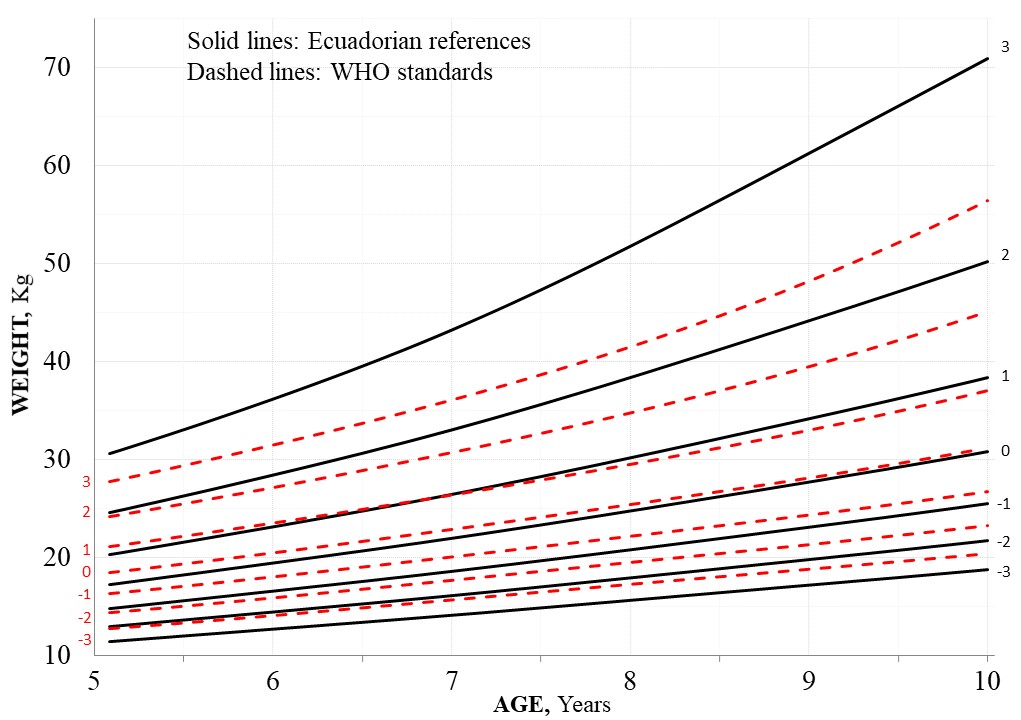
Fig. 5. Weight-for-age [Z-scores] curves for boys - Ecuador and WHO comparison.
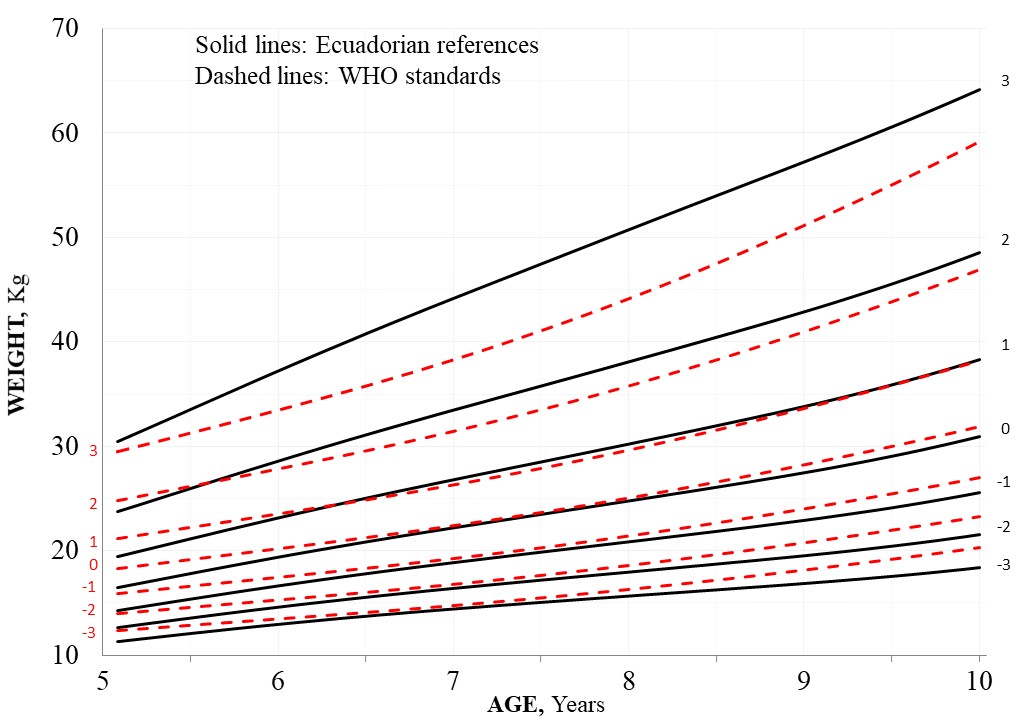
Fig. 6. Weight-for-age [Z-scores] curves for girls - Ecuador and WHO comparison.
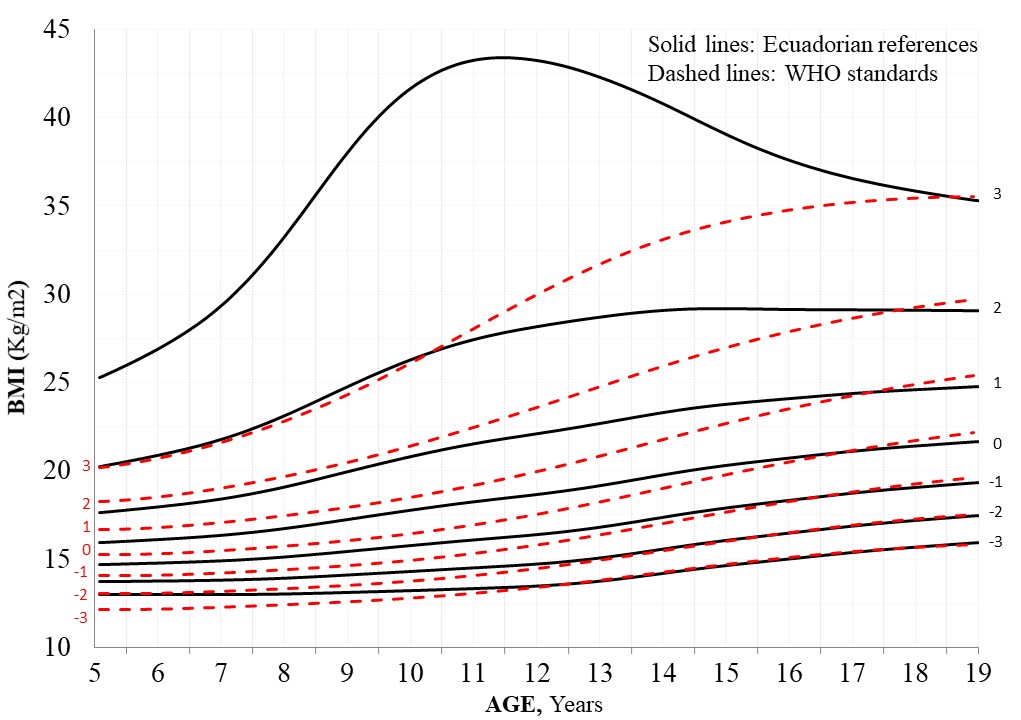
Fig. 7. Body Mass Index [Z-Scores] curves for boys - Ecuador and WHO comparison.
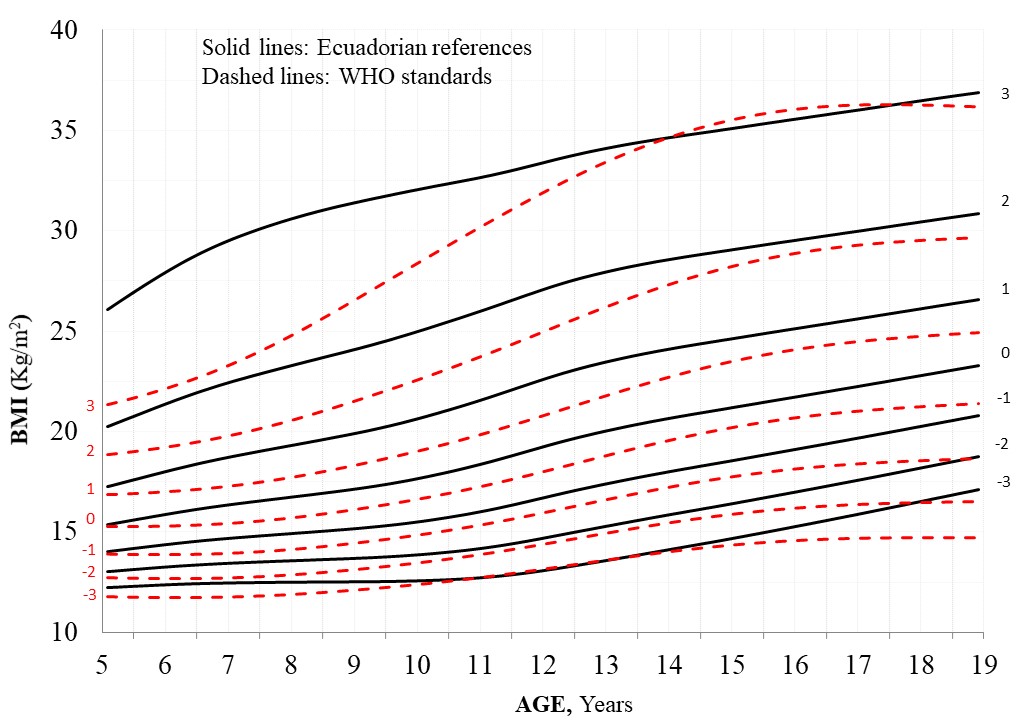
Fig. 8. Body Mass Index [Z-Scores] curves for girls - Ecuador and WHO comparison.
TABLA 2. Height for age in boys and girls. Z-scores and LMS parameters
| Age | L | S | M | -3 | -2 | -1 | 1 | 2 | 3 |
| Boys | |||||||||
| 5+ | 1 | 0.052 | 105.4 | 93.2 | 97.1 | 101.2 | 109.7 | 114.3 | 118.9 |
| 6+ | 1 | 0.048 | 110.7 | 97.4 | 101.7 | 106.1 | 115.6 | 120.7 | 126.0 |
| 7+ | 1 | 0.048 | 116.1 | 101.6 | 106.2 | 111.0 | 121.4 | 127.1 | 133.1 |
| 8+ | 1 | 0.048 | 121.3 | 105.7 | 110.6 | 115.8 | 127.2 | 133.4 | 140.1 |
| 9+ | 1 | 0.049 | 126.3 | 109.6 | 114.8 | 120.4 | 132.6 | 139.4 | 146.7 |
| 10+ | 1 | 0.050 | 131.3 | 113.5 | 119.0 | 125.0 | 138.0 | 145.2 | 152.8 |
| 11+ | 1 | 0.051 | 136.5 | 117.7 | 123.6 | 129.9 | 143.5 | 151.0 | 158.9 |
| 12+ | 1 | 0.053 | 142.0 | 122.3 | 128.6 | 135.1 | 149.3 | 156.9 | 164.8 |
| 13+ | 1 | 0.054 | 147.9 | 127.6 | 134.1 | 140.9 | 155.2 | 162.7 | 170.6 |
| 14+ | 1 | 0.052 | 153.8 | 133.4 | 140.0 | 146.8 | 161.0 | 168.3 | 175.9 |
| 15+ | 1 | 0.050 | 158.7 | 138.5 | 145.1 | 151.8 | 165.6 | 172.6 | 179.8 |
| 16+ | 1 | 0.043 | 162.1 | 142.3 | 148.8 | 155.4 | 168.7 | 175.5 | 182.2 |
| 17+ | 1 | 0.041 | 164.4 | 145.0 | 151.5 | 157.9 | 170.9 | 177.4 | 183.9 |
| 18+ | 1 | 0.040 | 166.3 | 147.2 | 153.6 | 160.0 | 172.6 | 178.9 | 185.1 |
| 19+ | 1 | 0.042 | 168.0 | 149.2 | 155.5 | 161.8 | 174.1 | 180.2 | 186.3 |
| Girls | |||||||||
| 5+ | 1 | 0.052 | 105.5 | 85.6 | 93.5 | 100.0 | 110.3 | 114.6 | 118.5 |
| 6+ | 1 | 0.049 | 111.2 | 91.4 | 99.0 | 105.5 | 116.3 | 120.9 | 125.2 |
| 7+ | 1 | 0.042 | 116.7 | 97.1 | 104.4 | 110.8 | 122.1 | 127.1 | 131.7 |
| 8+ | 1 | 0.044 | 121.8 | 102.3 | 109.3 | 115.7 | 127.5 | 132.8 | 137.9 |
| 9+ | 1 | 0.044 | 126.7 | 107.2 | 114.0 | 120.5 | 132.7 | 138.4 | 144.0 |
| 10+ | 1 | 0.048 | 132.4 | 112.8 | 119.5 | 126.1 | 138.7 | 144.8 | 150.8 |
| 11+ | 1 | 0.049 | 138.9 | 119.4 | 125.9 | 132.4 | 145.3 | 151.7 | 158.1 |
| 12+ | 1 | 0.048 | 144.4 | 125.5 | 131.7 | 138.0 | 150.9 | 157.5 | 164.3 |
| 13+ | 1 | 0.043 | 148.2 | 130.0 | 135.9 | 141.9 | 154.7 | 161.5 | 168.6 |
| 14+ | 1 | 0.042 | 150.5 | 132.8 | 138.4 | 144.3 | 157.0 | 163.8 | 171.1 |
| 15+ | 1 | 0.041 | 151.5 | 134.1 | 139.6 | 145.4 | 158.0 | 164.9 | 172.2 |
| 16+ | 1 | 0.041 | 152.0 | 134.6 | 140.1 | 145.8 | 158.5 | 165.4 | 172.7 |
| 17+ | 1 | 0.040 | 152.2 | 134.9 | 140.3 | 146.1 | 158.7 | 165.6 | 173.0 |
| 18+ | 1 | 0.040 | 152.3 | 135.0 | 140.4 | 146.2 | 158.8 | 165.7 | 173.1 |
| 19+ | 1 | 0.039 | 152.3 | 135.0 | 140.5 | 146.2 | 158.8 | 165.7 | 173.1 |
L:power in the Box-Cox transformation; S:generalized coefficient of variation; M:median. Z-scores:3,2,1; -1,-2,-3.
TABLA 3. Weight for age in boys and girls. Z-score and LMS parameters
| Age | L | S | M | -3 | -2 | -1 | 1 | 2 | 3 |
| Boys | |||||||||
| 5+ | -1.09 | 0.179 | 18.3 | 13.2 | 14.5 | 16.1 | 21.4 | 26.4 | 36.2 |
| 6+ | -1.01 | 0.178 | 20.0 | 14.2 | 15.6 | 17.5 | 23.7 | 29.7 | 41.9 |
| 7+ | -0.93 | 0.179 | 22.0 | 15.2 | 16.9 | 19.0 | 26.3 | 33.6 | 48.7 |
| 8+ | -0.84 | 0.182 | 24.5 | 16.5 | 18.4 | 21.0 | 29.7 | 38.6 | 57.4 |
| 9+ | -0.74 | 0.190 | 27.3 | 17.9 | 20.1 | 23.1 | 33.7 | 44.4 | 67.0 |
| 10+ | -0.62 | 0.203 | 30.5 | 19.3 | 21.9 | 25.5 | 37.9 | 50.4 | 76.0 |
| 11+ | -0.49 | 0.215 | 33.9 | 20.8 | 23.9 | 28.1 | 42.5 | 56.5 | 83.2 |
| 12+ | -0.37 | 0.222 | 37.6 | 22.5 | 26.1 | 30.9 | 47.1 | 62.0 | 87.6 |
| 13+ | -0.29 | 0.218 | 41.9 | 24.7 | 29.0 | 34.5 | 52.2 | 67.1 | 90.1 |
| 14+ | -0.26 | 0.202 | 46.8 | 27.6 | 32.6 | 38.8 | 57.4 | 71.7 | 91.5 |
| 15+ | -0.27 | 0.184 | 51.2 | 30.7 | 36.1 | 42.9 | 61.7 | 74.9 | 91.7 |
| 16+ | -0.30 | 0.167 | 54.5 | 33.3 | 39.1 | 46.1 | 64.5 | 76.6 | 91.2 |
| 17+ | -0.32 | 0.152 | 57.0 | 35.6 | 41.7 | 48.8 | 66.6 | 77.7 | 90.5 |
| 18+ | -0.34 | 0.140 | 59.1 | 37.8 | 44.0 | 51.1 | 68.2 | 78.5 | 90.0 |
| 19+ | -0.35 | 0.132 | 61.1 | 40.0 | 46.3 | 53.3 | 69.7 | 79.2 | 89.6 |
| Girls | |||||||||
| 5+ | -0.91 | 0.176 | 16.5 | 11.3 | 12.6 | 14.3 | 19.5 | 23.7 | 30.4 |
| 6+ | -0.87 | 0.172 | 19.5 | 13.0 | 14.7 | 16.7 | 23.2 | 28.7 | 37.4 |
| 7+ | -0.84 | 0.171 | 22.2 | 14.5 | 16.4 | 18.9 | 26.8 | 33.5 | 44.3 |
| 8+ | -0.83 | 0.177 | 24.8 | 15.7 | 18.0 | 20.9 | 30.2 | 38.1 | 50.9 |
| 9+ | -0.72 | 0.192 | 27.4 | 17.0 | 19.6 | 22.9 | 33.7 | 42.9 | 57.6 |
| 10+ | -0.45 | 0.209 | 30.9 | 18.5 | 21.6 | 25.6 | 38.1 | 48.6 | 64.5 |
| 11+ | -0.15 | 0.216 | 35.3 | 20.7 | 24.4 | 29.1 | 43.6 | 55.1 | 71.6 |
| 12+ | 0.00 | 0.214 | 40.1 | 23.5 | 27.8 | 33.2 | 49.1 | 61.1 | 77.4 |
| 13+ | -0.14 | 0.197 | 44.1 | 26.4 | 31.0 | 36.8 | 53.3 | 65.2 | 80.9 |
| 14+ | -0.37 | 0.175 | 46.9 | 28.9 | 33.7 | 39.6 | 56.0 | 67.5 | 82.2 |
| 15+ | -0.54 | 0.159 | 48.8 | 30.9 | 35.8 | 41.6 | 57.7 | 68.7 | 82.6 |
| 16+ | -0.66 | 0.148 | 50.4 | 32.5 | 37.4 | 43.3 | 59.0 | 69.6 | 82.8 |
| 17+ | -0.72 | 0.141 | 51.8 | 34.1 | 39.0 | 44.8 | 60.2 | 70.4 | 83.0 |
| 18+ | -0.76 | 0.137 | 53.0 | 35.6 | 40.5 | 46.2 | 61.2 | 71.1 | 83.1 |
| 19+ | -0.77 | 0.136 | 54.2 | 37.0 | 41.8 | 47.5 | 62.2 | 71.7 | 83.1 |
L:power in the Box-Cox transformation; S:generalized coefficient of variation; M:median. Z-scores:3,2,1; -1,-2,-3.
TABLA 4. BMI for age in boys and girls. Z-scores and LMS parameters
| Age | L | S | M | -3 | -2 | -1 | 1 | 2 | 3 |
| Boys | |||||||||
| 5+ | -2.16 | 0.09 | 16.1 | 13.0 | 13.8 | 14.8 | 17.9 | 20.4 | 24.5 |
| 6+ | -2.13 | 0.09 | 16.2 | 13.0 | 13.8 | 14.9 | 18.0 | 20.6 | 24.8 |
| 7+ | -2.06 | 0.10 | 16.3 | 13.0 | 13.9 | 15.0 | 18.2 | 21.0 | 25.6 |
| 8+ | -1.93 | 0.10 | 16.7 | 13.0 | 14.0 | 15.1 | 18.7 | 21.8 | 27.0 |
| 9+ | -1.74 | 0.11 | 17.1 | 13.1 | 14.1 | 15.4 | 19.5 | 22.9 | 28.9 |
| 10+ | -1.53 | 0.12 | 17.6 | 13.1 | 14.3 | 15.7 | 20.2 | 24.0 | 30.3 |
| 11+ | -1.34 | 0.12 | 18.0 | 13.2 | 14.4 | 16.0 | 20.8 | 24.8 | 31.2 |
| 12+ | -1.16 | 0.13 | 18.4 | 13.3 | 14.6 | 16.3 | 21.3 | 25.4 | 31.6 |
| 13+ | -0.99 | 0.13 | 19.0 | 13.5 | 15.0 | 16.7 | 22.0 | 26.0 | 31.9 |
| 14+ | -0.84 | 0.12 | 19.7 | 13.9 | 15.5 | 17.3 | 22.7 | 26.6 | 32.0 |
| 15+ | -0.69 | 0.12 | 20.2 | 14.3 | 15.9 | 17.9 | 23.2 | 27.0 | 31.9 |
| 16+ | -0.54 | 0.12 | 20.7 | 14.6 | 16.3 | 18.3 | 23.6 | 27.1 | 31.6 |
| 17+ | -0.41 | 0.11 | 21.0 | 14.9 | 16.6 | 18.7 | 23.9 | 27.3 | 31.4 |
| 18+ | -0.30 | 0.11 | 21.3 | 15.2 | 16.9 | 19.0 | 24.1 | 27.4 | 31.2 |
| 19+ | -0.20 | 0.12 | 21.6 | 15.4 | 17.2 | 19.2 | 24.3 | 27.5 | 31.1 |
| Girls | |||||||||
| 5+ | -1.96 | 0.09 | 15.3 | 12.3 | 13.1 | 14.1 | 17.0 | 19.3 | 22.9 |
| 6+ | -1.81 | 0.10 | 15.9 | 12.4 | 13.3 | 14.4 | 17.8 | 20.5 | 24.8 |
| 7+ | -1.65 | 0.11 | 16.3 | 12.5 | 13.5 | 14.7 | 18.5 | 21.6 | 26.7 |
| 8+ | -1.51 | 0.12 | 16.7 | 12.5 | 13.6 | 15.0 | 19.1 | 22.6 | 28.3 |
| 9+ | -1.36 | 0.11 | 17.1 | 12.5 | 13.7 | 15.2 | 19.7 | 23.5 | 29.6 |
| 10+ | -1.17 | 0.11 | 17.6 | 12.6 | 13.9 | 15.5 | 20.4 | 24.5 | 30.8 |
| 11+ | -0.95 | 0.11 | 18.3 | 12.8 | 14.2 | 16.0 | 21.4 | 25.7 | 32.0 |
| 12+ | -0.79 | 0.12 | 19.2 | 13.2 | 14.7 | 16.7 | 22.5 | 26.9 | 33.2 |
| 13+ | -0.72 | 0.12 | 20.1 | 13.7 | 15.4 | 17.5 | 23.4 | 27.8 | 33.9 |
| 14+ | -0.69 | 0.11 | 20.7 | 14.3 | 16.0 | 18.1 | 24.0 | 28.4 | 34.3 |
| 15+ | -0.67 | 0.11 | 21.2 | 14.8 | 16.5 | 18.6 | 24.5 | 28.7 | 34.3 |
| 16+ | -0.64 | 0.10 | 21.7 | 15.3 | 17.1 | 19.2 | 24.9 | 29.0 | 34.2 |
| 17+ | -0.61 | 0.10 | 22.2 | 15.8 | 17.6 | 19.7 | 25.3 | 29.2 | 34.1 |
| 18+ | -0.58 | 0.11 | 22.7 | 16.3 | 18.1 | 20.2 | 25.7 | 29.4 | 34.0 |
| 19+ | -0.55 | 0.11 | 23.1 | 16.8 | 18.6 | 20.6 | 26.0 | 29.5 | 33.9 |
L:power in the Box-Cox transformation; S:generalized coefficient of variation; M:median. Z-scores:3,2,1; -1,-2,-3
Height
The LMS models that provided the best fit to generate the reference growth curves for height were: LMS (edf(λ) = 3 , edf(μ) = 5, edf(σ) = 3) for boys; and LMS (edf(λ) = 3, edf(μ) = 5, edf(σ) = 3) for girls. The reference curves for height in boys and in girls were modelled without skewness (edf = 0, and L was fixed as 1).
Figure 3 compares the WHO and Ecuadorian height-for-age (Z-score) curves for boys. The U.S children are taller in all age ranges. The differences are more evident in children older than 13 years of age. Consequently, estimates of low height and extremely low height will be higher when based on the WHO standards. We can find something similar as height-for-age (Z-score) curves for girls (Fig. 4). The U.S children are taller across all age ranges. Consequently, estimates of low height and extremely low height will be higher when based on the WHO standards.
Weight
For weight, the LMS models that provided the best fit were: LMS (edf(λ) = 2, edf(μ) = 5, edf(σ) = 3) for boys; and LMS (edf(λ) = 3, edf(μ) = 5, edf(σ) = 3) for girls. Positive skewness (L is less than one) was observed at all ages; so, lower centiles were relatively closer to the median, while upper extreme centiles were relatively more distant from the median in both boys and girls.
Figure 5 compares WHO and Ecuadorian weight-for-age (Z-score) curves for boys. The median weight of children included in Ecuadorian curves is above WHO median during the second half of the first decade (5 to 10 years of age); however, the charts for Ecuadorian curves show a high dispersion of data. Something similar happens with the weight-for-age (Z-score) curves for girls (Fig. 6), in which the median weight of children included in Ecuadorian curves is below WHO median, but less pronounced.
Body Mass index
The LMS models that provided the best fit to generate the reference growth curves for BMI were: LMS (edf(λ) = 3, edf(μ) = 5, edf(σ) = 3) for boys; and LMS (edf(λ) = 3, edf(μ) = 5, edf(σ) = 3) for girls. Compared to weight, the BMI showed more positive skewness, but a smaller coefficient of variation.
Figure 7 compares WHO and Ecuadorian BMI (Z-score) curves for boys, and Figure 8 does the same for girls. The two sets of BMI curves are different, reflecting obesity in the Ecuadorian sample. Estimates of overweight and obesity, as well as undernutrition, will be substantially different when based on the WHO standards versus the Ecuadorian references.
For girls, the two sets are different as well; the mean BMI of children included in Ecuadorian curves is over the WHO median for the whole age period of study. The differences are less significant in these charts, perhaps due to the higher number of observations in girls than those in boys. The sample of girls was 30% larger than that of boys.
According to these results, the following Table 5 describes the estimates of low height, extremely low height, underweight, extremely underweight, thinness, severe thinness, overweight, and obesity in boys and girls when based on WHO standards and Ecuadorian references.
TABLA 5. Diagnosis of children according to Ecuador references and WHO standards growth charts
| Ecuador | WHO | p-value | ||||||
| n/N | % | IC 95% | n/N | % | IC 95% | |||
| Boys | ||||||||
| Low heighta | 29/1215 | 2.4 | 1.63 - 3.45 | 185/1215 | 15.2 | 13.28 - 17.40 | 0.000 | |
| Extremely low heightb | 0/1215 | 0 | 0.0 - 0.0 | 29/1215 | 2.4 | 1.63 - 3.45 | 0.000 | |
| Underweightc | 6/304 | 1.97 | 0.8 - 4.46 | 19/304 | 6.25 | 3.91 - 9.75 | 0.014 | |
| Extremely Underweightd | - | - | - | 3/304 | 0.99 | 0.26 - 3.10 | 0.171 | |
| Thine | 23/1215 | 1.89 | 1.23 - 2.87 | 17/1215 | 1.40 | 0.84 - 2.28 | 0.378 | |
| Severely Thinf | 2/1215 | 0.16 | 0.03 - 0.66 | - | - | - | 0.319 | |
| Overweightg | 25/1215 | 2.1 | 1.36 - 3.07 | 130/1215 | 8.5 | 7.0 - 10.22 | 0.000 | |
| Obesityh | 0/1215 | 0 | 0.0 - 0.0 | 13/1215 | 1.1 | 0.6 - 1.87 | 0.000 | |
| Girls | ||||||||
| Low heighta | 35/1613 | 2.2 | 1.54 - 3.04 | 262/1613 | 16.2 | 14.49 - 18.16 | 0.000 | |
| Extremely low heightb | 11/1613 | 0.7 | 0.36 - 1.26 | 51/1613 | 3.2 | 2.39 - 4.17 | 0.000 | |
| Underweightc | 12/451 | 2.66 | 1.45 - 4.73 | 19/451 | 4.21 | 2.63 - 6.62 | 0.239 | |
| Extremely Underweightd | - | - | - | 2/451 | 0.44 | 0.08 - 1.77 | 0.307 | |
| Thine | 32/1613 | 1.98 | 1.38 - 2.82 | 16/1613 | 0.99 | 0.59 - 1.64 | 0.034 | |
| Severely Thinf | - | - | - | - | - | - | - | |
| Overweightg | 39/1613 | 2.42 | 1.75 - 3.32 | 99/1613 | 6.14 | 5.04 - 7.45 | 0.000 | |
| Obesityh | 6/1613 | 0.37 | 0.15 - 0.85 | 5/1613 | 0.68 | 0.36 - 1.26 | 0.065 | |
a < -2 z-score in height for age curve; b < -3 z-score in height for age curve; c <-2 z-score in weight for age curve (children from 5+ to 9+ years old); d < -3 z-score in weight for age curve (children from 5+ to 9+ years old); e <-2 z-score in BMI curve; f <-3 z-score in BMI curve; g >2 z-score in BMI curve; h >3 z-score in BMI curve.
As seen in Table 5, when applying the WHO curve to the study population, there is a 15.2% of low height prevalence, versus 2.4% obtained when applying a national growth curve to the same population. Moreover, when applying the WHO curve, 2.4% of the boys and 3.2% of the girls have an extremely low height diagnosis. Underweight is 1.5-3 times more frequent in women and men, respectively, when using the WHO curve for nutritional diagnosis. In turn, the diagnosis of overweight and obesity decreases, when the national curve is used, in girls from 6.14% to 2.42%, and in boys from 8.5% to 2.1%.
DISCUSSION
Reference growth curves for height, weight and BMI were estimated from a cross-sectional study comprising 2891 children from a variety of climatic zones and ethnic groups in Ecuador. They were based on the most advanced statistical techniques, namely: the LMS method using penalized splines (Cole & Green, 1992). This is a sophisticated way to summarize a growth curve, and several criteria to check the validity of the estimates exist (Pan & Cole, 2004; Royston & Wright, 2000; van Buuren & Fredriks, 2001). This approach is also more objective than methods used in the past, and holds a number of important advantages (Roelants, Hauspie & Hoppenbrouwers, 2009). In this sense, this study has allowed us to illustrate the differences between the international standard and a local reference.
Child growth is internationally recognized as an important public health indicator for monitoring health in populations. Growth references provide public health authorities with information about growth status of children and are critical for identifying groups and individuals who are at risk for disease or require urgent care (de Onis et al., 2004). Some authors hypothesize that a population exposed to optimal nutritional and environmental conditions will reach sizes comparable to those of any other population, and therefore suggest using standardized international instruments for growth assessment (WHO, 2006). Some others consider that growth is of multifactorial, environmental and polygenic inheritance, and that the growth curves used as a reference for nutritional diagnosis must be specific to each population.
Our study indicates that Ecuadorian children and adolescents are shorter throughout life, with height growth that compares less favorably on international references than weight growth. This research provides the first analysis to describe growth among 5-18 year-old Ecuadorian children and adolescents. As U.S. children are generally taller than Ecuadorians, estimates of low height, extremely low height, overweight, obesity and undernutrition will be substantially different when based on the WHO standards versus the Ecuadorian references. The adoption of WHO standards as a diagnostic tool, included in the national clinical guidelines, in a population with lesser median height, has public health implications as specialized care is involved. The globally launched WHO references for height, weight, BMI from 5 to 19 years (de Onis et al., 2007a) was officially adopted in Ecuador. However, these tables are far from expressing the growth of healthy Ecuadorian children. For example, the average height of girls at 18 in the recommended tables is 163 cm, while the average height of Ecuadorian girls is approximately 152 cm.
It is important to point out that 2.4% of the boys and 3.2% of the girls have an extremely low height diagnosis when applying the WHO growth curve to our study population, implying pathological size cases that will require the application of specific protocols of diagnosis and treatment. On the other hand, when applying the WHO growth curve, there is 15.2% of low height prevalence versus 2.4% obtained when applying a national curve to the same population. In relation to weight, we show that underweight is 1.5-3 times more frequent in women and men, respectively, when using the WHO curve for nutritional diagnosis. The diagnosis of overweight and obesity decreases when the national reference is used: in women from 6.14% to 2.42%, and in men from 8.5% to 2.1%. Thus, from a clinical perspective, use of WHO curves impacts on the allocation of funds and public efforts to satisfy a demand that has not been contrasted with local references of growth. It is notable that the WHO curves show an average adult height (males) of 1.78 cm and in Argentina, for example, that average is 1.72 cm. Thus, these curves "for international use" would not be suitable for clinical use (Lejarraga, 2007a).
In both genders, post-pubertal differences between the two growth curves become more evident, which could be explained by events such as adrenarche, menarche and changes in speed of growth during the pubertal growth spurt; all these changes have genetic influence, and for that reason determine substantial differences in the final individual size. Adolescence, a stage of transition between childhood and adulthood, is a critical period characterized by a growth spurt with physiological changes until reaching approximate adult status (Chukwunonso, Chidi & Lawrence, 2010). However, in comparison with the period of early childhood, there is much more individual variation in growth velocity, which is important in terms of crucial normality. Although growth pattern is mainly determined by genetic factors, it also reflects nutritional status. Therefore, evaluation of nutritional disorders such as stunting (a measure of chronic under-nutrition), thinness (under-nutrition) and overweight (over-nutrition) based on adequate population-specific growth references are of essential importance.
The stunting of growth might be of hereditary origin (Moore, Young, McCullough, Droma & Zamudio, 2001) and could be one adaptive response of the body to the hypoxic stress (Facchini, 2003). Not all the authors attribute the small stature of the Andean population to a genetic adaptation and could attribute characteristic anthropometric in the influence of the environment (Cruz-Coke, Cristoffanini, Aspillaga & Biancani, 1976). We cannot exclude the added effects of a poor nutrition and economic factors (Pawson, Huicho, Muro & Pacheco, 2001; Stinson, 2009). Growth and development under conditions of chronic hypoxia result in a different pattern of growth: living at high altitude results in a small (1 to 4 cm) delay in linear growth (Greksa, 2006), as in Bolivia (Stinson, 2009) and Argentina (Grandi, Dipierri, Luchtenberg, Moresco & Alfaro, 2013).
Similar findings were described in the Eurogrowth study, such as higher height averages in Europe compared to the United States, and differences in height between Northern and Southern Europeans (Haschke & van't Hof, 2000). These authors recommend the use of national growth curves for more accurate nutritional diagnoses, focused on the anthropological diversity of each country. The reference curves published by the WHO are of great value as common global reference, allowing countries to situate their growth status with respect to this common global reference. The WHO has at some point proposed to use their data as common universal reference. Nevertheless, WHO curves for 5-19 years are not based on a multicenter study. The National Center for Chronic Disease Prevention and Health Promotion (CDC) recommendation for the United States is "Use the WHO growth charts for all children from birth up to 2 years of age to monitor growth in the United States. The WHO growth standards for children younger than 2 years have been adapted for use in the United States. Use the WHO growth charts for children and teens aged 2 through 19 years to monitor growth in the United States" (Grummer-Strawn, Reinold & Krebs, 2010; Kuczmarski et al., 2000).
Eveleth & Tanner (1991) have clearly demonstrated that populations can substantially differ in the average growth, with variations in both height and weight. Therefore, population-based growth measurement data is a better option for constructing growth curves, given geographical, environmental, and genetic differences. In addition to their utility to researchers, population-level descriptions of growth may also serve as important tools in the clinical evaluation of children. Descriptions of growth that incorporate centile distributions are particularly valuable for clinicians as references of expected growth (de Onis et al., 2004). Although some authors advocate for the use of a single growth reference for all children and adolescents globally (de Onis et al., 2004), they suggest that international references may not be accurate for assessing growth in all populations.
The anthropometric analysis using WHO curves as a reference for women aged 15 to 19, from 8 countries in Latin America and the Caribbean, showed low height estimates in Andean populations with a high percentage of indigenous and mestizo populations of 24.7%, 32.1% and 42.7% in Bolivia, Peru and Ecuador respectively. It is difficult to assimilate these percentages without asking how these data would vary with national reference curves (Chaparro & Lutter, 2011). Beyond the comparability that the WHO growth standards allow, it is important to complement this information with local referents that allow for the contextualization of statistical data, and propose measures to monitor the growth of a specific population, framed in a re-structuring process of the National Health System in Ecuador (ISAGS, 2012).
Among the potential limitations of this work, we might mention the small sample size. In general, small samples affect the estimation of percentiles, and therefore Z-scores, in extreme age groups (Revollo, Martínez, Grandi, Alfaro & Dipierri, 2017; Urquia, Alazraqui, Spinelli & Frank 2011). As data requirements for LMS methodology, 50 measurements per sex per binned age (e.g., week, month, year) will normally provide enough information to estimate M and S precisely, but up to 400 observations per sex per binned age may be needed to estimate L precisely (Cole, 2012; Johnson, 2015). Nevertheless, there are no definitive recommendations and no statistically justified way to estimate sample size for LMS through a power calculation (Johnson, 2015). In general, our sample of girls was 30% larger than that of boys, but it had, in all ages, more than 50 observations, except in the extreme age groups. Moreover, according to the statistical analysis, the models satisfied the presumption of normality after doing power transformation.
In summary, the WHO references are in all instances less accurate as a screening tool than adequate population-specific growth references. It is known that adult height is partly determined by exposure to environmental and social factors at the start of life, and the roots of health inequalities may therefore lie in inequalities experienced in-utero and during childhood and adolescence (Mackenbach, 2012). In this respect, as social factors in childhood influence the processes of biological development, and are the beginnings of socially determined pathways to health in adult life (Bambra, Netuveli & Eikemo, 2010; Wadsworth, 1997), the development of a contextualized instrument for monitoring growth is imperative. Therefore, this first approach to the construction of references, illustrating the differences between the international standard and a local reference, allows us to combine arguments to advocate for the construction of an Ecuadorian growth reference for clinical use based on the national population, from conception to maturity, as an accurate instrument for growth monitoring. We must give ourselves the opportunity to raise the political and academic debate about the use of local growth references in Ecuador.
ACKNOWLEDGMENTS
This work started thanks to the Subsidiary Agreement CUD / CIUF / ULB - UTE, 2011-2012. We first thank all the girls and boys and their parents who collaborated with the study. We would also like to thank the local authorities and the educational community of the cities of Tulcán, Tena, Quito and Santa Elena. We are also very grateful to the students of the medical career of "Facultad de Ciencias de la Salud Eugenio Espejo" of "Universidad UTE" for their collaboration in data collection. Thanks to Susana Hidalgo for her assistance with the edition of this manuscript. Finally, we want to thank Tania Condurache and George Rodgers, from University of Lousville, for their contributions to the final manuscript.
LITERATURE CITED
Alwasel, S.H., Harrath, A., Aljarallah, J.S., Abotalib, Z., Osmond, C., Al Omar, S.Y., Khaled, I., & Barker, D.J. (2013). Intergenerational effects of in utero exposure to Ramadan in Tunisia. American Journal of Human Biology, 25, 341-343. doi:10.1002/ajhb.22374 [ Links ]
Bambra, C., Netuveli, G., & Eikemo, T. (2010). Welfare state regime life courses: the development of Western European welfare state regimes and age-related patterns of educational inequalities in self-reported health. International Journal of Health Services, 40(3), 399-420. doi:10.2190/HS.40.3.b [ Links ]
Bielicki, T., and Waliszko, H. (1991). Urbanization-dependent gradients in stature among polish conscripts in 1976 and 1986. American Journal of Human Biology, 3, 419-424. doi:10.1002/ajhb.1310030502 [ Links ]
Bustos, P., Amigo, H., Muñoz, SR., & Martorell, R. (2001) Growth in indigenous and nonindigenous Chilean schoolchildren from 3 poverty strata. Amercian Journal of Public Health, 91, 1645-1649. [ Links ]
Cameron, W.M. (1986). Standards for human growth: Their construction and use. South African Medical Journal, 70, 422-425. [ Links ]
Chaparro, C., & Lutter, C. (2011). Peso inferior al normal talla baja y sobrepeso en adolescentes y mujeres jóvenes en América Latina y el Caribe, Washington, D. C. OPS/OMS. [ Links ]
Chukwunonso, E., Chidi. U., & Lawrence. E. (2010). Physical growth and nutritional status of a cohort of semi-urban Nigerian adolescents. Pakistan Journal of Nutrition, 9(4), 392-397. doi:10.3923/pjn.2010.392.397 [ Links ]
Cole, T.J. (1989). Using the LMS method to measure skewness in the NCHS and Dutch National height standards. Annals of Human Biology, 16, 407-419.doi:10.1080/03014468900000532 [ Links ]
Cole, T.J. (1990). The LMS method for constructing normalized growth standards. European Journal of Clinical Nutrition, 44(1), 45-60. [ Links ]
Cole, T.J., & Green, P.J. (1992). Smoothing reference centile curves: the LMS method and penalized likelihood. Statistics in Medicine, 11, 1305-1319. doi:10.1002/sim.4780111005 [ Links ]
Cole, T.J. (1995). Constructing growth charts smoothed across time and space. In Hauspie R., Lindgren G., & Falkner. F. (Eds.). Essays on Auxology presented to James Mourilyan Tanner (pp. 76-88). UK: Castlemead Publications. [ Links ]
Cole, T.J. (2012). Growth references and standards. In: Cameron N., Bogin B. (Eds.). Human growth and development (pp. 537-566). London, UK: Academic Press. [ Links ]
Cruz-Coke, R., Cristoffanini, A.P., Aspillaga, M., & Biancani, F. (1976). Evolucionary forces in human populations in an environment gradient in Arica, Chile. Human Biology, 38, 421-38. [ Links ]
de Onis, M., Onyango, A.W., Borghi, E., Siyam, A., Nishida, C., & Siekmann, J. (2007a). Development of a WHO growth reference for school-aged children and adolescents. Bull World Health Organ, 85(9), 660-667. doi:10.2471/BLT.07.043497 [ Links ]
de Onis, M., Garza, C., Onyango, A., & Borghi, E. (2007b). Comparison of the WHO Child Growth Standards and the CDC 2000 growth charts. The Journal of Nutrition, 137(1), 144-148. doi:10.1093/jn/137.1.144 [ Links ]
de Onis, M., Garza, C., Victoria, C.G., Onyango, A.W., Frongillo, E.A., & Martines, J. (2004). The WHO Multicentre Growth References Study: planning, study design, and methodology. Food and Nutrition Bulletin, 25(1), S15-S26. doi:10.1177/15648265040251S103 [ Links ]
Duran, P., Merker, A., Briceño, G., Colón, E., Line, D., Avad, V….. & Hagenäs, L. (2016). Colombian References growth curves for height, weight, body mass index and head circumference. Acta Paediatrica, 105 (3), 116-25. doi:10.1111/apa.13269
Eveleth, P., & Tanner, J. (1991). World wide variation in human growth. Cambridge: University Press. [ Links ]
Facchini, F. (2003). Les effessts de l’altitude. In Rebato E., Susanne, C. & Chiarelli. B. (Eds.). Anthropologie biologique: Evolution et biologie humaine (pp. 429-434). Bruxelles, Belgian: De Boeck.
Grandi, C., Dipierri, J., Luchtenberg, G., Moresco, A., & Alfaro, E. (2013). Efecto de la altitud sobre el peso al nacer y eventos perinatales adversos en dos poblaciones argentinas. Revista de la Facultad de Ciencias Médicas, 70(2), 55-62. [ Links ]
Greksa, L.P. (2006). Growth and development of Andean high altitude residents. High altitude Medicine & Biology, 7(2), 116-24. doi:10.1089/ham.2006.7.116 [ Links ]
Grummer-Strawn, L.M., Reinold, C., & Krebs, N.F. (2010). Use of the World Health Organization and CDC growth charts for children aged 0-59 months in the United States. Morbidity and Mortality Weekly Report, 59(RR-9), 1-15. [ Links ]
Habicht, J.P., Martorell, R., Yarbrough, C. Malina, R.M., & Klein, R.E. (1974). Height and weight standards for preschool children. How relevant are ethnic differences in growth potential? Lancet, 1(7858), 611-614. doi:10.1016/S0140-6736(74)92663-4 [ Links ]
Hamill, P.V., Driz, T., Johnson, C.L., Reed, R.B., & Roche, A.F. (1977). NCHS Growth Curves for children, Birth - 18 years. Hyattsville, United States: National Center for Health Statistics publication. [ Links ]
Haschke, F., & van't Hof, M.A. (2000). Euro-Growth references for length, weight, and body circumferences. Euro-Growth Study Group. Journal of Pediatric Gastroenterology and Nutrition, 31(1), S14-S38. [ Links ]
Hauspie, R., Das, S.R., Prece, M.A., & Tanner, J.M. (1982). Degree of resemblance of the pattern of growth among sibs in families of West Bengal (India). Annals of Human Biology, 9(2), 171-74. doi:10.1080/03014468200005641 [ Links ]
Hauspie, R. (1998). The genetics of child growth. In: Ulijaszek, S.J., Johnston, F.E., & Preece M.A. (Eds.). The Cambridge Encyclopedia of Human Growth and Development (pp. 124-128). Cambridge, UK: University Press. [ Links ]
Hauspie, R. (2003). Croissance et développement. In: Rebato, E., Susanne C., & Chiarelli B. (Eds.). Anthropologie Biologique. Evolution et Biologie humaine (pp. 475-485). Bruxelles, Belgian: De Boeck. [ Links ]
Instituto Suramericano de Gobierno en Salud (ISAGS). (2012). Sistemas de Salud en Suramérica, desafíos para la universalidad, la integralidad y la equidad. Rio de Janeiro, Brasil: ISAGS. [ Links ]
Johnson, W. (2015). Analytical strategies in human growth research. American Journal of Human Biology, 27(1), 69-83. doi:10.1002/ajhb.22589 [ Links ]
Johnston, F. E. (1986). Reference data for physical growth in nutritional anthropology. In Quandt S.A., & Ritenbaugh. C. (Eds.). Training manual in nutritional anthropology (pp. 60-65). Washington, United States: American Anthropologist Association. [ Links ]
Kuczmarski, R.J., Ogden, C.L., Grummer-Strawn, L.M., Flegal, K.M., Guo, S.S., Wei, R,…..& Johnson, C.L. (2000). CDC Growth Charts: United States. Advance Data Report No. 314, 1-27.
Lejarraga, H. (2007a). Referencias y estándares de crecimiento en la Argentina. Consideraciones del grupo ad hoc para el análisis de las tablas de la Organización Mundial de la Salud y su uso en la Argentina. Archivos Argentinos de Pediatría, 105(2), 159-66. Recuperado de https://www.sap.org.ar/docs/publicaciones/archivosarg/2007/v105n2a13.pdf [ Links ]
Lejarraga, H. (2007b). Consideraciones sobre el uso de tablas de crecimiento en Argentina. Archivos Argentinos de Pediatría, 105(6), 545-551. [ Links ]
López, M., Izaguirre, I., & Macias, C. (2013). Crecimiento y maduración física, bases para el diagnóstico y seguimiento clínico. Caracas, Venezuela: Editorial Médica Panamericana. [ Links ]
Mackenbach, J. P. (2012). The persistence of health inequalities in modern welfare states: the explanation of a paradox. Social Science & Medicine, 75(4), 761-769. doi:10.1016/j.socscimed.2012.02.031 [ Links ]
Marrodán, M. D. (2005). Antropología de la nutrición. In Rebato E., Susanne, C., & Chiarelli. B (Ed.). Para comprender la Antropología biológica. Evolución y biología humana (pp. 595-607). Navarra, España: Editorial Verbo Divino. [ Links ]
Milani, S., Buckler, J.M., Kelnar, C.J., Benso, L., Gilli, G., Nicoletti, I., ….& Sartorio, A. (2012). The use of local reference growth charts for clinical use or a universal standard: a balanced appraisal. Journal of Endocrinological Investigation, 35(2), 224-226. doi:10.1007/bf03345422
Monnier, C., Vercauteren, M., & Susanne, C. (2003). Estudio de crecimiento de la población escolar de Quito (Ecuador). Antropo, 5, 9-20. [ Links ]
Monnier, C., Lepage, Y., Hauspie, R., Vercauteren, M., Roelants, M., Cruz-Albornoz, J., & Cruz-Pierard, J. (2011). Estudio del crecimiento y desarrollo de niños ecuatorianos residentes en Quito, según su origen social. Tsafiqui, 2(2), 127-141. [ Links ]
Moore, L.G., Young, D., McCullough, R.E., Droma, T., & Zamudio, S. (2001). Tibetan protection from intrauterine growth restriction (IUGR) and reproductive loss at high altitude. American Journal of Human Biology, 13(5), 635-644. doi:10.1002/ajhb.1102 [ Links ]
Mueller, W.H. (1986). The genetics of size and shape in children and adults. In Falkner, F. & Tanner, J.M. (Eds.). Human growth, an encyclopedia of life support systems (EOLSS) comprehensive treatise (pp. 145-168). New York & London: Plenum Press. [ Links ]
Pan H & Cole TJ. (2004). A comparison of goodness of fit tests for age-related reference ranges. Statistics in Medicine, 23,1749-1765. doi:10.1002/sim.1692 [ Links ]
Pawson, I.G., Huicho, L., Muro, M., & Pacheco, A. (2001). Growth of children in two economically diverse Peruvian high‐altitude communities. American Journal of Human Biology, 13(3), 323-340. doi:10.1002/ajhb.1056 [ Links ]
Revollo, G.B., Martínez, J.I., Grandi, C., Alfaro, E.L., & Dipierri, J.E. (2017) Prevalence of underweight and small for gestational age in Argentina: Comparison between the INTERGROWTH-21st standard and an Argentine reference. Archivos Argentinos de Pediatría, 115(6), 547-555. doi:10.5546/aap.2017.eng.547. [ Links ]
Roelants, M., Hauspie, R., and Hoppenbrouwers, K. (2009). References for growth and pubertal development from birth to 21 years in Flanders, Belgium. Annals of Human Biology, 36(6), 680-694. doi:10.3109/03014460903049074 [ Links ]
Royston, P., & Wright, E.M. (2000). Goodness-of-fit statistics for age-specific reference intervals. Statistics in Medicine, 19(21), 2943-2962. [ Links ]
Ruiz-Castell, M., Carsin, A.E., Barbieri, F.L., Paco, P., Gardon, J., & Sunyer, J. (2013). Child patterns of growth delay and cognitive development in a Bolivian mining city. American Journal of Human Biology, 25(1), 94-100. doi:10.1002/ajhb.22346 [ Links ]
Skuse, D.H. (1998). Growth and psychosocial stress. In Ulijaszek, S.J. Johnston, F. E & Preece, M. A. (Eds.). The Cambridge encyclopedia of human growth and development (pp. 341-342). Cambridge, UK: University Press. [ Links ]
Stinson, S. (2009). Nutritional, developmental, and genetic influences on relative sitting height at high altitude. American Journal of Human Biology, 21(5), 606-6013. doi:10.1002/ajhb.20918. [ Links ]
Tanner, J. M. (1981). A history of the study of human growth. Cambridge, UK: University Press. [ Links ]
Tanner, J. M. (1986). Growth as a mirror of the condition of society: secular trends and class distinctions. In Demirjian, A & Taylor, R. (Eds.). Human growth: a multidisplinary review (pp. 3-34). London, UK: Taylor and Francis. [ Links ]
Urquia, M. L., Alazraqui, M., Spinelli, H. G., & Frank, J. W. (2011). Referencias poblacionales argentinas de peso al nacer según multiplicidad del parto, sexo y edad gestacional. Revista Panamericana de Salud Pública, 29(2), 108-119. [ Links ]
van Buuren, S., and Fredriks, M. (2001). Worm plot: a simple diagnostic device for modelling growth reference curves. Statistics in Medicine, 20(8), 1259-1277. doi:10.1002/sim.746 [ Links ]
Vercauteren, M. (2005). Evolución secular en el siglo XX. In Rebato, E. Susanne, C. & Chiarelli. B. (Eds.). Para comprender la antropologia biológica. Evolución y biologia humana (pp. 547-555). Navarra, España: Editorial Verbo Divino. [ Links ]
Wadsworth, M.E. (1997). Health inequalities in the life course perspective. Social Science & Medicine, 44(6), 859-869. doi:10.1016/S0277-9536(96)00187-6 [ Links ]
World Health Organization. (1995). Physical status: the use of and interpretation of anthropometry: Report of a WHO Expert Committee. Technical report series No 854. Geneva, World Health Organization. [ Links ]
World Health Organization. (2006). Multicentre Growth references Study Group. WHO child growth standards: length/height-for-age, weight-for-age, weight-for-lenght, weight-for-height and body mass index-for age, methods and development. Geneva, World Health Organization. [ Links ]

