


Servicios Personalizados
Revista

Articulo
 Inglés (pdf)
 Articulo en XML
 Referencias del artículo
 Enviar articulo por email
Indicadores
-
 Citado por SciELO
Links relacionados
-
 Similares en
SciELO
Similares en
SciELO
Compartir

 Permalink
Serie correlación geológica
versión On-line ISSN 1666-9479
Ser. correl. geol. vol.33 no.2 San Miguel de Tucumán dic. 2017
ARTICULO
Determination of physical variables of the mendocino piedmont through the use of remote sensing tools in relation to geological risks
DETERMINACIÓN DE VARIABLES FÍSICAS DEL PIEDMONTE MENDOCINO MEDIANTE EL USO DE HERRAMIENTAS DE TELEDETECCIÓN EN RELACIÓN CON RIESGOS GEOLÓGICOS.
Héctor CISNEROS1,2, Jorge TORRES1,3, Sebastián FERMANI1, Marta GRINTAL1, Vanina F. BISOGNO1, Estefanía CASTAÑÓN1, Marisa SUKLJE2, Omar ORIVE1 y Liliana CERRUDO2
1) Universidad Juan Agustín Maza. Avda. Lat. Sur 2245 Dorrego, 5500, Mendoza. e-mail: hcisneros@umaza.edu.ar
2) Facultad De Filosofía y Letras. Universidad Nacional De Cuyo.
3) INSUTEC Instituto Superior Tecnológico De Mendoza. CISNEROS ET AL.
Abstract: The metropolitan area of Mendoza, in periandean sectors, tends to accommodate and sustain geological processes of internal and external order related to seismic and alluvial events, among others. Because of the growing and uncontrolled urbanization especially onto capital city and metropolitan area, much of the population is moving into areas of significant slope, generating phenomena related with summer rainfall events activating landslides. These processes together with other of lower order, but not less important, expose thousands of people to geological risk. The development of mapping detail to establish mitigation plans, zoning and adequate contingency in the piedmont area western Mendoza are presented here. Studies with the base of OLI, ETM+ and TM landsat program information were made, in order to perform, multitemporal studies to determine urban growth rates. Simultaneously, digital pro-cessing was performed to establish stratigraphic, topographic differences, orientation, attitude and aniso-tropies because of structural deformations that could make physical parameters to determine geological and hydrological active hazard areas. Supervised classification (maximum likelihood), decision tree (using digital elevation models from own data), density slice; principal components and decorrelation strecht were included. The results provided a detailed cartographic output raster, complemented by field work, that allowed summarize information to successfully establish zones of seismic and hydrological poten-tial hazard. The resulting graphs are presented in this opportunity.
Key words: Remote Sensing. OLI, ETM+ Images. Geological risk.
Resumen: La zona metropolitana de Mendoza, en sectores peri cordilleranos tiende a alojar y sostener procesos geológicos de orden interno y externos relacionados a eventos sísmicos y aluvionales, entre otros. Ante la creciente y descontrolada urbanización que especialmente la ciudad capital y área metropolitana están soportando, gran parte de la población está desplazándose hacia áreas de importantes pendientes, generadoras de eventos relacionados con eventos pluviométricos estivales donde se activan fenómenos de remoción en masa. Estos procesos junto a otros de menor orden, pero no así menos importantes, colocan a un núcleo de habitantes en riesgo geológico. Se presentan en esta oportunidad, los trabajos realizados tendientes a la elaboración de cartografía de detalle para establecer planes de mitigación, zonificación y contingencia adecuados en la zona del piedemonte precordillerano del oeste de la ciudad de Mendoza. Se realizaron estudios tomando información de sensores OLI, ETM+ y TM del programa Landsat, a los efectos de establecer comparaciones multitemporales para determinar vectores de crecimiento urbano. Contemporáneamente a esto, se realizaron procesamientos digitales para establecer diferencias estratigráficas, topográficas, de orientación, actitud y de anisotropías propias de deformaciones estructurales que pudieran marcar parámetros físicos para determinar zonas de peligrosidad geológica e hidrológica activa. Dentro de estos análisis digitales se incluyeron trabajos con clasificación supervisada (maximum likelihood), por árbol de decisiones (utilizando modelos digitales de elevación a partir de datos propios), density slice, componentes principales y decorrelation strecht. Los resultados aportaron una salida cartográfica raster de detalle, la cual, complementada con trabajos de campo, permitieron resumir información para establecer exitosamente zonas de potencial peligro sísmico e hidrológico. Se presentan en esta oportunidad los gráficos resultantes.
Palabras clave: Teledetección. Imágenes OLI, ETM+. Riesgo Geológico.
Introduction
The Mendocino piedmont sector is loca-ted in a zone which has the tendency to suffer in periodically way destructive events of nature origin, and they are catastrophic in many times and they have printed "on fre" the local history.
That is the reason that its insertion in this mountain area, makes this vulnerabili-ty, as social as structural is high and increases according the population growth, which does not follow structures of appropriate land-use planning.
The Precordillerano Piedmont, that is part of the plains sector, is a geomorphologi-cal unit situated to the west of the capital of the province, between the geological province of Precordillera and the oriental depression. It tends to keep and support geological processes of inner and external order in relation to the seismic events and alluviums, among others.
In front of the crescent and uncontrolled urbanization that Mendoza city is supporting, sig-nificant part of the population is moving to areas of important slope, where, as product of pheno-mena in relationship with summer pluviometric events, activates processes of mass removal.
These processes with another of less im-portance place this populated center in Geolo-gical Risk.
The final objective of the present investi-gation, is to put in criteria of scientific- technical analysis an area whom geological characteristics are the appropriate to generate alluvial processes over the population who lives there and where it shows a great social-economic and cultural de-velopment for over 500 years, and whose nature events are historically dated since the XIX cen-tury to the present.
For this, advanced methodologies known as Geotechnologies are used. They constitutes
the most efficient and fast way to support the procedures which tend to reduce the vulnerabili-ty from strategic plans. Nontraditional Mapping shows to be the most important action for the detection, zoning and hierarchical of events and áreas that establish a latent risk for the activation of phenomena with high destructive potential.
The use of tools of relevance like Remote Sensing- Mapping- GIS are used to identify and point áreas with potential to produce highly destructive natural events.
Location of the study área
It is located in the Precordillerano Mendo-cino sector, to the west of Las Heras and Godoy Cruz departments and the city of Mendoza, be-tween 32° 52" and 33° 01" LS and 68° 52" and 69° 00" LW (figure 1).
Geographical aspects
The Precordillerano Piedmont área next to the Great Mendoza, goes from the "Cordón de las Peñas" and the "Cordón de los Manantiales" to the north, to reach the Mendoza river to the south.
In its geomorphological aspects three main units are identificated: the mountains región, that it represents the oriental slopes of the Cordillera; the Piedmont and foothills. Another subunits, of less importance, contribute to the diversification of landscape, as they are the "cones and alluvial fans", depressions and riverbeds.
Since the west of the mountain it extends the piedmont plain that descends sofitly with north - east direction in the north extreme; east direction in the middle point and south - east in the south extreme. Regaraiz and Barrera (1975), estímate an absolute relief that oscillates between 1400 - 1500 meters over the sea, immediately to the west of Mendoza city (figure 1).

Figure 1. Location of the study area with main morphostructural units. / Figura 1. Ubicación del área de estudio con unidades morfoestructurales principales.
The weather in this region is very important for this work because is one of the main factors for the generation of mass removal processes in the study area, it can be described as semi- arid to arid, being according the temperature regime, of meso- thermal type with annual precipitations that they do not exceed the 200 millimeters (Ca-pitanelli, 1972).
The vegetation as a protective cover of the ground has a particular importance in lands with slope and with intense summer precipita-tions as it happens in the Piedmont of Mendoza city.
In historical analysis of space occupation and use of the natural resources of the Piedmont, it points, that the dynamic factor might have an incidence in the happening of alluvial phenome-non, which it has shown the significant relations-hip between the degradation of Piedmont and the foods over the city in every summer's season. (Prieto, 1989).
The most important people's settlement is "The Great Mendoza", composed by Capital, Godoy Cruz, Guaymallén, Las Heras and Maipú, where it concentrates about 75 % of population of Mendoza Province.
Materials and methods
The analysis of this work is based on the "deterministic" method (it consists in the determination of a particular problematic and its solution from the knowledge of the factors which gave the origin) from which, materials of work and investigation were used, such as Sa-tellite Images, for example ETM+, OLI from Landsat LDCM 8 program and others caught from the application Google Earth.
With the purpose to estimate the presence of geological structures, potential degree and potential risk of the mass phenomena present in the Mendocino Piedmont, different analysis methodologies were applicated. Also, it has been taken as a base the spectral and spatial data recei-ved from remote sensing of diverse resolutions. The main objective is to clarify if the conventional methodologies of work go well with the present systems of use and process of images in order to detect the elements of land in the most acertive and fast way to analyse.

Figure 2. Application of saturation stretch module from ENVI sofitware 5.0 RGB654 OLI imag e from Landsat 8 satellite (date of capture: 26 of April of 2016), spatial resolution: 15 meters with extension of layer stacking using the panchromatic band (sharpen 18). Doing saturation with the method HVS to contrast more colours shades, can note the difference in erosion zones and riverbeds (the str ucture contrasts disappear). / Figura 2. Aplicación del módulo saturation str etch del sofitwar e ENVI 5.0 RGB654 imagen OLI del satélite LANDSAT 8 (fecha de toma 26 de Abril de 2016). Resolución espacial: 15 metr os con ampliación de layer stacking usando la banda pancr omática (shar pen 18). Se puede notar al hacer saturación con el método HVS para contrastar más tonos de color es, la dif er encia en z onas er osionadas, y cauces hídricos (desapar ecen los contrastes estr ucturales).
Processing of Remote Sensing Data
Images from different sensors were pro-cessed, such as TM (Landsat 5) with 30 meters of spatial resolution (MSR), ETM+ (Landsat 7) of 30 MSR multiespectral y 15 MSR panchro-matic OLI (LDCM Landsat 8) multispectral 30 MSR and 15 panchromatic MSR.
. Saturation stretch : Over the RGB543 OLI bands combina-tion it was applied the enhance of equalization to obtain a major degree of contrast of covers.
On this result, it was applied the techni-que "Saturation Stretch" giving as product an image with a medium contrast, where it has va-riations between greenish, yellow and magenta shades (different grey shades in figure 2).
. Decorrelation stretch : It is a technique that improves the image
based on the Principal Components Analysis, which consists in the change of the colours at beginning considering the theorem of Karhumen- Loéve.
It is based in the ACP realization of a three bands image, following a normalization of values of variance of each component and a gaussian increasing of contrast of each one of them.

Figure 3. Application of Decor relation Stretch module from ENVI 5.0 sofitware RGB654 OLI image from Landsat 8 satellite (date of capture: 26 of April of 2016). Spatial Resolution: 15 meters with layer stacking extension using the panchromatic band (sharpen18). Doing the statics deco-r relation it can be noticed that str ucture elements tend to disappear, but the response obtained to contrast lithologic elements increase in resolution. / Figura 3. Aplicación del módulo decor r elation str etch del sofitwar e ENVI 5.0 RGB654 imagen OLI del satélite LANDSAT 8 (f echa de toma 26 de Abril de 2016). Resolución espacial: 15 metr os con ampliación de layer stacking usando la banda pancr omática (shar pen 18). Se puede notar al hacer decor r elación estadística con este elemento, que los elementos estr ucturales tienen a desapar ecer, per o la r espuesta que se obtiene para contrastar elementos litológicos aumenta en r esolución.
The result is a high contrast image that allows the identification of the regions of di-fficult discrimination in the original image. The Decorrelation Stretch enhance was applied to a RGB543 combination (figure 3).
. Principal Components
The objective of the Principal Compo-nents Analysis method (PCA) is to summarize a wide group of variables in a smaller group and not losing a significative part of the original data. (Chuvieco, 1996). In Remote Sensing the PCA is a useful technique as a previous step for another analysis. In this, image OLI was worked with all bands, including the panchromatic band (be-cause in the situation of using layer stacking, it would reduce the pixel size, being convenient for the decrease of redundant data). Eleven bands were obtained; the three frst with more than 90% of total data, and being insignificant the three last ones (figures 4, 5).
. Indexes
The normalized indexes were created to give a simple response in the enhance of diffe-rent elements, mainly vegetation, water, ground, among others, and their respective contrasts. The most well- known is NDVI Normal Di-fference Vegetation Index (Rouse et al., 1974) to highlight the difference between vegetation and the rest of elements with digital numbers (DN) from -1 and 1. This procedure connects the near infrared and red bands, present in all the optic images used in this work.
A multitemporal study was chosen, using images from the year 1986 up to the present with this index, in order that it shows perfect-ly the variations in growth since the anthropic pressure, with excellent results. Another obser-ved indexes were: SAVI Soil Adjusted Vegetation Index (Huete, 1988) to determine the re-fective characteristics of the soil and MSAV12 Modifed Soil Adjusted Vegetation Index (Qi et al., 1994)(figure 6).

Figure 4. Resultant bands of the application of Principal Components in ENVI 5.01; the three last bands were omitted because of the almost null repercussion in the final results. / Figura 4. Bandas r esultantes de la aplicación de componentes Principales en ENVI 5.01; se omitier on las 3 últimas bandas por tener casi nula r epercusión en los r esultados finales.

Figure 5. PCA RGB543 bands combination with the 9% of total data, showing the Mendocino Piedmont. In this situation does not exist any positive valuation to distinguish lithological elements, but structural features are well recognised. / Figura 5. Combinación de bandas ACP RGB543 con el 9% de los datos totales, mostrando el piedemonte mendocino. En este caso no existe ninguna valoración positiva para distinguir elementos litológicos, pero si estructurales (es muy notoria la diferencia entre los cauces, los cuales se encuentran muy marcados y contrastados, lo que se explicaría a través de respuestas minoritarias que se observan muy bien en esta combinación).

Figure 6. NDVI índex applicated in the Piedmont área. The valúes of high radiometric resolution, whose máximum is DN 1, corres-pond with sectors of abundant vegetation, and , in an arid zone Hke this, it correspondí with antropic sectors. It is useful to determine in some cases erosión degree and temporal variations. / Figura 6. Aplicación del índice NDVI en el sector pedemontano precordillerano. Los valores de alta resolución radiométrica, cuyo máximo es el ND 1, se corresponden con sectores con vegetación abundante, por lo que en una zona árida como esta, se corresponde con sectores antropizados. No sirve para aplicaciones geológcas finas, pero si para establecer en algunos casos gado de erosión y variaciones temporales.
. Filters
Filters are methods to highlit or to re-move, in a selective way, data from an image in different spatial scales, to emphasize some ele-ments of the image, or also, to hide anomalous values. The process of fltering consists in the application of every one of the pixels of the image in a matrix fltering of NxN size ( genera-lly 3x3 although can be major) formed by whole numbers and that they generate a new value be-cause of a function of the original value and the
neighbor pixels.
The final result is divided between a sca-lar, generally the addition of the coefficients of the weighting. Here, in this point, it was used a directional flter to detect structures which fo-llow a certain direction in the space giving the contrast between the pixels located both sides of the structure (figures 7, 8).
. Classifications for Aluvial Basin Analysis Physyographic parameters related to the topographical relief, vegetal coverage, hydro-graphical network and human occupation, have been analyzed, in order to compare variables of Divisadero Largo, Papagayos and Frias basins. Those are suffering important modifications due to anthropic activities. For such analyses, digital elevation model ASTER GDEM, LAND-SAT 8 satellite images and geospatial data from land and environmental information system from Secretaría de Ambiente y Ordenamiento Territorial of Gobierno de Mendoza, were em-ployed. Slopes were classifed using the decision tree method and by applying the normalized difference vegetation index in order to incorpo-rate to a Geographic Information System along with contour lines, hydrographical network, dikes, human settlements and urban growth. Thus, interactions between the different invol-ved factors could be analized and their dinamics analyzed, furnishing a TIFF (.tif) cartographic output are presented.

Figure 7. 90° Directional flter, where it is clear to notice the high pass contrast of the elements W-E, different of the before one, reducing the border effect in the transverse valúes. / Figura 7. Filtrado direccional 90º donde se puede apreciar claramente el contraste de paso alto efectuado en los elementos de dirección O-E, a diferencia del anterior, disminuyendo el efecto de borde en los valores transversales.
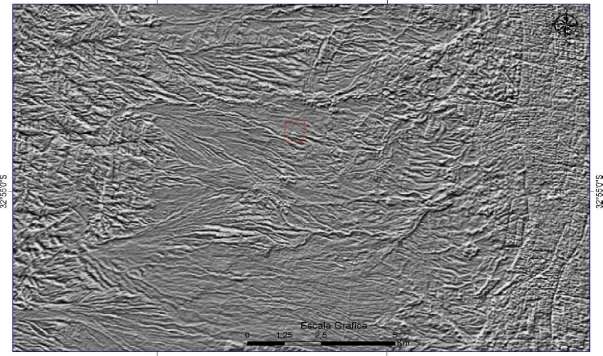
Figure 8. 75° Dkedional filter done to observe the anisotropies marked by fault unes and parallel straüficaüon, where a clear syntony between these structural elements and iheir response to this method can be observed / Figura 8. Filtrado direccional 75º realizado para observar las anisotropías marcadas por lineamientos de falla y de estratficación paralela, donde se puede observar una clara sintonía entr e estos elementos estructurales

Figure 9. Final Map of alluvional basin zonification, with the use of remote sensing products and processing, especially decision tree classification, NDVI index and other digital treatments. / Figura 9. Mapa final de la zonificación de cuenca aluvional, con el uso de productos de teledetección y procesamiento, especialmente clasificación de árboles de decisión, índice NDVI y otros tratamientos digitales.
Conclusions
The western zone of Great Mendoza is characterized by the sporadic alluvial contribu-tion of its basins, which translates into a natural danger registered by the damages caused historically. In addition, other phenomena of geological origin, such as seisms, place this area with a great vulnerability to natural events. The advance of the population settlement towards the west piedmont constitutes a strong deterio-ration that has been increasing in the last decades as a consequence of the unplanned urban growth.
That is why the identification of poten-tially dangerous structural elements, as well as an adequate geological mapping, is necessary to achieve the correct environmental ordering.
From the use of applied geotechnologies to the territory and the environment, it has been possible to visualize in a graphical way the ele-ments of the natural environment, to optimize in an quick form and low costs, the works ten-ding to the zoning of risks in the sector.
The work of interrelation of geospatial data gives the possibility to observe the inte-ractions of the natural factors with each other, as well as with the anthropic factor, allowing to observe the dynamics of the system.
It is concluded that the analysis of data from remote sensing and its subsequent pro-cessing allows in many cases to identify elements in an agile and accurate way. Geotechnologies provide important tools for preliminary work, providing relevant information, based on digital processing, especially in directional flters, contrast treatments and decision tree classifications.
Acknowledgments
To Ciencia y Técnica área of Universidad Juan Agustín Maza and Facultad de Filosofía y Letras of Universidad Nacional de Cuyo, for supporting this studies. Special thanks to Dr. Pablo Aceñolaza from the editorial committee.
References
Abraham, E., Roig, F. , Ibañes, G., Salomón, M. and Llorens, R. 2002. Aptitud Urbana del Piedemonte al Oeste del Gran Mendoza. 9o Jornadas Cuyanas de Geografía. [ Links ]
Capitanelli, R. 1972. Geomorfología y Clima de la provincia de Mendoza. Pp.15-48, en: F. Roig (ed.) geología, Geomorfología, Climatología, Fitogeografía y Zoogeografía de la Provincia de Mendoza. Reedición especial del Boletín de la Sociedad Argentina de Botánica 8. [ Links ]
Chuvieco, E. 1996. Fundamentos de Teledetección Espacial. Ediciones Rialp S.A. Madrid. 568 pp [ Links ]
Huete, A. R., 1988. A soil-adjusted vegetation index (SAVI). Remote Sensing of Environment. 25: 295-309. [ Links ]
Hutchinson, J. N. 1968. Mass Movement. In the Enciclopedia of Geomorphology (Fairbridge, R.W. Ed. Reinold Book Corp.). New York, pp. 688-696 [ Links ]
Prieto, M.R. 1989. Historia de la ocupación del espacio y uso de los recursos naturales en el Piedemonte de Mendoza. En: Roig, F.A (Ed). Detección y Control de la Deser-tificación, 139-153. [ Links ]
Qi, J., Chehbouni, A. L., Huete, A. R., Kerr, Y. H. and Sorooshian, S. 1994. A modifed soil adjusted ve-getation index (MSAVI). Remote Sensing of Enviroment, 48: 119-126.
Regairaz, A. C. and Barrera, R.O. 1975. Formaciones del Cuaternario, unidades geomorfológicas y su relación con el escurrimiento de las aguas en el Piedemonte de la Precordillera. Anais da Academia Brasileira de Ciencias, 47: 5-20, Rio de Janeiro.
Rouse, J.W., Haas, R. H., Schell, J. A. and Deering, D. W. 1974. Monitoring vegetation systems in the Great Plains with ERTS. In: Freden, S.C., Mercanti, E.P., Becker, M. (Eds.), Third Earth Resources Tech-nology Satellite-1 Symposium, Vol. 1: Technical Presentations, NASASP-351. National Aeronau-tics and Space Administration, Washington, DC, 309-317.
Recibido: 07 de Noviembre del 2016 Aceptado: 02 de Marzo del 2017

