


Services on Demand
Journal

Article
 English (pdf)
 Article in xml format
 Article references
 Send this article by e-mail
Indicators
-
 Cited by SciELO
Related links
-
 Similars in
SciELO
Similars in
SciELO  uBio
uBio
Share

 Permalink
Ecología austral
On-line version ISSN 1667-782X
Ecol. austral vol.11 no.2 Córdoba July/Dec. 2001
Population density sampling and dispersion pattern of Delphacodes kuscheli Fennah (Homoptera: Delphacidae) in oat crops
Eduardo V Trumper1,* & Oscar Garat2
1 INTA - E.E.A. Manfredi , Manfredi, Córdoba, Argentina
2 Ambiente Sur - Centro de Estudios para la Calidad y Recuperación Ambiental, Córdoba, Argentina
* INTA - E.E.A. Manfredi; Ruta Nac. 9, Km 636; 5988 Manfredi; ARGENTINA. Email: etrumper@arnet.com.ar
Received: 25 July 2001;
Revised: 16 November 2001;
Final version: 27 November 2001;
Accepted: 28 November 2001
ABSTRACT. Delphacodes kuscheli Fennah (Delphacidae) is the vector of the "Mal de Río Cuarto" virus, the causal agent of the most important corn disease in Argentina. Insect density, separated by developmental stage classes, sex and wing form, was estimated every 7–14 days during the spring, in an oat field in Córdoba Province, central Argentina, during the growing seasons of 1993 and 1994. Samples were taken with a gas-powered suction machine. Taylor's power law and Iwao's patchiness regression models were used to describe variance–mean relationships. All insect categories showed aggregated distributions. Taylor's indices of aggregation ranged from 1.137 for brachypterous adults to 1.983 for total adults and nymphs; Iwao's density-contagiousness coefficients ranged from 1.181 for female adults to 1.686 for I–II nymphs. All regressions for both models yielded coefficients of determination of at least 0.94. Density-dependent minimum sample sizes for fixed-precision levels were determined using the estimated Taylor's coefficients. Fixed-precision-level stop lines for sequential sampling plans for each category identified were developed based on fitted Taylor's power law (Green's method) and Iwao's model (Kuno's method). Advantages and limitations of the plans are discussed.
RESUMEN. Muestreo de densidad poblacional y patrón de dispersión de Delphacodes kuscheli Fennah (Homoptera: Delphacidae) en cultivos de avena: Delphacodes kuscheli Fennah (Delphacidae) es el vector del virus del Mal de Río Cuarto del Maíz, el agente causal de la enfermedad más importante del cultivo de maíz en Argentina. Se efectuaron muestreos de insectos discriminados por estados de desarrollo, morfos alares y sexo cada 7–14 días, durante la primavera, en cultivos de avena en la Provincia de Córdoba, Argentina, durante las estaciones de crecimiento de 1993 y 1994. Las muestras fueron tomadas mediante un aspirador a combustión. La relación entre la varianza y el promedio fue analizada mediante la ley de potencia de Taylor y el modelo de regresión de agrupamiento de Iwao. Todas las categorías de insectos evidenciaron distribuciones agrupadas. El índice de agregación de Taylor varió entre 1.137 en adultos braquípteros y 1.983 en el total de adultos y ninfas. El coeficiente de contagio densodependiente de Iwao varió entre 1.181 en hembras adultas y 1.686 en ninfas I–II. Todos los análisis de regresión de ambos modelos tuvieron coeficientes de determinación iguales o superiores a 0.94. Sobre la base de los parámetros de ajuste de la ley de Taylor, se obtuvieron curvas del número mínimo de muestras para niveles fijos de precisión. Se calcularon las curvas críticas de muestreo secuencial para niveles fijos de precisión para todas las categorías discriminadas, basándose en los ajustes de la ley de Taylor (Método de Green) y del modelo de Iwao (Método de Kuno). Se discuten sus ventajas y limitaciones.
INTRODUCTION
The "Mal de Río Cuarto del Maíz" (Río Cuarto Corn Disease; hereafter MRC) has become the most important disease of corn over a large area in central Argentina, particularly in the southwest of Córdoba Province, where MRC is endemic and occurs at high levels almost every year (Grilli & Gorla 1997). MRC is caused by the "Mal de Río Cuarto" virus (Fijivirus; hereafter MRCV) (Conci & Marzachí 1993) which is transmitted by the planthopper Delphacodes kuscheli Fennah (Homoptera: Delphacidae) (Remes Lenicov et al. 1985). Economic losses caused by MRC were around 100 million US dollars during 1983–1993 (IG Laguna, INTA, pers. comm.), and a devastating epidemic occurred during the 1996/97 growing season.
Delphacodes kuscheli has a seasonal life cycle with most of the generations occurring during late spring and early summer. During November and December, one generation is completed in approximately one month (Virla & Remes Lenicov 1991). The immature stage has five instars. Both male and female adults show wing polymorphism; i.e., macropterous (long-winged) and brachypterous (short-winged) forms.
Delphacodes kuscheli does not reproduce on corn (Virla & Remes Lenicov 1991) but rather on several wild gramineaceus plants and winter cereals (Remes Lenicov et al. 1991; Ornaghi et al. 1993). In the endemic area, a high proportion of fields are planted with oat (Avena sativa L.), making this crop the most important overwintering host and the main source from which the vector immigrates to corn in the spring (Trumper 1996). Oat has also been identified as one of the natural hosts of MRCV (Giménez Pecci et al. 1993).
One of the most common management tactics used by growers is planting as early as possible to avoid the highest densities of D. kuscheli. However, this management option has limitations as growers have to make a decision under uncertainty because both density and time of peak occurrence of vector populations vary among years and locations (Grilli & Gorla 1997). An empirical predictive model has been developed that helps growers make a decision about cultivar selection and planting date (March et al. 1995).
The development of monitoring programs to estimate vector abundance could contribute to improve pest management decision making as well as population dynamics studies. When estimating insect densities, it is necessary to balance sample size with precision of the estimate and to minimize the number of samples needed to obtain a specified level of precision. Fixed size and sequential sampling plans for estimation of D. kuscheli population density were developed earlier under the assumption of the negative binomial probability distribution model fitting the sampling distribution pattern of insect counts (Garat et al. 1999). This approach requires a good estimation of the parameter k of the negative binomial model, representative of all data sets upon which the sampling protocol is calculated. However, these sampling plans result in larger sample sizes than needed to attain the desired precision due to positively biased estimates of the variance (Young & Young 1999). The spatial distribution of an insect population can be approximated by a relationship between the variance and the mean of the insect counts per sample unit (Kuno 1969, 1991; Taylor 1984). The objective of this work was to develop fixed-precision sampling plans based on the study of the dispersion pattern of sampling counts with variance–mean relationships.
METHODS
Field work
This study was carried out during two growing seasons (1993 and 1994) on a 5 ha oat field used for cattle grazing, located at El Espinillo (Córdoba Province, Argentina), within the endemic area of MRC. Eight and six visits to the field were carried out during the first and second season, respectively. Samples were collected from approximately the third week after plant emergence (October), until significant crop decay was observed in December. Forty-two sampling units were taken on each sampling date, following a systematic protocol with a random start. Each sampling unit consisted of all the insects collected along 3 m of row with a gas-powered suction machine.
Collected insects were sorted to species, sex, wing form, and development stage, with a stereomicroscope. Nymphs were sorted to stage classes I–II, III, IV, and V. No insecticide was used throughout the study, and no use was made of the fields other than cattle grazing.
Variance–mean models
Two approaches, one empirical and the other deductive, have been used as general models to describe the variance-mean relationship (Kuno 1991). Taylor's (1984) power law is a consistent empirical relationship between variance (s2) and mean (m) given by
s2 = a · mb . (Eq. 1)
Although more complex interpretations can be made (Taylor et al. 1978; Davis & Pedigo 1989; Hughes 1996), in practice b is often regarded as a species-specific measure of dispersion of sample counts, with b > 1, b = 1, and b < 1 indicating aggregated, random, and regular spatial patterns, respectively, and a is a sampling factor. Taylor's coefficients can be estimated according to equation 2, which yields the least-squares regression parameters log10a and b. The estimate of a by antilog10 (log10a) is biased (Badenhausser 1996). Badenhausser applied a correction to approximate for a from the least-squares regression coefficient log10a = ![]() , where SE(log10a) is the standard error of log10a in the leastsquares regression.
, where SE(log10a) is the standard error of log10a in the leastsquares regression.
log(s2 )= log a + b · log(m) . (Eq. 2)
The deductive approach is the Iwao's patchiness model, based on the assumption that Lloyd's mean aggregation parameter m*= m + (s2/m) - 1 is linearly related to the mean through the regression equation:
m* = α + ß · m , (Eq. 3)
where α and ß are regression constants characteristic of a species. The intercept α, the index of basic contagion, is 0 for distributions where a single individual is the basic unit, and is positive where populations exist as groups of individuals or clumps. The slope ß, the density-contagiousness coefficient, describes how individuals or clumps distribute themselves in the habitat and takes the values of ß < 1,ß = 1, and ß > 1 for individuals or clumps arranged in uniform, random or aggregated patterns, respectively (Davis 1994).
Sampling plans
Standard sampling.– The standard procedure for estimating the population density is to take an appropriate number of samples from the field and then to estimate the mean density. The conventional requirement for sampling accuracy is that the standard error of the mean (s/√n) does not exceed some fraction (D) of the true mean: s/√n < Dm or s2/n < D2m2. Then, n should be equal to or greater than s2/m2D2. If the spatial variance can be related to the mean density according to Taylor's power law (Equation 1), then the necessary sample size for securing a fixed precision level D is given by
Sequential sampling.– Sequential sampling is a method with which the number of samples required to estimate the density is not fixed in advance and the decision as to whether sampling should be interrupted or not is made after each sampling unit is inspected (Jones 1994). The sequential sampling method is based on the standard error d for the sample mean, d = s/√n, and its only premise concerning the spatial pattern is to express the variance (s2) as a defined function of the mean m, f(m), where m can be expressed as Tn/n, Tn being the cumulative total of individuals for the sample units (Kuno 1969). Then, the precision level is
Green´s (1970) method to calculate fixed-precision sequential sampling stop lines uses Taylor´s model in place of f(m). Then, from equations 1 and 5 it holds that
Kuno's (1969) method to calculate fixed-precision sequential sampling stop lines uses Iwao's model in place of f(m):
Kuno's stop line is subject to the restriction that n > (ß - 1)/D2.
RESULTS AND DISCUSSION
Variance–mean relationships
The mean number of immature and adult D. kuscheli per unit sample ranged from 5.02 to 386.30, and from 1.00 to 44.70, respectively. Densities were clearly higher during the 1993 season.
Regression statistics for the linearized Taylor's variance–mean relationship were established separately for each category of D. kuscheli (Table 1). All the regressions were highly significant (P < 0.01), with R2 ≥ 0.96. Most of the indices of aggregation, as given by Taylor's b coefficient, ranged from 1.137 to 1.983, indicating strong tendency for aggregation, feature that is typical for crop pests (Ruesink 1980). These aggregation indices are higher than those reported by Perfect & Cook (1983) for the rice brown planthopper Nilaparvata lugens using Taylor's power law. Figure 1 shows the regressions of log s2 against log m for nymphs and adults.
Table 1. Regression statistics and coefficient of determination of the linearized Taylor´s power law fitted to data of each category of D. kuscheli identified in oat fields at El Espinillo. a is equal to ![]() .
.
Tabla 1. Parámetros de la regresión y coeficiente de determinación del ajuste de la ley de potencias de Taylor a los datos de cada categoría de D. kuscheli identificada en cultivos de avena en El Espinillo. a es igual a ![]() .
.
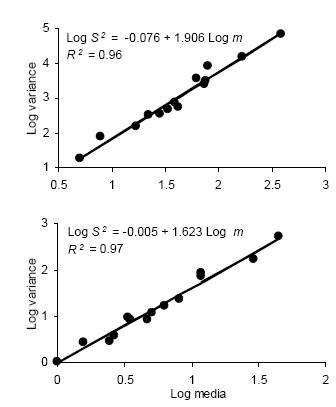
Figure 1. Linear regression of log10 of variance (S2) on log10 of mean (m) for counts of D. kuscheli nymphs (above) and adults (below) per sample unit (Taylor's power law) in oat fields at El Espinillo. Data from growing seasons 1993 and 1994 were pooled in a single data set.
Figura 1. Regresión lineal del log10 de la varianza (S2) sobre el log10 del promedio (m) de ninfas (arriba) y adultos (abajo) de D. kuscheli por unidad muestral (ley de potencias de Taylor) en cultivos de avena en El Espinillo. Los datos de las campañas agrícolas 1993 y 1994 fueron agrupados en un solo conjunto de datos.
Iwao's regression model yielded significant linear regressions for all categories (P < 0.01) with R2 ranging from 0.94 to 0.99. All values of ß were greater than 1, indicating again an aggregated spatial pattern. Figure 2 shows the regressions of mean crowding parameter m* against mean of insect counts per unit sample.
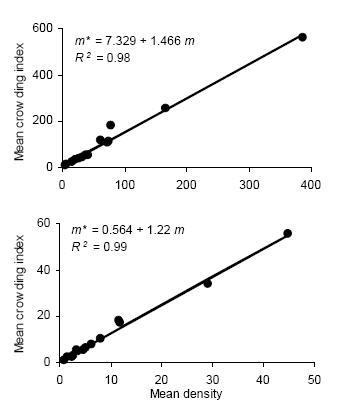
Figure 2. Linear regression of the mean crowding index (m*) on mean density (m) for counts of D. kuscheli nymphs (above) and adults (below) per sample unit (Iwao's patchiness regression) in oat fields at El Espinillo. Data from growing seasons 1993 and 1994 were pooled in a single data set.
Figura 2. Regresión lineal del índice de apiñamiento promedio (m*) sobre la densidad promedio (m) de ninfas (arriba) y adultos (abajo) de D. kuscheli por unidad muestral (regresión de apiñamiento de Iwao) en cultivos de avena en El Espinillo. Los datos de las campañas agrícolas 1993 y 1994 fueron agrupados en un solo conjunto de datos.
With either Taylor's or Iwao's method, it is clear that among the different categories identified, nymphs, particularly those of the I–II stage class, showed the highest degrees of aggregation. The lower ability and opportunity of young nymphs for dispersing from the plant where they were born could explain this. The same relationships apply when counts from both growing seasons are taken as separate sets of data.
Both Taylor's and Iwao's regression methods provide practical tools for handling field sampling data from experiments or surveys, and they have mean density included in the relationship so that problems of continuity with changing density are removed (Taylor 1984; Binns & Nyrop 1992). Although the empirical model (Taylor's power law) has a higher descriptive ability than Iwao's deductive model (Kuno 1991), the latter has the advantage of being derived with close reference to theoretical distribution models with biological interpretation (Kuno 1972, 1991; Taylor 1984).
Sampling plans
Standard sampling.– The necessary sample size for securing a fixed precision level D was calculated by using equation 4. The minimum sample size required for a precision level of D = 0.1 is very sensitive to the degree of aggregation, as illustrated by the difference between the n–m relationships (Figure 3). For research purposes a sample size of approximately 100 units may be feasible but it could be prohibitive for pest management decision making. Adopting a lower precision level (e.g., D = 0.2), the required sampling is much less demanding and fairly constant throughout the density range.
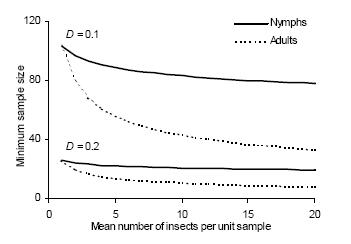
Figure 3. Density-dependent minimum sample size to estimate density of immature and adult D. kuscheli with fixed precision levels (D = 0.1 and D = 0.2).
Figura 3. Tamaño mínimo de muestra para estimar la densidad de estadios inmaduros y adultos de D. kuscheli con niveles fijos de precisión (D = 0.1 y D = 0.2).
A minimum sample size table for D. kuscheli sampling in oat fields can be prepared using equation 4 and the data from Table 1. However, it might be difficult to use this approach because the mean density is not known in advance, and a preliminary estimation of mean density would be required at each sampling date (Smith & Hepworth 1992).
Sequential sampling.– To carry out a sequential sampling plan, sample units are taken and planthoppers are counted. If the point (ni, Tni) (ni= number of sample units taken; Tni= cumulative planthopper counts on the ni units) is below the line for the required precision level (D), it is necessary to continue the sampling because the fixed, predetermined level of precision has not been achieved. When the point (ni, Tni) is above the boundary line for the desired level of precision, the mean can be estimated as Tni/ni and the required level of precision is obtained. Use of stop lines provides a method for obtaining time-efficient estimates of population numbers at desired levels of precision.
The intersection of stop lines and convex lines in Figures 4 and 5 indicates the average number of samples necessary to estimate D. kuscheli density at a predetermined precision level. Thus, for example, according to Green's stop lines, for mean densities of less than 10 adults per sample unit, more than 40 samples are required, while for mean densities above 50, less than 20 samples are needed.
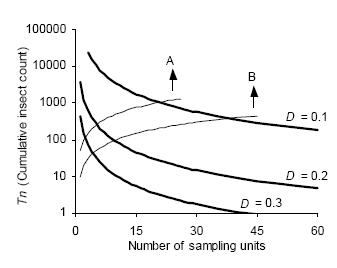
Figure 4. Green's sequential sampling stop lines (concave curves) for estimating densities of adult D. kuscheli with three fixed precision levels (D = 0.1, D = 0.2, and D = 0.3). Convex curves A and B represent the expected cumulative number of insects for a given mean density. Intersections of lines A and B with stop lines represent the average number of samples required for each precision level.
Figura 4. Curvas críticas del protocolo de muestreo secuencial de Green (curvas cóncavas) para la estimación de la densidad de adultos de D. kuscheli con tres niveles fijos de precisión (D = 0.1, D = 0.2 y D = 0.3). Las curvas convexas A y B representan el número acumulado de insectos esperado para una determinada densidad promedio. Las intersecciones de las líneas A y B con las curvas críticas representan el número promedio de unidades muestrales requeridas para cada nivel de precisión.
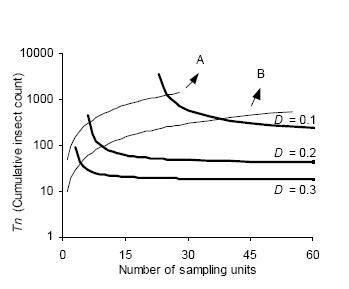
Figure 5. Kuno's sequential sampling stop lines (concave curves) for estimating densities of adult D. kuscheli with three fixed precision levels (D = 0.1, D = 0.2, and D = 0.3). Convex curves A and B represent the expected cumulative number of insects for a given mean density. Intersections of lines A and B with stop lines represent the average number of samples required for each precision level.
Figura 5. Curvas críticas del protocolo de muestreo secuencial de Kuno (curvas cóncavas) para la estimación de la densidad de adultos de D. kuscheli con tres niveles fijos de precisión (D = 0.1, D = 0.2 y D = 0.3). Las curvas convexas A y B representan el número acumulado de insectos esperado para una determinada densidad promedio. Las intersecciones de las líneas A y B con las curvas críticas representan el número promedio de unidades muestrales requeridas para cada nivel de precisión.
Sequential sampling plans are affected by the degree of aggregation of populations. Figure 6 compares the critic lines based on Taylor 's power law (Green's method), calculated for a precision level D = 0.2 corresponding to nymphs (b = 1.906) and adults (b = 1.623). A mean density of 50 insects would require a sample size of 13 or 5 units, if those are nymphs or adults, respectively. Had any of these categories shown a random dispersion pattern (b = 1), the stop line would be a constant. Stop lines for alternative precision values and various categories of D. kuscheli can be easily calculated from equations 6 and 7, and parameters a, b, α and ß are presented in Tables 1 and 2.
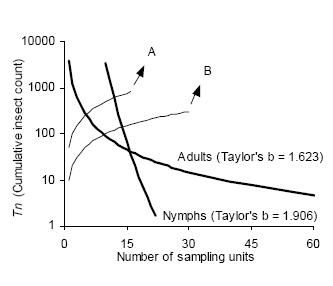
Figure 6. Comparison of Green's sequential sampling stop lines (concave curves) for estimating densities of adult and nymphs of D. kuscheli with D = 0.2. Convex curves A and B represent the expected cumulative number of insects for a given mean density. Intersections of lines A and B with stop lines represent the average number of samples required for each precision level.
Figura 6. Comparación de las curvas críticas del protocolo de muestreo secuencial de Green (curvas cóncavas) para la estimación de la densidad de adultos y ninfas de D. kuscheli con D = 0.2. Las curvas convexas A y B representan el número acumulado esperado de insectos para una determinada densidad promedio. Las intersecciones de las líneas A y B con las curvas críticas representan el número promedio de unidades muestrales requeridas para cada nivel de precisión.
Table 2. Regression statistics and coefficient of determination of Iwao´s regressions for each category of D. kuscheli identified in oat fields at El Espinillo.
Tabla 2. Parámetros y coeficiente de determinación de la regresión de Iwao para cada categoría de D. kuscheli identificada en cultivos de avena en El Espinillo.
Under some circumstances, estimating densities of different development stages or stage classes of a single species could be relevant. Predictive models for insect population abundance could be expanded to include densities of immature and adults as separate independent variables. Additionally, population dynamics studies requiring stage frequency analysis (Manly 1989) would certainly need precise density estimations of each development stage. In such cases the researcher can build a sample model for the whole group (all categories) using sample estimates of the group, or he can develop a plan for the category with the most variable sampling distribution and apply it to all the categories (Binns & Nyrop 1992).
Monte Carlo simulation (Naranjo & Flint 1994) and resampling (Naranjo & Hutchinson 1997) studies show that the precision level specified in a sequential sampling plan can differ from that actually achieved when the plan is executed. Consequently, sampling plans should be taken as provisional guidance until they are validated through simulation or against independent field data. An additional limitation is the spatial scale with which this study was done. Definitive monitoring plans should be based on data gathered at different localities if they are to be adopted by farmers or agronomists. Despite these constraints, and considering the complete lack of alternative criteria for monitoring the MRC vector in Argentina, the sampling plans proposed in this paper could be of much help in the future.
ACKNOWLEDGEMENTS
Financial support from INTA-PROMARC is gratefully acknowledged. David Gorla provided a helpful guidance during an early phase of this work, and Natalia Pérez-Harguindeguy gave us valuable field assistance.
REFERENCES
BADENHAUSSER, I. 1996. Sequential sampling of Brachycaudatus helichrysi (Homoptera: Aphididae) in sunflower fields. J. Econ. Entomol. 89(6):1460–1467. [ Links ]
BINNS, MR & JP NYROP. 1992. Sampling insect populations for the purpose of IPM decision making. Annu. Rev. Entomol. 37:427–453. [ Links ]
CONCI, LR & C MARZACHÍ. 1993. Avances en la caracterización molecular del genoma del virus causal del "Mal de Río Cuarto". Pp. 27–28 in: Actas del workshop "Mal de Río Cuarto del Maíz". INTA, Córdoba, Argentina. [ Links ]
DAVIS, PM & LP PEDIGO. 1989. Analysis of spatial patterns and sequential count plans for stalk borer (Lepidoptera: Noctuidae). Environ. Entomol. 18:504–509. [ Links ]
DAVIS, P. 1994. Statistics for describing populations. Pp. 33–54 in: LP Pedigo & GD Buntin (eds). Handbook of sampling methods for arthropods in agriculture. CRC Press, Boca Ratón, USA. [ Links ]
GARAT, O; EV TRUMPER; DE GORLA & N PÉREZ-HARGUINDEGUY. 1999. Spatial pattern of the Río Cuarto Corn Disease vector, Delphacodes kuscheli Fennah (Hom., Delphacidae), in oat fields in Argentina and design of sampling plans. J. Appl. Entomol. 123:121–126. [ Links ]
GIMENEZ PECCI, MP; IG LAGUNA; EL DAGOBERTO & G TRUOL. 1993. Avena sativa L. hospedante natural del virus causal del "Mal de Río Cuarto" del Maíz. Pp. 59–60 in: Actas del workshop "Mal de Río Cuarto del Maíz". INTA, Córdoba, Argentina. [ Links ]
GREEN, RH. 1970. On fixed precision level sequential sampling. Res. Popul. Ecol. 12:249–251. [ Links ]
GRILLI, MP & DE GORLA. 1997. The spatio–temporal pattern of Delphacodes kuscheli (Homoptera: Delphacidae) abundance in central Argentina. Bull. Entomol. Res. 87:45–53. [ Links ]
HUGHES, G. 1996. Incorporating spatial pattern of harmful organisms into crop loss models. Crop Prot. 15:407–421. [ Links ]
JONES, VP. 1994. Sequential estimation and classification precedures for binomial counts. Pp. 175–205 in: LP Pedigo & GD Buntin (eds). Handbook of sampling methods for arthropods in agriculture. CRC Press, Boca Ratón, USA. [ Links ]
KUNO, E. 1969. A new method of sequential sampling to obtain the population estimates with a fixed level of precision. Res. Popul. Ecol. 11:127–136. [ Links ]
KUNO, E. 1972. Some notes on population estimation by sequential sampling. Res. Popul. Ecol. 14:58–73. [ Links ]
KUNO, E. 1991. Sampling and analysis of insect populations. Annu. Rev. Entomol. 36:285–304. [ Links ]
MANLY, BFJ. 1989. A review of methods for key factor analysis. Pp. 169–189 in: L McDonald; B Manly; J Lockwood & J Logan (eds). Estimation and analysis of insect populations. Springer Verlag, Berlin, Germany. [ Links ]
MARCH, G; M BALZARINI; JA ORNAGHI; JE BEVIACQUA & A MARINELLI. 1995. Predictive model for "Mal de Río Cuarto" disease intensity. Plant Dis. 79:1051–1053. [ Links ]
NARANJO, SE & HM FLINT. 1994. Spatial distribution of preimaginal Bemisia tabaci (Homoptera: Aleyrodidae) in cotton and development of fixed-precision sequential sampling plans. Environ. Entomol. 23:254–266. [ Links ]
NARANJO, SE & WD HUTCHISON. 1997. Validation of arthropod sampling plans using a resampling approach: software and analysis. Am. Entomol. 43:48–57. [ Links ]
ORNAGHI, J; G BOITO; G SANCHEZ; G MARCH & J BEVIACQUA. 1993. Studies on the populations of Delphacodes kuscheli Fennah in different years and agricultural areas. J. Gen. Breed. 47:277–282. [ Links ]
PERFECT, TJ & AG COOK. 1983. Population sampling for planthoppers, leafhoppers (Hemiptera: Delphacidae & Cicadellidae) and their predators in flooded rice. Bull. Entomol. Res. 73:345–355. [ Links ]
REMES LENICOV, AMM; A TESON; E DAGOBERTO & N HUGUET. 1985. Hallazgo de uno de los vectores del "Mal de Río Cuarto" del maíz. Gaceta Agron. 5:251–258. [ Links ]
REMES LENICOV, AMM; E VIRLA & E DAGOBERTO. 1991. Cambios estacionales en las poblaciones del vector del Mal de Río Cuarto (Delphacodes kuscheli Fennah) en cultivos de avena y sus malezas circundantes en Sampacho, Córdoba. Pp. 116–129 in: Actas del I Taller de Actualización sobre Mal de Río Cuarto. INTA-CIMMYT, Pergamino, Argentina. [ Links ]
RUESINK, WG. 1980. Sequential sampling plans for soybean arthropods. Pp. 61–78 in: M Kogan & DC Herzog (eds). Sampling methods in soybean entomology. Springer-Verlag, New York, USA. [ Links ]
SMITH, AM & G HEPWORTH. 1992. Sampling statistics and a sampling plan for eggs of pea weevil (Coleoptera: Bruchidae). J. Econ. Entomol. 85:1791–1796. [ Links ]
TAYLOR, LR. 1984. Assesing and interpreting the spatial distributions of insect populations. Annu. Rev. Entomol. 29:321–357. [ Links ]
TAYLOR, LR; IP WOIWOD & JN PERRY. 1978. The density-dependence of spatial behaviour and the rarity of randomness. J. Anim. Ecol. 47:383–406. [ Links ]
TRUMPER, EV. 1996. Modelos de epidemiología matemática aplicados al estudio del sistema Virus MRC-maíz-Delphacidae ("Mal de Río Cuarto"). Doctoral thesis. Universidad Nacional de Córdoba, Córdoba, Argentina. 78 pp. [ Links ]
VIRLA, E & AMM REMES LENICOV. 1991. Ciclo de vida de Delphacodes kuscheli sobre diferentes hospedantes en condiciones de laboratorio. Pp. 104– 115 in: Actas del I Taller de Actualización sobre Mal de Río Cuarto. INTA-CIMMYT, Pergamino, Argentina. [ Links ]
YOUNG, LJ & JH YOUNG. 1999. Statistical ecology. A population perspective. Kluwer, Boston, USA. [ Links ]

