


Servicios Personalizados
Revista

Articulo
 Inglés (pdf)
 Articulo en XML
 Referencias del artículo
 Enviar articulo por email
Indicadores
-
 Citado por SciELO
Links relacionados
-
 Similares en
SciELO
Similares en
SciELO  uBio
uBio
Compartir

 Permalink
Ecología austral
versión On-line ISSN 1667-782X
Ecol. austral v.13 n.1 Córdoba ene./jun. 2003
TRABAJOS ORIGINALES
Relationship among grain-size, plant communities, and fluvial and eolian processes in a piedmont of the central Andes in Argentina
María M González Loyarte*
Botany and Phytosociology, and Desertification Assessment and Control units, Argentinian Research Institute for Arid Lands (IADIZA), CRICYT - CONICET, Mendoza, ARGENTINA.
* IADIZA, CRICYT - CONICET, P.O.Box 507, 5500 Mendoza, Argentina. Email: gloyarte@lab.cricyt.edu.ar
Recibido: 10 mayo 2002;
Revisado: 7 octubre 2002;
Aceptado: 8 octubre 2002
ABSTRACT. The relationship among modern geomorphological processes, grain-size of surface sediments, and vegetation was analyzed in an alluvial fan in the piedmont of the Cordillera Frontal (Andes Mountains). Statistical parameters of grain-size distribution were calculated according to a standard graphical method. Plant communities were studied by applying a standard floristic-ecological method. A sensitivity analysis of grain-size parameters and plant communities in relation to geomorphological processes was made, based on literature, to compare results. Indicator species of fluvial, eolian and soil erosion processes were identified. Contemporary surface modifications by fluvial and eolian processes produce distinct surface sediment size parameters (mean diameter, standard deviation, skewness and kurtosis). The vegetation pattern follows these differences since communities with riparian species (Proustia cuneifolia var. mendocina and Eupatorium buniifolium) characterize the terraces and the young alluvial fan with fluvial processes, and psammophytes (Grindelia chiloensis, Aristida subulata, Poa lanuginosa, Glandularia parodii) characterize different communities developed under eolian activity.
Keywords: Grain-size analysis; Plant communities; Fluvial/eolian processes; Phytosociology; Indicator species.
RESUMEN. Relaciones entre granulometría, comunidades vegetales y procesos hídricos y eólicos en un piedemonte de los Andes centrales de Argentina. Se analizó la relación entre la granulometría de los sedimentos, las comunidades vegetales y los procesos geomorfológicos dominantes que actúan en la superficie de un extenso abanico aluvial donde los pisos de vegetación se interrumpen para ser reemplazados por comunidades edáficas relacionadas con procesos hídricos y eólicos modernos. La zona estudiada está en el piedemonte de la Cordillera Frontal, en el abanico aluvial del río Las Tunas, provincia de Mendoza, Argentina. Se analizaron en particular los segmentos medio y bajo de dicha unidad geomorfológica, donde se localizan las comunidades edáficas. Para el análisis granulométrico de los sedimentos superficiales se usó la técnica de tamizado para partículas de 4-0.0625 mm. Los parámetros estadísticos (diámetro promedio, desviación estándar, asimetría y curtosis) se calcularon con un método gráfico estándar. La vegetación se analizó aplicando el método fitosociológico. Se evaluó la sensibilidad de los parámetros estadísticos de los sedimentos mediante comparación con resultados bibliográficos en diversas condiciones ecológicas. El análisis de sensibilidad de las comunidades vegetales se realizó confrontando las especies características o más representativas de cada comunidad, según los procesos geomorfológicos dominantes, con antecedentes bibliográficos, y se infirieron especies indicadoras de procesos hídricos, eólicos y de remoción de suelo. Se calculó para cada especie un valor indicador, según un método conocido que combina la especificidad con la fidelidad de las especies de cada comunidad. Los procesos hídricos y eólicos y su intensidad fueron reflejados por los parámetros estadísticos de los sedimentos, por las comunidades vegetales y por las especies indicadoras. El diámetro promedio los sedimentos varió entre 2.08-3.16 Φ (arenas finas a muy finas) para los sedimentos eólicos y 1.02-2.42 Φ (arenas medias a finas) para los de origen hídrico. La desviación estándar del diámetro varió entre 0.63-1.14 Φ (moderadamente seleccionados a algo pobremente seleccionados) para los sedimentos de origen eólico y 1.20-1.92 Φ (pobremente seleccionados) para los de origen hídrico. La asimetría varió entre (-0.363)-(+0.219) Φ (predominantemente negativa a algo positiva) para los sedimentos eólicos y (-0.421)-(-0.228) Φ (muy negativa a negativa) para los hídricos. La curtosis varió entre 0.8-1.36 Φ (platicúrtica a leptocúrtica) para sedimentos eólicos y 0.90-1.96 Φ (platicúrtica a muy leptocúrtica) para los de origen hídrico. La vegetación siguió el patrón granulométrico: las especies riparias Proustia cuneifolia var. mendocina y Eupatorium buniifolium caracterizaron las terrazas y el abanico aluvial joven que presentan procesos hídricos, y las psamófilas Grindelia chiloensis, Poa lanuginosa, Glandularia parodiila y Panicum urvilleanum caracterizaron las comunidades desarrolladas bajo procesos eólicos. Se detectó un total de 40 especies indicadoras: 10 de procesos hídricos, 10 de eólicos y 20 de remoción de suelo. Las relaciones más claras entre especies indicadores, granulometría y procesos involucraron al diámetro promedio y al grado de selección de los sedimentos. El grano promedio se incrementa desde las comunidades con intensos procesos hídricos hasta un máximo en comunidades eólicas de alta cobertura vegetal, para luego disminuir en las comunidades donde la deflación es intensa y remueve los granos más finos (arenas muy finas, limos y arcilla) dejando in situ arenas finas a medias. La desviación estándar, en cambio, decrece desde los sedimentos fluviales pobremente seleccionados hasta los sedimentos eólicos moderadamente seleccionados de los médanos vivos donde la cobertura vegetal es mínima. Los parámetros estadísticos de los sedimentos generados por procesos hídricos y eólicos pueden ser mejor interpretados en el contexto regional, donde la distancia recorrida hasta su deposición ejerce una influencia en la selección de los sedimentos. La vegetación revela con claridad estos procesos geomorfológicos tanto al nivel de la comunidad como de especies indicadoras, por lo cual el análisis de la vegetación puede aplicarse para identificar y caracterizar el estilo e intensidad de las modificaciones superficiales de los sedimentos. La relación entre granulometría de sedimentos, procesos geomorfológicos y comunidades vegetales contribuye a una mayor comprensión de la influencia de los procesos actuales en el modelado y en la consecuente distribución de vegetación.
Palabras clave: Análisis granulométrico; Comunidades vegetales; Procesos hídricos y eólicos; Fitosociología; Especies indicadoras.
INTRODUCTION
In an extensive landform, such as a regional piedmont, different geomorphological processes coexist. Some modern geomorphological processes may be accentuated at the local level. May these local modifications be strong enough to modify regional features? Are the dominant modern geomorphological processes reflected in superficial sediments and hence in vegetation characteristics? In order to examine the relationships among geomophological processes, superficial sediments and vegetation patterns, a piedmont of the central Andes of Argentina was analyzed.
In the alluvial fan of Las Tunas river, the zonal vegetation pattern shows an interruption in its middle portion, and lower segments where some edaphic communities, related to modern fluvial and eolian processes acting on the alluvial fan surface, are established. Geomorphological dynamics started over the coarse sediments of Las Tunas alluvial fan, where a parallel-subparallel drainage system was built by mountain runoff. Later the alluvial fan was trenched, and within the distal part of the trench a younger fan segment was deposited. The cause of the trenching-aggradation sequence may have been tectonic or climatic, or a combination of both (Barrera 1970; Polanski 1972). Thus, the current perennial stream of Las Tunas river runs 70 m below the fan surface at the upper segment (old fan), but only 4-6 m below the lower segment (young fan). This concentration of runoff into the fan trench rendered the subparallel drainage on the surface of the old fan no longer functional (González Loyarte 1991). As a result, this old alluvial fan changed from the braided streams model to a modern eolian model, particularly in the middle segment (1600-1850 m.a.s.l.) where nebkhas and deflation stripes ending eastwards with active inland sand dunes (parabolic dunes) are present. Alluviation of the old fan could have been a sand source that contributed to the occurrence of eolian processes inasmuch as parabolic dunes and deflation stripes follow the direction of some of these no longer functional streams (González Loyarte 1991). Parabolic dunes present a local deflation that produces a slow nose migration (Thomas 1992). In contrast, the river bed, the Holocene terraces and the young fan are under the influence of modern fluvial processes. Occasional floods reach the lower terrace (< 1 m high); the higher terrace (3-4 m above the river bed) is beyond reach of flooding events. The young fan shows fluvial activity in ephemeral streams but also eolian activity in interfluves where nebkhas are developed.
Zonal vegetation presents three vegetation belts: the shrubland of Nassauvia axillaris, Tetraglochin alatum, and Junellia juniperina on the border of the Cordillera Frontal (over 2250 m.a.s.l.), and the grassland of Stipa tenuissima in the upper piedmont (1800-2250 m.a.s.l.), both belonging to the Andean-Patagonian Phytogeographic Domain, and the shrubland of Larrea divaricata in the lower piedmont (below 1750 m.a.s.l.), which belongs to the Monte Province in the Chacoan Phytogeographic Domain (Roig 1989). The vegetation pattern in the middle and lower segments of Las Tunas alluvial fan does not represent an ecotone between two zonal vegetation units (despite the presence of species of adjacent vegetation belts), but edaphic communities related to geomorphological processes under way on the alluvial fan (González Loyarte 1985).
In connection with geomorphological processes, grain-size analysis of sediments proved to be a suitable mean for distinguishing the different origins of beaches, dunes, eolian flats and river sands, because of their relation with transport and deposition dynamics (Folk & Ward 1957; Mason & Folk 1958; Friedman 1961; Krumbein & Sloss 1969; Folk 1971; Wadhawan 1996). According to Ehrlich (1983) the mean (or median) size and sorting measures have indeed become practical tools and might be used routinarily.
Vegetation dynamics may be the result of geomorphic processes like those occurring in fluvial dynamics (Pautou et al. 1985; Petit & Schumacker 1985), eolian activity (Doing 1985) or cryoturbation (Baudière et al. 1985; Delpech 1985), and therefore some of the species may become indicators of such processes. The vegetation itself is a very good indicator of ecological processes (Le Houérou 1969; Roig 1989).
The aim of this study was to examine the relationship among the nature and intensity of fluvial and eolian processes, grain-size distribution of sediments, and plant communities in an alluvial fan. Sediments were sieved and a standard graphical method was applied to derive the statistical parameters: mean diameter, standard deviation, skewness and kurtosis. Vegetation was studied by using the Phytosociological method. Fluvial and eolian processes and their intensity were distinguished by the sediment parameters. Plant communities responded to these processes. Within the scope of the vegetation/grain-size/geomorphological processes relationship, a sensitivity analysis based on literature was performed. Several indicator species of fluvial, eolian and erosion processes were detected; an indicator index value was calculated, by a known method, for each species and plant community.
STUDY AREA
The area is located in the vast piedmont of the Cordillera Frontal (Andes Mountains) in central western Argentina (Tupungato, Mendoza), between 1500 and 1900 m.a.s.l. (Figure 1a), and extends over the middle and lower segment of the alluvial fan formed by Las Tunas river (Figure 2 and 3) during the Upper Pleistocene (Polanski 1962, 1972). The piedmont may be an outwash plain from the last glaciation, tentatively ascribed to the Early-Middle Wisconsin stage (Regairaz 1994). Later, during the Holocene, according to Polanski (1972), an accumulation of mainly eolian sediments covered all of the Cordillera Frontal piedmont. This fan, resulting from a catchment area of 656 km2, is 15 km long (with a maximal width of 9.5 km) and covers a total surface of 99 km2, 65 of which are occupied by edaphic plant communities.


Figure 1. (a) Location of the study area in Mendoza Province, Argentina. (b) Climatic diagram, following Walter & Lieth (1960), of Las Aguaditas Meteorological Station, period 1972-1992. The diagram shows mean monthly rainfall (solid line), mean monthly temperature (dotted line), potential evapotranspiration (dashed line), the relative humid period (vertical striped surface), months with mean minimum temperature below 0°C (black bar), months with absolute minimum temperature below 0°C (diagonal striped bar), and frost-free months (white bar).
Figura 1. (a) Ubicación del área de estudio en la provincia de Mendoza, Argentina. (b) Diagrama climático, según Walter & Lieth (1960) de la Estación Meteorológica Las Aguaditas, período 1972-1992. El diagrama muestra la precipitación promedio mensual (línea continua), la temperatura promedio mensual (línea punteada), la evapotranspiración potencial (línea rayada), el período relativamente húmedo (rayado vertical), los meses con temperatura mínima promedio por debajo de los 0°C (barra negra), los meses con temperatura mínima absoluta por debajo de los 0°C (barra con rayado diagonal) y los meses libres de heladas (barra blanca).
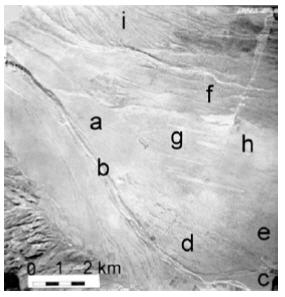
Figure 2. Aerial photograph of Las Tunas alluvial fan, Mendoza Province, showing old alluvial fan (a), low Holocene terraces (b), high Holocene terraces (c), young alluvial fan (d), old fan lower segment (e), border of old fan middle segment (f), center of old fan middle segment (g), and parabolic dunes (h). The active Chupasangral alluvial fan is partially shown (i).
Figura 2. Fotografía aérea del abanico aluvial del río Las Tunas, provincia de Mendoza, mostrando el abanico aluvial antiguo (a), terrazas holocénicas bajas (b), terrazas holocénicas altas (c), abanico aluvial joven (d), segmento bajo del abanico antiguo (e), borde del segmento medio del abanico antiguo (f), centro del segmento medio del abanico antiguo (g) y médanos parabólicos (h). El abanico del río Chupasangral (activo) se muestra parcialmente (i).
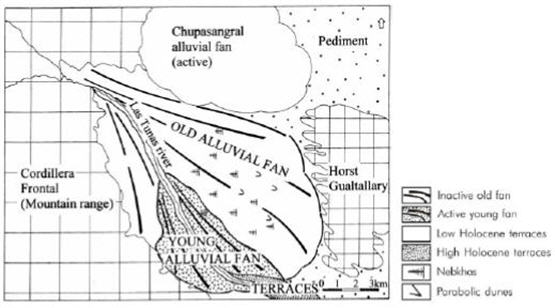
Figure 3. Geomorphological map of Las Tunas alluvial fan, Mendoza Province.
Figura 3. Mapa geomorfológico del abanico aluvial del río Las Tunas, provincia de Mendoza.
Climatic conditions
From a geological point of view, and as a consequence of the most important uplifts of the Cordillera Frontal during the Upper Pliocene, an arid climatic regime was established in the rain-shadow of the eastern piedmont (Polanski 1962, 1972). According to Thornthwaite's (1948) classification, the climate is semiarid and microthermal. The influence of the Atlantic anticyclone is dominant. Thus, the rainy season is spring-summer (72% of the 354 mm of annual precipitation), in agreement with the relatively wet period shown in the climatic diagram (Figure 1b). If potential evapotranspiration (Thornthwaite 1948) is considered, there is a water deficit of 211 mm/year. Only during the coldest month (July) rainfall reaches potential evapotranspiration. Frosts may occur all the yearlong except in January, the hottest month.
S and NW winds are prevalent, with annual speed averaging 9.8 km/h. Mean monthly maximum wind speed (39.3 km/h) is above the generally accepted threshold for fine sand entrainement: 20-25 km/h at 8-13 m of measurement heights (Gorchkov & Yakouchova 1967; Lancaster 1988; Shehata et al. 1992; Gaylord & Stetler 1994; Tengberg 1995). The strongest winds come from the WNW and NW (in accordance with orientation of nebkhas and parabolic dunes), and blow in winter. Availability of transportable sediments is probably increased by the year-round water deficit. Gupta et al. (1981) observed that eolian erosion was reduced when rain occurred in spite of the high wind velocity.
Soils
Soils suffer different temperature and moisture regimes over 1850 m.a.s.l. and below this altitude (Gaviola de Heras et al. 1992). The ustic moisture regime in the upper part allows the development of pedogenic horizons. Below 1850 m.a.s.l. the low soil moisture explains the presence of genetically immature soils; this, in particular, is the area analyzed in the present study. Thus, soils have been classified as Entisols, suborders Torripsamments and Torrifluvents. The proportion of each suborder and soil depth varies according to the position in the middle and lower segments of the fan (Gaviola de Heras et al. 1992).
METHODS
Photointerpretation
Vegetation and geomorphological units were delineated by interpretation of panchromatic aerial photographs at scale 1:50000 from the Instituto Geográfico Militar of Argentina (Figure 2).
Grain-size analysis of sediments
The technique applied to separate grain sizes was sieving, which is very frequently used for sands (2-0.0625 mm) and pebbles (4-2 mm) (Krumbein & Sloss 1969). The selection of sampling sites was mainly based on identified plant communities. Samples were collected at depths of 0.40 and 0.80 m; samples were also collected from the surface of parabolic dunes. Before sieving, samples were dried and rolled to pulverize the low number of aggregates. Samples were sieved manually during 5 min through each individual screen with hermetic cover. The size of sieves was selected according to Wentworth scale (Carver 1978) in which each succeeding grade is half as large as its predecessor (Krumbein 1936) (Table 1). The sieves at one phi (Φ) intervals from -1 to 4 were used (4-0.0625 mm). Particles bigger than 4 mm were neglected, and grains smaller than 0.0625 mm were kept and regarded as the last sieving class (silt and clay).
Table 1. Sieve numbers and grain-size considered in the analysis of sediments from Las Tunas alluvial fan, Mendoza Province. Pebble class was not considered; silt and clay class was considered only for histogram building.
Tabla 1. Tamices utilizados y tamaños de granos considerados en el análisis de los sedimentos del abanico aluvial del río Las Tunas, provincia de Mendoza. La primera clase no fue considerada; la última solo se consideró para la construcción de los histogramas.
The results of the grain-size analysis are graphically shown by histograms (mm scale) and cumulative curves, the latter drawn in phi (Φ) scale according to Inman (Krumbein & Sloss 1969). Descriptive statistics were derived from the cumulative curves by a graphical method. The grain-size statistical parameters (mean, standard deviation, skewness, and kurtosis) were obtained by applying formulas developed by Folk & Ward (1957), and class limits as well (Appendix). All these parameters are expressed in phi Wentworth exponent (Krumbein 1936) scale (Φ = -log2; diameter in mm).
Analysis of vegetation
Plant communities were physiognomically, floristically, and ecologically studied using the phytosociological method (Braun-Blanquet 1979). For each delineated vegetation unit (plant community) a minimum of five relevés (vegetation samples) were carried out at different sites. Relevés consist of a complete list of plants in a series of relatively small, environmentally uniform habitats where communities are considered homogeneous regarding dominant and subdominant species, vegetation structure, and ecological conditions. Abundance-dominance and sociability values are given for each species in the list.
All relevés were arranged and compared in the synthesis table (Table 2). This was done after constructing a preliminary table (abundance-dominance/sociability values) with data of each relevé organized according to prevailing geomorphological processes and their intensity. Once relevés were grouped into plant communities, presence was calculated. Presence is the number of times each species occurs in the relevé series of each community expressed as percentage, as follows: I (1-20%), II (21-40%), III (41-60%), IV (61-80%), and V (81-100%). For comparative purposes the k-means procedure was applied to cluster sites according to the Euclidean distance among species abundance values (plant cover values).
Table 2. Synthesis table of plant communities, geomorphological processes and average grain-size parameters of Las Tunas alluvial fan, Mendoza Province. Presence is the number of times each species occurs in each community expressed as percentage: I (1-20%), II (21-40%), III (41-60%), IV (61-80%), and V (81-100%). Indicator species: fluvial (F), eolian (E) and soil erosion (S) processes.
Tabla 2. Cuadro comparativo sintético de las comunidades vegetales, los procesos geomorfológicos y los parámetros granulométricos del abanico aluvial del río Las Tunas, provincia de Mendoza. La presencia es el número de veces que cada especie aparece en cada comunidad, expresada como porcentaje (ver códigos de presencia arriba). Especies indicadoras: procesos fluviales (F), eólicos (E) y de remoción de suelos (S).


The behavior of plant species was analyzed in the local context, according to observations made during the fieldwork. Also, a bibliographic analysis was carried out to check similar behaviors under similar environmental conditions (sensitivity analysis). Thus, indicator species of fluvial, eolian and soil erosion processes were identified (Table 2). Indicator species of soil erosion indicate soil disturbance by different agents such as water, wind, or human activity (e.g., grazing, roads, garbage). Each community was evaluated according to its indicator species, by both total cover (derived from abundance-dominance values) and Indicator Value Index. To make these indicator values comparative, they were referred to as a percentage and graphically shown. The Indicator Value Index was calculated using Dufrêne and Legendre's method (1997). This indicator index combines the species relative abundance with its relative frequency of occurrence in the various groups of sites. Here, it was applied for the mapped communities and not for the groups resulting from k-means clustering.
Relationships among plant communities, indicator species, geomorphological processes, and grain-size parameters were emphasized. Binomials were cited according to the Kewensis Index in the Synthesis table.
RESULTS
Grain-size parameters
Average statistical parameters are given in Table 2. Several grain-size distribution histograms from zones with fluvial and eolian activity are shown in Figures 4 and 5; cumulative curves are also included to compare fluvial and eolian processes. In both figures the associated plant community is given. All four grain-size parameters are plotted by pairs as scatter diagrams in order to understand their geological significance (Folk & Ward 1957) (Figure 6). "Sandy area" involves the sediments of the old fan middle and lower segments, except parabolic dunes. Variations for the grain-size parameters are discussed below.
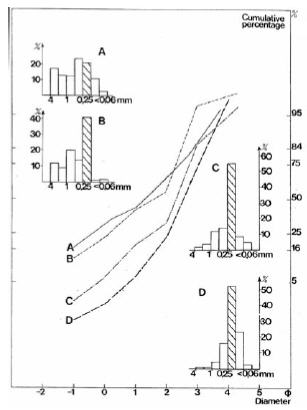
Figure 4. Example of histograms and cumulative curves of alluvial sediments of Las Tunas alluvial fan, Mendoza Province. (A) Low Holocene terraces with shrubland of Proustia cuneifolia and Eupatorium buniifolium with Adesmia trijuga. (B) High Holocene terraces with shrubland of Proustia cuneifolia and Eupatorium buniifolium with Digitaria californica. (C) Young alluvial fan with open shrubland of Proustia cuneifolia and Eupatorium buniifolium with Bothriochloa springfieldii. (D) Shown for comparative purposes are the eolian sediments of the center of the old fan middle segment with open shrubby steppe of Grindelia chiloensis and Ephedra ochreata with Panicum urvilleanum. The striped histogram column corresponds to fine sand class (0.25-0.125 mm).
Figura 4. Ejemplos de histogramas y curvas acumuladas de sedimentos aluviales del abanico aluvial del río Las Tunas, provincia de Mendoza. (A) Terrazas holocénicas bajas con matorral de Proustia cuneifolia y Eupatorium buniifolium con Adesmia trijuga. (B) Terrazas holocénicas altas con matorral de Proustia cuneifolia y Eupatorium buniifolium con Digitaria californica. (C) Abanico aluvial joven con matorral abierto de Proustia cuneifolia y Eupatorium buniifolium con Bothriochloa springfieldii. (D) Con fines comparativos, se muestran los sedimentos eólicos del centro del segmento medio del abanico antiguo con estepa arbustiva abierta de Grindelia chiloensis y Ephedra ochreata con Panicum urvilleanum. La columna rayada de los histogramas indica la clase arena fina (0.25-0.125 mm).

Figure 5. Example of histograms and cumulative curves of eolian sediments of Las Tunas alluvial fan, Mendoza Province. (A) Parabolic dune with open grass steppe of Panicum urvilleanum with Xanthium cavanillesii. (B) Center of the old fan middle segment with open shrubby steppe of Grindelia chiloensis and Ephedra ochreata with Panicum urvilleanum. (C) Border of the old fan middle segment with shrubland of Brachyclados lycioides and Neosparton aphyllum with Panicum urvilleanum. (D) Old fan lower segment with shrubland of Prosopis flexuosa var. depressa and Bougainvillea spinosa with Panicum urvilleanum. The striped histogram column corresponds to fine sand class (0.25-0.125 mm).
Figura 5. Ejemplos de histogramas y curvas acumuladas de sedimentos eólicos del abanico aluvial del río Las Tunas, provincia de Mendoza. (A) Médanos parabólicos con estepa herbácea abierta de Panicum urvilleanum con Xanthium cavanillesii. (B) Centro del segmento medio del abanico antiguo con estepa arbustiva abierta de Grindelia chiloensis y Ephedra ochreata con Panicum urvilleanum. (C) Borde del segmento medio del abanico antiguo con matorral de Brachyclados lycioides y Neosparton aphyllum con Panicum urvilleanum. (D) Segmento bajo del abanico antiguo con matorral de Prosopis flexuosa var. depressa y Bougainvillea spinosa con Panicum urvilleanum. La columna rayada de los histogramas indica la clase arena fina (0.25-0.125 mm).


Figure 6. Plots of grain-size statistical parameters for alluvial sediments (black triangles), sandy area (white rhombi) and parabolic dunes (black circles) in Las Tunas alluvial fan, Mendoza Province.
Figura 6. Diagramas de dispersión de los parámetros granulométricos de los sedimentos aluviales (triángulos negros), sector arenoso (rombos blancos) y médanos parabólicos (círculos negros) en el abanico aluvial del río Las Tunas, provincia de Mendoza.
Mean size.- It varies from 2.08-3.16 Φ (fine to very fine sands) for eolian sediments to 1.02-2.42 Φ (medium to fine sands) for alluvial sediments (Figure 6a, 6b and 6c). Histograms also show the different grain-size distributions (Figure 4 and 5). As soon as eolian selection starts there is an increase in the 0.25-0.125 mm fine sand fraction (Figure 4), except in the case of better sorted parabolic dunes where the medium fraction (0.5-0.25 mm) is also abundant (Figure 5A). For alluvial sediments, on the contrary, classes bigger than 0.25-0.125 mm are important.
Standard deviation.- A measure of sorting, it varies from 0.63-1.14 Φ (mainly moderately sorted to somewhat poorly sorted) for eolian sediments to 1.20-1.92 Φ (poorly sorted) for alluvial sediments (Figure 6a, 6d and 6e). Among eolian sediments, on average, parabolic dunes are better sorted (0.72 Φ) than the sandy area (0.89 Φ). Sorting is also clearly expressed by the steepness of cumulative curves (Figure 4 and 5).
Skewness.- It measures the symmetry of the distribution. It ranges from (-0.363)-(0.219) Φ (mainly coarse skewed to somewhat fine skewed) for eolian sediments to (-0.421)-(-0.228) Φ (strongly coarse to coarse skewed) for alluvial sediments (Figure 6b, 6d and 6f). Eolian sediments of the sandy area are negatively skewed (averaging -0.168 Φ); only parabolic dunes are, on average, slightly positive (0.039 Φ).
Kurtosis.- It measures the normality of the distribution. It varies from 0.8-1.36 Φ (platykurtic to leptokurtic) for eolian sediments to 0.90-1.96 Φ (platykurtic to very leptokurtic) for alluvial sediments (Figure 6c, 6e and 6f). As shown by these results eolian and alluvial sediments are not clearly distinguished by kurtosis. Nevertheless, kurtosis may differentiate leptokurtic sediments of the sandy area from meso- and platykurtic sands of parabolic dunes. According to Folk's (1965) criterium, only two samples of parabolic dunes belong to the platykurtic category, and thus, the tails are better sorted than the central portion. Sediments of the sandy area are clearly leptokurtic and better sorted in the central portion. Alluvial sediments present a variable behavior in this respect.
According to the parameters plotted by pairs eolian and alluvial sediments can almost always be distinguished (Figure 6a, 6b, 6c, 6d and 6e); when skewness and kurtosis are plotted together there is an overlapping of alluvial and eolian sediments, particularly in the sandy area (Figure 6f). Among eolian sediments, those from the sandy area differ from those from parabolic dunes in all pairs of parameters, except when skewness is plotted with standard deviation (Figure 6d).
Vegetation
Seven plant communities were determined; their geographical distribution is shown in Figure 7. The floristic and ecological characteristics are assembled in the synthesis comparative table (Table 2) where relevés were arranged according to the dominant geomorphological process: from more humid sample stands with fluvial processes in alluvial terraces to those enduring intense wind blowing in parabolic dunes. According to this arrangement, the average of all four grain-size parameters follows in general the mentioned pattern.
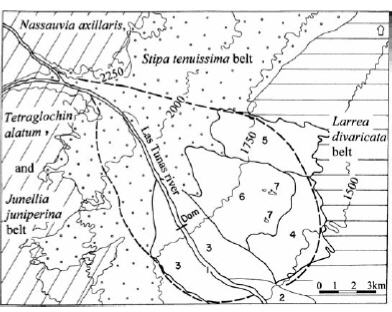
Figure 7. Map of vegetation belts and edaphic plant communities of Las Tunas alluvial fan, Mendoza Province. 1: Shrubland of Proustia cuneifolia and Eupatorium buniifolium with Adesmia trijuga on low Holocene terraces. 2: Shrubland of Proustia cuneifolia and Eupatorium buniifolium with Digitaria californica on high Holocene terraces. 3: Open shrubland of Proustia cuneifolia and Eupatorium buniifolium with Bothriochloa springfieldii on the young alluvial fan. 4: Shrubland of Prosopis flexuosa var. depressa and Bougainvillea spinosa with Panicum urvilleanum on the old fan lower segment. 5: Shrubland of Brachyclados lycioides and Neosparton aphyllum with Panicum urvilleanum bordering the old fan middle segment. 6: Open shrubby steppe of Grindelia chiloensis and Ephedra ochreata with Panicum urvilleanum on the center of the old fan middle segment. 7: Open grass steppe of Panicum urvilleanum with Xanthium cavanillesii on parabolic dunes.
Figura 7. Mapa de pisos de vegetación y comunidades edáficas del abanico aluvial del río Las Tunas, provincia de Mendoza. 1: Matorral de Proustia cuneifolia y Eupatorium buniifolium con Adesmia trijuga en terrazas holocénicas bajas. 2: Matorral de Proustia cuneifolia y Eupatorium buniifolium con Digitaria californica en terrazas holocénicas altas. 3: Matorral abierto de Proustia cuneifolia y Eupatorium buniifolium con Bothriochloa springfieldii en abanico aluvial joven. 4: Matorral de Prosopis flexuosa var. depressa y Bougainvillea spinosa con Panicum urvilleanum en segmento bajo del abanico antiguo. 5: Matorral de Brachyclados lycioides y Neosparton aphyllum con Panicum urvilleanum en borde del segmento medio del abanico antiguo. 6: Estepa arbustiva abierta de Grindelia chiloensis y Ephedra ochreata con Panicum urvilleanum en el centro del segmento medio del abanico antiguo. 7: Estepa herbácea abierta de Panicum urvilleanum con Xanthium cavanillesii en médanos parabólicos.
Plant communities, with mean cover varying from 27-70%, are formed by two or three layers (2.15-0.15 m high): the highest composed of shrubs (one or two layers), and the lowest composed of small shrubs, herbs, and grasses. The first layer is dominant, so the shrubland physiognomy prevails except for parabolic dunes where grasses and some therophytes are dominant despite their low cover (5-30%).
Within the seven communities, those on surfaces subjected to fluvial activity are distinguished from those on surfaces that undergo eolian processes (middle and lower segments of the old alluvial fan). Fluvial influence (moisture content and water aggradation-degradation) is denoted by the high canopy cover of the riparian species Proustia cuneifolia var. mendocina and Eupatorium buniifolium, common on Holocene terraces and on the young alluvial fan segment (Table 2, Figure 4 and 7: communities 1, 2 and 3). Psammophytes (Grindelia chiloensis, Aristida subulata, Poa lanuginosa, Glandularia parodii) are common to the vegetation on surfaces subject to eolian activity, among which the grass Panicum urvilleanum particularly reveals intensive ongoing eolian processes (Table 2, Figure 5 and 7: communities 4, 5, 6 and 7).
Results of k-means clustering of sites show an agreement with mapped communities except for the center of the old alluvial fan where only some sites are grouped in one cluster, while the others join the parabolic dunes cluster, resulting in irregularly split band and interband sites. This should be analyzed in depth since band and interband sites did not show significant differences at floristic, biomass and grain-size levels.
According to the sensitivity analysis made, some species of the groups that appeared to be characteristic of fluvial and eolian processes have also been found by different authors under similar ecological conditions. Indicator values of indicator species present in each plant community have been plotted, along with the average grain-size statistical parameters in order to understand their relationship (Figure 8).
Figure 8. Synthesis of average grain-size parameters and relative presence of indicator species for each plant community in Las Tunas alluvial fan, Mendoza Province. Grain-size parameters: mean size (black circles), standard deviation (black triangles), skewness (white circles), and kurtosis (black squares). Indicator species: fluvial processes (dark grey bars), eolian processes (light grey bars), and soil erosion (white bars). Indicator species calculated by vegetation cover (a, first columns) and by Indicator Value Index (b, second columns). Plant communities' numbers are the same as in Figure 7.
Figura 8. Síntesis de los parámetros granulométricos promedio y presencia relativa de las especies indicadoras para cada comunidad vegetal en el abanico aluvial del río Las Tunas, provincia de Mendoza. Parámetros granulométricos: diámetro promedio (círculos negros), desviación estándar (triángulos negros), asimetría (círculos blancos) y curtosis (cuadrados negros). Especies indicadoras: procesos hídricos (barras gris oscuro), procesos eólicos (barras gris claro) y de remoción de suelos (barras blancas). Valor indicador de las especies calculado con cobertura vegetal (a, primeras columnas) y con el Indice del Valor Indicador (b, segundas columnas). Los números de las comunidades vegetales son los mismos que en la Figura 7.
DISCUSSION
Sensitivity of grain-size parameters in relation to geomorphological processes
Results of Las Tunas fan grain-size parameters allow to distinguish contemporary surface modifications by wind from alluviation, although sometimes value ranges do not totally agree with other authors. These differences in values may be due to some differences in the methodological approach like time of sieving and sieving class limits. Moreover, the place where samples are taken from may be very important, as it may indicate how far it is from the sediment source, and therefore for how long it has been exposed to dominant processes.
According to Friedman (1961) many river sands can be distinguished from dune sands on account of their textural parameters, although a wide field of overlap exists. This author considers that overlapping is not necessarily a serious matter, since many desert and inland dune sands do not exceed a standard deviation of 0.50, whereas most river sands have a standard deviation higher than 0.50. However, these differences might be more clearly noticed in a regional context like the study area where eolian sediments are better sorted than alluvial ones, although they do not reach the traditional sorting range for eolian sands.
Mean grain-size.- It is strongly related to the original sediments and dominant processes. Eolian sands in different deserts range from fine- to very fine-grained (Mason & Folk 1958; Folk 1971; Wadhawan 1996) as the eolian sediments of Las Tunas. Although Friedman (1961) considers that the limit for dunes is medium sand, Newell & Boyd (1955) describe very coarse eolian sand for the Ica desert in Peru. Therefore, eolian sediments may have different mean grain-sizes. Regarding alluvial sediments, Friedman (1978) found that river sands vary from coarse to very fine-grained, while for Folk & Ward (1957) they range from granule to fine sand. Alluvial sediments of Las Tunas fan are medium to fine-grained sands. According to this, mean grain-size alone is not enough to reflect the mode of transportation.
Standard deviation.- Dune sands can commonly be distinguished from river sands by their sorting characteristics; dune sands tend to be better sorted than river sands (Friedman 1961). For Las Tunas fan this trend is accomplished, from moderately sorted eolian sands to poorly sorted alluvial deposits. Wolman (1978) reports that sorting coefficients for river sands often exceed 1.3, while Friedman (1978) found that σ1 = 1.40 Φ is approximately the upper limit for river sands and the interval 1.40-2.00 Φ would correspond to poorly sorted glaciofluvial sands. In the present study values of σ1 (1.20-1.92 Φ) are related to fluvial processes.
The textural variation in a fan could be more complex than merely the downfan sorting of fluvial-transported sediments; their poorly sorted sediments may reflect deposition by debris flows or the reworking of previously deposited sediments, both common phenomena during fan construction (Parker 1995). In this connection, Derbyshire et al. (1979) consider that desert dunes derived from poorly-sorted alluvial sediments are not so well sorted as coastal dunes composed of sand previously sorted by wave action. This could be one of the reasons why eolian sands studied herein are not better sorted. Moreover, alluvial sediments of Las Tunas fan were transported for a short distance after leaving the mountains before their deposition by water streams.
Skewness.- Dune sands are, for the most part, positively skewed (Mason & Folk 1958; Friedman 1961; Folk 1971; Wadhawan 1996), but they also show negative skewness (Friedman 1961; Schereiber 1978; Wadhawan 1996). Eolian sediments of Las Tunas fan are negatively skewed; only parabolic dunes present some slightly positively skewed fine sands. According to Friedman (1961) river sands are generally positively skewed, but coarse-grained river sand (coarse sand to gravel size) can be either positively or negatively skewed, and no predictable relationship could be determined. Skewness is therefore inconclusive as an indicator of depositional environment out of the range medium to fine and very fine sands. Sediments from Las Tunas alluvial fan are negatively skewed and medium to fine. From this it can be inferred that skewness may not be environment-sensitive if taken as a single parameter, but it is so, if considered together with the other three parameters (Friedman 1961).
Kurtosis.- Roaring sands and dunes (Folk 1971; van Rooyen & Verster 1983) are mesokurtic. Eolian deposits vary from extremely leptokurtic to mesokurtic-leptokurtic (Mason & Folk 1958; Wadhawan 1996). For Las Tunas eolian sediments kurtosis allows to distinguish between the sandy area (leptokurtic) and parabolic dunes (platykurtic). According to Mason & Folk (1958) it is possible to distinguish beach, dune and eolian flat environments, despite their uniformity in mean grain size, because differences occur almost entirely in curve tails, and therefore skewness and kurtosis are the most valuable parameters in identifying eolian environments. For Friedman (1961), instead, kurtosis does not contribute diagnostic information on depositional environments. For alluvial sands Folk & Ward (1957) found that platykurtic and leptokurtic samples occurred with nearly the same frequency. This agrees with the range of very leptokurtic to platykurtic sediments of Las Tunas. In plotting kurtosis against standard deviation or mean diameter, these alluvial sediments are distinguished from those of the eolian sandy area and of parabolic dunes.
According to Folk & Ward (1957) the more extreme the kurtosis values (high or low), the more extreme the sorting of the modes in their previous high-energy environment, and the less effective the sorting in the present environment. This seems not to be the case in Las Tunas river fan because neither eolian nor fluvial sediments reach extreme values, except for the sediments of the low Holocene terraces (very platykurtic).
It is important to remark that sieving classes selected for statistical analysis in this study (-1 to 4 Φ) could have affected numerical results despite having used the same formulas as Mason & Folk (1958) and Friedman (1961). If only grain sizes from 2-4.5 Φ were used (as did Mason & Folk 1958) results would change: σ1 values would be lower (0.44-1.06 Φ) and sorting would improve, mean size would necessarily be lower in mm and higher in Φ scale, skewness would tend to increase yielding mainly positive values, and finally kurtosis would have variable results. This could be the reason why eolian sediments are negatively skewed in contrast with mostly positive skewness found by different authors (Mason & Folk 1958; Friedman 1961; Folk 1971; Wadhawan 1996).
Plant sensitivity in relation to geomorphological processes
All the area presents processes of erosion, either by wind or water, or by a combination of both, as well as human processes like grazing. Species of wide ecological distribution reveal these soil disturbances, all of them are good indicator species, not only in the study area but also in diverse ecosystems of Mendoza.
Plant sensitivity on alluvial surfaces
Among the species common to these communities, the riparians Proustia cuneifolia var. mendocina and Eupatorium buniifolium show similar behavior in temporary rivers of Mendoza. Proustia cuneifolia var. mendocina is largely spread in the piedmont of the Precordillera (Roig 1976). Eupatorium buniifolium shows a more restricted distribution in the Precordillera because it is only found, together with Proustia cuneifolia var. mendocina, on the borders of ephemeral streams over 1200 m.a.s.l. (Roig 1976; Martínez Carretero 1985, 1993). Sporobolus cryptandrus was found to be an accompanying species on the terraces of the Mendoza river (Méndez 1987). Monnina dyctiocarpa belongs to the vegetation developed in rock fissures and on wet shady slopes of the Precordillera (Martínez Carretero 1985, 1993).
On the low Holocene terraces under intense fluvial activity due to frequent flooding, vegetation evidences both degradation and aggradation processes. There is no soil from an edaphic viewpoint, but just a miscellany with abundant granules and pebbles (Gaviola de Heras et al. 1992). The most characteristic species is Adesmia trijuga, also rooting in rock fissures with intense runoff in the Precordillera (Roig 1976; Martínez Carretero 1985, 1993) and on terraces of the alluvial plain of the perennial Mendoza river (Méndez 1987). Verbascum thapsus is a preferent species of the major river-bed of temporary rivers in the Precordillera (Martínez Carretero 1993) and its piedmont (Roig 1976). Tagetes mendocina shows linear runoff in the xeric Stipa tenuissima grasslands of Tupungato (González Loyarte 1989) and in sandstones of the Precordillera (Méndez 1992), while Amaranthus vulgatissimus shows soil disturbance in temporary rivers (Roig 1989) and near corrals.
The high Holocene terraces, less influenced by alluvial processes, present Typic Torrifluvents (90%) and a gravel miscellany (10%) (Gaviola de Heras et al. 1992). The indicator species signalling fluvial activity are Digitaria californica, also found in the riparian communities of the Precordillera (Roig 1976; Martínez Carretero 1993) and on terraces of the alluvial plain of the Mendoza river (Méndez 1987), and Hyalis argentea var. argentea found in rock fissures of the Precordillera (Roig 1976; Martínez Carretero 1993). Here, contemporary eolian influence also exists, as shown by the important cover, on sand accumulations, of Schinus fasciculatus, a burying-resistant shrub. Among the species common to terraces, Opuntia sulphurea and Stipa vaginata reveal soil disturbance.
The soils of the young alluvial fan, under medium fluvial activity, are classified as Ustic and Typic Torrifluvents, formed by layers of recent sediments, presenting different grain sizes; a typical profile shows a sequence of horizons Ap, C, II C, III C (Gaviola de Heras et al. 1992). Water degradation and aggradation in small ephemeral streams are shown by Bothriochloa sprinfieldii (as found in fissures by Martínez Carretero 1993). In the young alluvial fan there is also an incipient eolian influence. This oncoming influence is suggested by the cover of some psammophytes like Aristida subulata, Thelesperma megapotamicum, and by the presence of indicators of eolian activity like Grindelia chiloensis, Ephedra ochreata, and Poa lanuginosa.
Plant sensitivity on eolian surfaces
These soils always support the psammophyte Panicum urvilleanum, a rhizomatous grass of high plasticity that grows in the hot semidesert dune plain at 400-500 m.a.s.l. (northeastern and eastern Mendoza) as found by Roig (1971), Méndez et al. (1993), and González Loyarte et al. (unpubl. data). This plant species is also found in sandy plains with nebkhas at 1500 m.a.s.l. under cold and semidesert conditions in Malargüe, southern Mendoza (Ruiz Leal & Roig 1959). Thus, Panicum urvilleanum is an excellent indicator of eolian activity. The other common species, on surfaces subject to eolian processes (communities 4, 5, 6 and 7), are the psammophytes Poa lanuginosa, Grindelia chiloensis, and Aristida subulata. Glandularia parodii is a psammophyte of the Puna vegetation of Mendoza that clearly reveals soil disturbance by natural or human processes (Roig & Martínez Carretero 1998).
The lower segment of the old alluvial fan exhibits an in situ process of deflation and accumulation leading to a smooth wavy terrain where Baccharis darwinii is characteristic. This one is directly related to eolian erosion, as reported by De Marco et al. (1993) for the southern Andean piedmont. Lycium chilense var. minutifolium is a good indicator of eolian processes, as observed in the dunes of Potrerillos (Méndez 1992) and in sandy plains of Mendoza (Méndez et al. 1993; De Marco et al. 1993).
On the border of the old fan middle segment soils support two good indicators of soil erosion. Senecio subulatus is indicative both of water erosion, acting as a riparian, in piedmonts (Roig 1976) and mountains (Martínez Carretero 1993), and of wind erosion in dunes, alluvial fans, and alongside roads (Méndez 1987; Méndez et al. 1993). Erodium cicutarium is an exotic species associated with soil disturbance by grazing. Soils are sandy-loam with calcium carbonate content increasing with depth (Gaviola de Heras et al. 1992). The presence of the psammophyte Neosparton aphyllum suggests a deep humid layer (De Marco et al. 1993) probably favoured in this case by a calcareous layer.
The center of the old fan middle segment, with nebkhas, shows a clear dominance of eolian processes; runoff is low and concentrated in some small streams. The abundance of the grasses Panicum urvilleanum and Poa lanuginosa reveals the intensity of eolian processes; the dominant shrub is Grindelia chiloensis. Sand is fixed, forming nebkhas, by Ephedra ochreata, Schinus fasciculatus, and Grindelia chiloensis, as found by Ruiz Leal & Roig (1959) for a southern piedmont. Nebkhas present a high plant cover on the windward side (100%), and only 10-15% on the leeward side; the already mentioned species grow in nebkhas, but only Grindelia chiloensis, Poa lanuginosa, and Panicum urvilleanum survive the particle movement on the leeward side. The characteristic species Chenopodium ambrossioides shows soil disturbance by grazing. Portulaca grandiflora reveals eolian processes, as in the sandy plain of northeastern Mendoza and in the dunes of Potrerillos (Méndez 1992). Lycium tenuispinosum is a very good indicator of soil disturbance produced by overgrazing (Roig 1971), deforestation (Roig 1982), rodents (González Loyarte 1983), and accumulation of waste material (Martínez Carretero 1985).
In parabolic dunes the prevailing cover of Panicum urvilleanum shows the strong deflation and accumulation resisted by this rhizomatous grass. The other frequent species is the therophyte Xanthium cavanillesii that, owing to its easy fruit dissemination and fast seed germination, may prevent the constant hazard created by sand movement. These species, as well as Xanthium spinosum, are not exclusive of parabolic dunes; both are also found forming communities in very unstable zones in flood plains of the perennial Tunuyán river at 780 m.a.s.l. (Méndez 1991), and alongside roads where the soil is disturbed (De Marco et al. 1993). The therophyte Solanum euacanthum is also present in inland dunes in the semiarid plain of Mendoza (Roig 1971). The grass Poa lanuginosa also resists eolian erosion. Here we also find burying-resistant species like Grindelia chiloensis, Schinus fasciculatus, and the psammophyte Senecio filaginoides.
Grain-size, plant communities, indicator species and fluvial and eolian processes
Synthetically, Table 2 and Figure 8 express the relationship among grain-size, plant communities, indicator species and fluvial and eolian processes, which is the major contribution of this study. Usually grain-size analysis is made within a sedimentological scope but not in the framework of ecological studies. Contemporary surface modifications by fluvial and eolian processes produce distinctly different surface sediments that are reflected in the grain-size statistical parameters and in the vegetation pattern (at both community and indicator species levels).
Comparative results of the indicator value of species are better expressed by plant cover than by the Indicator Value Index (Figure 8). Plant cover provides a kind of "picture" of fluvial or eolian vegetation environments. In contrast, the Indicator Value Index may assign the maximum value (100) to plant species with very different cover, as long as they are present at all sites of the same community and absent from the other communities. This is the case of Adesmia trijuga and Amaranthus vulgatissimus, with 167.5 and 0.5 total cover respectively, both occurring in the riparian community of low terraces. In spite of this, Indicator Value Index is of great value to highlight species present at few or specific sites as in communities 2 and 4 where the index is higher than the cover for indicators of fluvial processes in the first case and of eolian processes in the second. For the other communities (1, 3, 5, 6 and 7) the presence of the same species in two or more communities reduces the index which underestimates the influence of fluvial or eolian processes.
In all environments there is a minimum of 20% of soil erosion indicators corresponding to species of wide ecological distribution. The more stable the environment the higher the total vegetation cover, as is the case in community 2 under fluvial processes, and in communities 4 and 5 under eolian processes. In these communities soil erosion indicator species present the higher percentage of total cover, from 82% on high terraces to 42% on the old fan border.
The clearest interactions are those involving mean diameter and sorting. Grain-size increases, in phi units, from fluvial dominant processes to eolian dominance up to the point where eolian processes become very intense and deflation removes the finest grains (very fine sand, silt, and clay) leaving bigger grains in situ, fine and medium sands. This is the case in the center of the old fan and in parabolic dunes, communities 6 and 7, where eolian indicators are maximal and the most abundant class of histograms is fine sand with 52.3% and 50.6%, respectively. In the communities subjected to lower eolian activity the most abundant class is very fine sand with 45.6% for community 4 and 43.6% for community 5. Sorting exhibits a decreasing trend from poorly sorted fluvial sediments to moderately sorted eolian sediments of parabolic dunes. Skewness and kurtosis show slight differences.
The interaction among ongoing processes, sediments and plant indicators is particularly interesting in riparian communities (1, 2 and 3). In low terraces (1), and in the young fan (2), fluvial processes are more intense, as revealed by a clear dominance of fluvial process indicators. In the first case, the flooding of a big permanent river is generating an important soil disturbance; in the second, soil disturbance is caused by the runoff of braided ephemeral streams. In the young fan the increase in eolian processes is revealed by a small increase in the corresponding indicator species and the abundance of fine sands. In the high terraces a combination of general erosion processes prevails. Regarding eolian processes, there is a reduction in shrub height and cover, along with an increase in eolian indicator species, improved sorting, and increased eolian activity.
The combination of grain-size parameters, geomorphological processes, plant communities, and indicator species yielded interesting results. The phytosociological analysis proved a very sensitive floristic-ecological method for identifying plant communities occurring in response to dynamic sedimentation processes. Indicators of fluvial and eolian processes were present in these communities in accordance with prevailing geomorphological processes and grain-size parameters. Other factors (e.g., ground water table, soil depth) are reflected by other indicator species present in the same community.
LISTA SÍMBOLOS ESPECIALES
Φ : letra griega mayúscula phi
ξ: letra griega minúscula xi
APPENDIX
The cumulative curve was built for each sample in order to obtain graphically, by interpolation, the Φ diameter for selected cumulative percentage (e.g., 16%, 50%, 84%) and thus estimate statistical parameters to characterize the sediments. The grain size statistical parameters (mean, mode, skewness and kurtosis) were obtained applying Masson & Folk (1958) criteria as shown below.
Mean size (Mz) was determined by:
![]()
Standard deviation (σ1) is a measure of sorting, founded by:
![]()
Skewness (SKi) measures the symmetry of the distribution by:
![]()
Kurtosis (KG) measures the normality of a distribution by comparing the sorting in the central part of the curve with the sorting in the tails by means of:
ACKNOWLEDGEMENTS
I thank F. A. Roig, F. Bercowski, E. Méndez, H. N. Le Houérou, E. Cerdeño, S. Gaviola and A. Therburg whose critical revision improved the manuscript. N. Horak for correcting the English text, M. C. Scoones and MAGRAF for line drawings, María Barton for literary advice. I thank several persons who helped me in different ways at the very beginning of this work: F. A. Roig, J. C. Perucca, E. Martínez Carretero, M. A. Mattar, G. Suvires, F. Bercowski, M. Menenti, K. Garleff, B. Fernández, and Marcos E. González, my father.
REFERENCES
BARRERA, RO. 1970. Bosquejo geomorfológico del valle de Tupungato. Boletín de Estudios Geográficos 17:145-168. [ Links ]
BAUDIÈRE, A; P SOMSON & L SERVE. 1985. Les groupements à Viola diversifolia (DC.) W. Beck.: composition floristique et relations avec la dynamique des formations superficielles. Colloques phytosociologiques, Végétation et Géomorphologie 13:767-781. [ Links ]
BRAUN-BLANQUET, J. 1979. Fitosociología. Bases para el estudio de las comunidades vegetales. Ed. Blume. Madrid. [ Links ]
CARVER, RE. 1978. Wentworth scale. Pp. 872-873 in: RW Fairbridge & J Bourgeois (eds). Encyclopedia of earth sciences VI. The encyclopedia of sedimentology. Dowden, Hutchinson & Ross. Stroudsburg. [ Links ]
DELPECH, R. 1985. Relations entre un type de modelé periglaciaire (réseaux de buttes gazonnées ou «thufurs» et les végétations d'altitude, incidences phytosociologiques. Colloques phytosociologiques, Végétation et Géomorphologie 13:221-230. [ Links ]
DE MARCO, G; FA ROIG & C WUILLOUD. 1993. Vegetación del piedemonte andino en el centro oeste de Mendoza (68°32'-69°22' de Long. W y 33°42'-34°40' de Lat. S). Multequina 2:201-242. [ Links ]
DERBYSHIRE, E; KJ GREGORY & JR HAILS. 1979. Geomorphological processes. Dawson Westview Press. Folkestone. [ Links ]
DOING, H. 1985. Relationships between vegetation and geomorphology of coastal sand dunes in the Netherlands. Colloques phytosociologiques, Végétation et Géomorphologie 13:411-429. [ Links ]
DUFRÊNE, M & P LEGENDRE. 1997. Species assemblages and indicator species: the need for a flexible asymmetrical approach. Ecological Monographs 67(39):345-366. [ Links ]
EHRLICH, R. 1983. Size analysis wears no clothes or have moments come and gone? J. Sediment. Petrol. 53:1. [ Links ]
FOLK, RL. 1965. Petrology of sedimentary rocks. Hemphill's. Austin. [ Links ]
FOLK, RL. 1971. Longitudinal dunes of the northwestern edge of the Simpson desert, Northern Territory, Australia. 1. Geomorphology and grain size relationships. Sedimentology 16:5-54. [ Links ]
FOLK, RL & WC WARD. 1957. Brazos River Bar: a study in the significance of grain size parameters. J. Sediment. Petrol. 27:3-26. [ Links ]
FRIEDMAN, GM. 1961. Distinction between dune, beach, and river sands from their textural characteristics. J. Sediment. Petrol. 31:514-529. [ Links ]
FRIEDMAN, GM. 1978. Grain-size parameters - Environmental interpretation. Pp. 374-376 in: RW Fairbridge & J Bourgeois (eds). Encyclopedia of earth sciences VI. The encyclopedia of sedimentology. Dowden, Hutchinson & Ross. Stroudsburg. [ Links ]
GAVIOLA DE HERAS, S; FS OLMOS & L NIJENSHON. 1992. Reconocimiento de suelos de un sector del piedemonte andino de Tupungato (Alto Valle Río de Las Tunas), Mendoza. Informe Científico y Técnico Nº 41, Instituto de Suelos y Riego, Universidad Nacional de Cuyo. Chacras de Coria. [ Links ]
GAYLORD, DR & LD STETLER. 1994. Aeolian-climatic thresholds and sand dunes at the Hanford Site, south-central Washington, U.S.A. J. Arid Environ. 28:95-116. [ Links ]
GONZÁLEZ LOYARTE, MM. 1983. Estudios sobre la erosión en la Formación El Zampal. Serie Científica 29:13-15. [ Links ]
GONZÁLEZ LOYARTE, MM. 1985. La végétation et la géomorphologie dans le piémont andin de Tupungato, Mendoza (Argentine). Colloques phytosociologiques, Végétation et Géomorphologie 13:847-856. [ Links ]
GONZÁLEZ LOYARTE, MM. 1989. Los pastizales de piedemonte: los coironales preandinos de Tupungato, Mendoza, Argentina. Pp. 242-253 in: FA Roig (ed). Detección y control de la desertificación. UNEP – CONICET/CRICYT/IADIZA. Mendoza. [ Links ]
GONZÁLEZ LOYARTE, MM. 1991. Hipótesis sobre los paleocauces que disectaron el horst de Gualtallary en el piedemonte de la Cordillera Frontal (Tupungato, Mendoza, Argentina). Bamberg Geographische Schriften Bd. 11:35-43. [ Links ]
GORCHKOV, G & A YAKOUCHOVA. 1967. Géologie générale. Ed. Mir. Moscú [ Links ].
GUPTA, JP; RK AGGARWAL & NP RAIKHY. 1981. Soil erosion by wind from bare sandy plains in western Rajasthan, India. J. Arid Environ. 4:15-20. [ Links ]
KRUMBEIN, WC. 1936. Application of logarithmic moments to size frequency distributions of sediments. J. Sediment. Petrol. 6:35-47. [ Links ]
KRUMBEIN, WC & LL SLOSS. 1969. Estratigrafía y sedimentación. UTHEA. México D.F. [ Links ]
LANCASTER, N. 1988. On desert sand seas. Episodes 11:12-17. [ Links ]
LE HOUÉROU, HN. 1969. La végétation de la Tunisie steppique. Annales de l'Institut National de la Recherche Agronomique de Tunisie 42:1-645. [ Links ]
MARTÍNEZ CARRETERO, E. 1985. La vegetación de la Reserva Natural Divisadero Largo (Mendoza, Argentina). Documents Phytosociologiques, N.S. 9:25-45. [ Links ]
MARTÍNEZ CARRETERO, E. 1993. Carta de vegetación del sector Cerro Casa de Piedra-San Isidro (Hoja Mendoza 230-21). Multequina 2:89-140. [ Links ]
MASON, CC & RL FOLK. 1958. Differentiation of beach, dune, and aeolian flat environments by size analysis, Mustang Island, Texas. J. Sediment. Petrol. 28:211-226. [ Links ]
MÉNDEZ, E. 1987. La vegetación de las terrazas y embanques del río Mendoza y su dinamismo. Parodiana 5:101-119. [ Links ]
MÉNDEZ, E. 1991. La vegetación de los embanques aluvionales en las nacientes del embalse El Carrizal, Provincia de Mendoza y sus dinamismos. II. Las inundaciones periódicas en la modificación de la vegetación. Parodiana 6:289-302. [ Links ]
MÉNDEZ, E. 1992. Conservación de nuestros ecosistemas naturales. I. Los médanos de Potrerillos, Luján de Cuyo, Mendoza. Multequina 1:19-23. [ Links ]
MÉNDEZ, E; E MARTÍNEZ CARRETERO & C WUILLOUD. 1993. La vegetación de las reservas naturales de la provincia de Mendoza. III. La vegetación del campo experimental El Divisadero, Sta. Rosa. Parodiana 8:113-123. [ Links ]
NEWELL, ND & DW BOYD. 1955. Extraordinarily coarse sand of the Ica Desert, Perú. J. Sediment. Petrol. 25:226-228. [ Links ]
PARKER, KC. 1995. Effects of complex geomorphic history on soil and vegetation patterns on arid alluvial fans. J. Arid Environ. 30:19-38. [ Links ]
PAUTOU, G; J GIREL & L MAMAN. 1985. Le rôle des processus allogéniques dans le déroulement des sucessions végétales: l'exemple de la plaine alluviale du Rhône entre Genève et Lyon. Colloques phytosociologiques, Végétation et Géomorphologie 13:655-668. [ Links ]
PETIT, F & R SCHUMACKER. 1985. L'utilisation des plantes aquatiques comme indicateur du type d'activité géomorphologique d'une rivière ardennaise (Belgique). Colloques phytosociologiques, Végétation et Géomorphologie 13:691-710. [ Links ]
POLANSKI, J. 1962. Estratigrafía, neotectónica y geomorfología del Pleistoceno pedemontano entre los ríos Diamante y Mendoza. Revista de la Asociación Geológica Argentina 17:127-348. [ Links ]
POLANSKI, J. 1972. Descripción geológica de la Hoja 24 a-b, Cerro Tupungato. Boletín Nº 128, Dirección Nacional de Geología y Minería. Buenos Aires. [ Links ]
REGAIRAZ, MC. 1994. Weathering and soil morphologies on the outermost moraines in the Arroyo de las Casas, Cordillera Frontal, Mendoza, Argentina. Quaternary of South America and Antarctic Peninsula 10:71-92. [ Links ]
ROIG, FA. 1971. Aportes al inventario de los recursos naturales de la provincia de Mendoza. 1. La Reserva Forestal de Ñacuñán. Deserta 1:1-239. [ Links ]
ROIG, FA. 1976. Las comunidades vegetales del piedemonte de la Precordillera de Mendoza. Ecosur 3:1-45. [ Links ]
ROIG, FA. 1982. La conservación de la vegetación natural en Cuyo. Nota IV. Serie Científica 26:12-19. [ Links ]
ROIG, FA. 1989. Ensayo de detección y control de la desertificación en el W de la ciudad de Mendoza, desde el punto de vista de la vegetación. Pp. 196-232 in: FA Roig (ed). Detección y control de la desertificación. UNEP – CONICET/CRICYT/IADIZA. Mendoza. [ Links ]
ROIG, FA & E MARTÍNEZ CARRETERO. 1998. La vegetación puneña en la provincia de Mendoza, Argentina. Phytocoenologia 28:565-608. [ Links ]
VAN ROOYEN, TH & E VERSTER. 1983. Granulometric properties of the roaring sands in the south-eastern Kalahari. J. Arid Environ. 6:215-222. [ Links ]
RUIZ LEAL, A & FA ROIG. 1959. Erial de vegetación en montículos. Boletín de Estudios Geográficos 6:161-209. [ Links ]
SCHEREIBER, BC. 1978. Skewness. P. 750 en: RW Fairbridge & J Bourgeois (eds). Encyclopedia of earth sciences VI. The encyclopedia of sedimentology. Dowden, Hutchinson & Ross. Stroudsburg. [ Links ]
SHEHATA, W; T BADER; O IRTEM; A ALI; M ABDALLAH & S AFTAB. 1992. Rate and mode of Barchan Dunes advance in the central part of the Jafurah sand sea. J. Arid Environ. 23:1-17. [ Links ]
TENGBERG, A. 1995. Nebkha dunes as indicators of wind erosion and land degradation in the Sahel zone of Burkina Faso. J. Arid Environ. 30:265-282. [ Links ]
THOMAS, DSG. 1992. Desert dune activity: concepts and significance. J. Arid Environ. 22:31-38. [ Links ]
THORNTHWAITE, CW. 1948. An approach toward a rational classification of climate. Geogr. Rev. 38:55-94. [ Links ]
WADHAWAN, SK. 1996. Textural attributes of recent eolian deposits in different sub-basins of the Thar Desert, India. J. Arid Environ. 32:59-74. [ Links ]
WALTER, H & H LIETH. 1960. Klimadiagramm-Weltatlas. VEB Gustav Fisher Verlag. Jena. [ Links ]
WOLMAN, MG. 1978. Alluvium. Pp. 11-13 in: RW Fairbridge & J Bourgeois (eds). Encyclopedia of earth sciences VI. The encyclopedia of sedimentology. Dowden, Hutchinson & Ross. Stroudsburg. [ Links ]

