


Servicios Personalizados
Revista

Articulo
 Articulo en XML
 Referencias del artículo
 Enviar articulo por email
Indicadores
-
 Citado por SciELO
Links relacionados
-
 Similares en
SciELO
Similares en
SciELO  uBio
uBio
Compartir

 Permalink
Ecología austral
versión On-line ISSN 1667-782X
Ecol. austral vol.26 no.1 Córdoba abr. 2016
ARTÍCULO ORIGINAL
Spatial and temporal trends in the distribution of macronutrients in surface waters of the Drake Passage
Flavio E. Paparazzo1*; Viviana A. Alder2,3,4; Irene R. Schloss2,4,5; Alejandro Bianchi6,7 & Jose L. Esteves1
1 Centro National Patagónico, CENPAT-CONICET. Puerto Madryn, Chubut, Argentina.
2 Instituto Antártico Argentino. Ciudad Autónoma de Buenos Aires, Argentina.
3 Departamento de Ecología, Genética y Evolución, IEGEBA-CONICET. Facultad de Ciencias Exactas y Naturales (UBA). Ciudad Autónoma de Buenos Aires, Argentina.
4 Consejo Nacional de Investigaciones Científicas y Técnicas, CONICET. Ciudad Autónoma de Buenos Aires, Argentina.
5 Institut des sciences de la mer de Rimouski, ISMER. Université du Québec à Rimouski. Rimouski, Québec, Canada.
6 Departamento Oceanografía. Servicio de Hidrografía Naval. Ciudad Autónoma de Buenos Aires, Argentina. ''Departamento de Ciencias de la Atmósfera y los Océanos, Facultad de Ciencias Exactas y Naturales (UBA). Ciudad Autónoma de Buenos Aires, Argentina.
*paparazzo@cenpat-conicet.gob.ar
Editor asociado: Esteban Jobbágy
Recibido: 24 de agosto de 2015 Aceptado: 10 de diciembre de 2015
Abstract
The Drake Passage (DP) links the Southern Pacific and Atlantic Oceans, and acts as a physical narrowing for the largest current of the World Ocean, the Antarctic Circumpolar Current (ACC). This result in a constriction of the main circumpolar fronts related to the ACC: the Subantarctic Front, the Polar Front, the Southern Antarctic Circumpolar Current Front and the Continental Water Boundary Front. Previous studies showed that the DP is a high-nutrient low-chlorophyll (HNLC) region, but studies on the interannual and seasonal macronutrients' fluctuations in relation with chlorophyll and frontal areas in the DP are scarce. This study analyzes the spatial and temporal trends of nitrate, phosphate, and silicate on surface samples from 113 oceanographic stations in the DP during summer and early fall of 2001 to 2004, in relation with the different fronts and chlorophyll-a concentration. The results revealed an increase of nutrients towards the south. Nitrate showed values from 3 µM at 55° S to 27 µM at 63° S, whereas values from 0.3 µM at 55° S to 2.6 µM at 63° S were observed for phosphate. Silicate increased considerably south of Polar Front, from 0 µM at 55° S to 74 µM at 62° S. The nutrients concentration was significantly higher in summer than in early fall and showed a trend to decrease over the studied years. A complex sum of biogeochemical processes would generate the main seasonal trends, while atmospheric-oceanic processes such as Southern Annular Mode and El Niño Southern Oscillation, would be responsible of observed nutrients interannual variability.
Keywords: Nitrate; Phosphate; Silicate; Chlorophyll-a; Temperature; Salinity; Antarctic fronts; Antarctic zones; Seasonal variation; Interannual variation
Resumen
Tendencias espaciales y temporales en la distribución de macronutrientes en aguas superficiales del Pasaje Drake. El Pasaje de Drake (DP) une los océanos Pacífico y Atlántico Sur, y actúa como un estrechamiento físico de la mayor corriente del Océano Mundial, la corriente circumpolar antártica (ACC). Esto crea una constricción entre los principales frentes circumpolares: el Frente Subantártico, el Frente Polar, el Frente Sur de la Corriente Circumpolar Antártica y el Frente del Límite de Aguas Continentales. Estudios previos mostraron que el PD es una región de nutrientes altos y clorofila baja (HNLC en inglés), pero los estudios centrados en las fluctuaciones interanuales y estacionales de macronutrientes en relación con la clorofila y las áreas frontales son escasos. Este estudio analiza las tendencias espaciales y temporales de la concentración de nitrato, fosfato y silicato en relación con los diferentes frentes y la concentración de clorofila-a, derivadas del análisis de muestras colectadas en 113 estaciones oceanográficas realizadas en aguas superficiales del PD durante el verano y principios del otoño de 2001 a 2004. Los resultados revelaron un incremento de los nutrientes hacia el sur. El nitrato mostró valores de 3 |aM a los 55° S a 27 |aM a los 63° S, mientras que para el fosfato se observaron valores de 0.3 |aM a 55° S hasta 2.6 |aM a los 63° S. El silicato aumentó considerablemente al sur del Frente Polar, desde 0 |aM a los 55° S hasta 74 |aM a los 62° S. La concentración de nutrientes fue significativamente mayor en verano que en otoño y mostró una tendencia a disminuir en los años estudiados. Una suma compleja de procesos biogeoquímicos generaría las principales tendencias estacionales, mientras que procesos atmosféricos-oceánicos como el Modo Anular del Sur y El Niño Oscilación Sur, serían responsables de la variabilidad interanual observada en los nutrientes.
Palabras clave: Nitrato; Fosfato; Silicato; Clorofila-a; Temperatura; Salinidad, Frentes antárticos; Zonas antárticas; Variación estacional; Variación interanual
Introduction
Deep ocean waters at high latitudes are the main reservoir of marine nutrients. In deep waters, nutrient concentration in lithogenic and biogenic sediments is high, while biological consumption is low (Levitus et al. 1993). When these nutrients get dissolved, upwelling, advection and convection processes transport them to the surface, from where currents distribute them to the tropics. Inorganic nutrient concentration decreases toward the Equator (Sanders & Jickells 2000) and is limited by the carrying capacity of the ocean currents and the rates of consumption by primary producers.
The Antarctic Circumpolar Current (ACC) surrounds the Antarctic continent in a continuous, uninterrupted flow (Barker et al. 2007). Its southern sector contains high concentrations of nutrients (García et al. 2010). When the ACC reaches the Drake Passage (DP), the narrowing produced by Antarctica and the southern tip of South America causes an increase in flow velocity (Guerrero et al. 1999) and the consequent strengthening of the main circumpolar ocean fronts (Sprintall 2003). These fronts, from south to north, are: 1) the Continental Water Boundary Front (CWBF), which is the northern limit of a cold water mass near the South Shetland Islands (Peterson & Stramma 1991; Orsi et al. 1995); 2) the Southern Antarctic Circumpolar Current Front (SACCF), which roughly extends along the Antarctic slope and deviates slightly to the north at 56° W (Orsi et al. 1995); 3) the Polar Front (PF), formed by the convergence of Antarctic and Subantarctic waters (Deacon 1984; Orsi et al. 1995; Moore et al. 1999; Artamonov et al. 2004), where strong chemical gradients are evident (e.g., concentration of silicate [Kuramoto & Koyama 1982; Watanabe 1982; DeMaster 2001]), and which acts as a major global biogeographic barrier, at least for the vast majority of planktonic organisms (Alder & Thompson 2000; Boltovskoy et al. 2005; Santoferrara & Alder 2009; Olguin & Alder 2011), and 4) the Subantarctic Front (SAF) (Orsi et al. 1995; Klinck & Nowlin 2001) defining the northern boundary of the ACC. These fronts and the areas between them have been well characterized based on their physical properties (Whitworth 1980; Tréguer & Jacques 1992; Orsi et al. 1995; Whitehouse et al. 2000; Barker et al. 2007; Zhang & Klinck 2008).
Numerous publications show nutrient concentrations in the DP and adjacent areas (e.g., Holm-Hansen et al. 1997; Brandini et al. 2000; Kim et al. 2004; Hendry et al. 2008; Lara et al. 2010; Munro et al. 2015). However, until now no study has addressed the issue in a broad spatio-temporal scale and in a multidisciplinary way. The goal of this study is to identify the spatial and temporal trends in the nitrate, phosphate and silicate distribution in surface waters of the DP during summer and early fall, from 2001 to 2004, in conjunction with variations in temperature, salinity and chlorophyll-a.
Materials and Methods
Water samples were collected from 113 oceanographic stations during the cruises of the icebreaker "Almirante Irízar" in the DP during summer and early fall of 2001 to 2004 (Figure 1). Discrete samples for the analysis of nutrients and chlorophyll-a were collected every 3 h. Seawater was obtained from a pumping system placed at 9 m depth. This system was, in turn, connected to a thermosalinometer (Sea Bird Electronics 37SI) that measured salinity and temperature continuously.
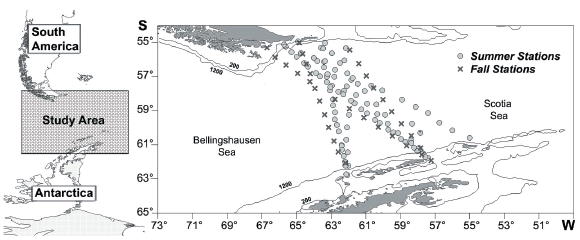
Figure 1. Stations sampled during the ARGAU campaigns (summer-early fall 2001-2004) on board of the icebreaker "Almirante Irízar". Circles: summer stations; crosses: early fall stations. For further details on months and years, see Figure 2.
Figura 1. Estaciones de muestreo realizadas durante las campañas ARGAU (verano-principios del otoño 2001-2004), a bordo del rompehielos "Almirante Irízar". Círculos: estaciones de verano; cruces: estaciones de principios del otoño. Para más detalles sobre el mes y el año, ver Figura 2.
For nutrient analyses, seawater from each station was filtered through Whatman GF/F filters and stored in 250 ml polyethylene bottles previously washed with neutral detergent, 5% HCl, and rinsed with distilled water. Samples were kept at -20 °C until analysis, which was done immediately after each cruise at the Centro Nacional Patagónico, Chubut, Argentina. Nitrate, nitrite and phosphate were measured according to Strickland & Parsons (1972), with modifications for the analysis with the Technicon II autoanalyzer. As nitrite concentrations were very low and the nitrate technique measures nitrate + nitrite, the concentration of nitrite + nitrate is expressed as nitrate. Silicate measurements were made following the method proposed by Technicon (1977). Chlorophyll-a concentrations were determined on the same water source used for nutrients, by filtering 2 L of seawater onto Whatman GF/F filters. These filters were stored in the dark at -20 °C and analyzed within the following 3 months at the Instituto Antártico Argentino, Buenos Aires, Argentina. After adding 8 mL of 90% acetone and maintained in a refrigerated and dark place for 24 h, the extracts were read in a Beckman DU 650 spectrophotometer. Pigment concentrations were calculated according to Strickland & Parsons (1972).
Cluster Analysis on a Bray-Curtis similarity matrix with unpaired group mean average amalgamation was used to explore similarities in physical, chemical and biological conditions (temperature, salinity, nitrate, phosphate, silicate and chlorophyll-a) within the DP. Data were previously normalized.
The analysis of temporal fluctuations in nutrient concentrations was based on the selection of transects as illustrated in Figure 2. The degree of statistical significance of the spatial and temporal fluctuations was estimated by applying a one-way ANOVA test. In all cases, normality and homogeneity of variances were tested previously. Whenever needed, subsequent comparisons of unequal samples were made by using a Tukey test.
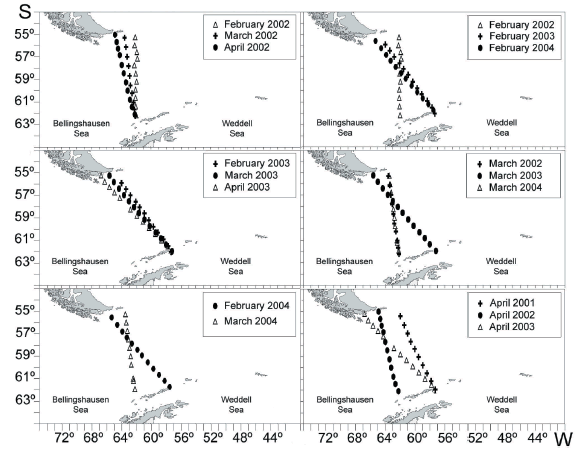
Figure 2. Selection of transects to test differences between months (left column) and between years (right column).
Figura 2. Selección de transectas para poner a prueba las diferencias entre meses (columna izquierda) y entre años (columna derecha).
Results
The location of fronts was revealed by pronounced surface thermal gradients (up to 0.055 °C/km) (Figure 3). From North to South, the strongest thermal gradients detected correspond to the SAF (at ~56° S), the PF (between 58 and 59° S), the SCCF (at ~60.5° S), and the CBW (at ~61° S), with the PF showing the largest spatial variability.
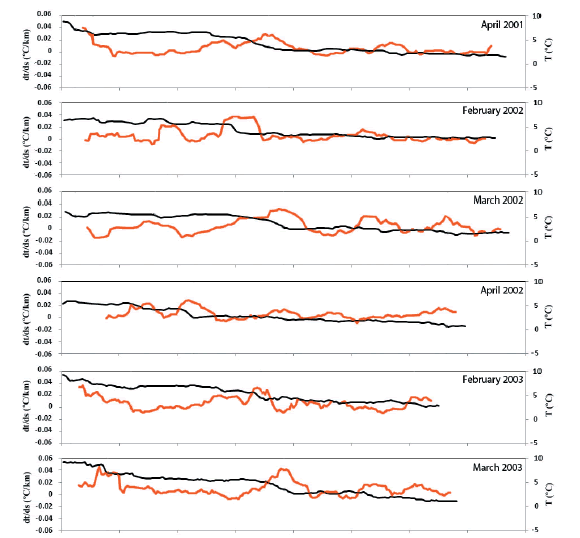
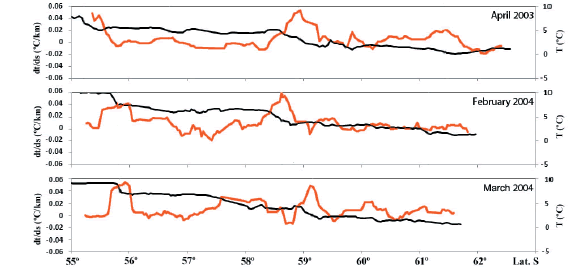
Figure 3. Latitudinal distribution of temperature (black) and thermal gradient (red) in surface waters of the Drake Passage.
Figura 3. Distribución latitudinal de temperatura (negro) y gradiente térmico (rojo) en las aguas superficiales del Pasaje Drake
High temperatures (>6 °C) and low salinities (<33.9) detected in surface waters north of the PF correspond to Subantarctic waters (Figure 4). The zone of transition from Subantarctic to Antarctic temperatures (4-5 °C range) was found to cover a larger area in early fall as compared to summer, while salinity was in the range of 33.8-33.9 with similar areas in both seasons. Next to the Antarctic continent, the temperature dropped (<2 °C), while differing salinity values were found between summer (>33.8) and early fall (<33.6).
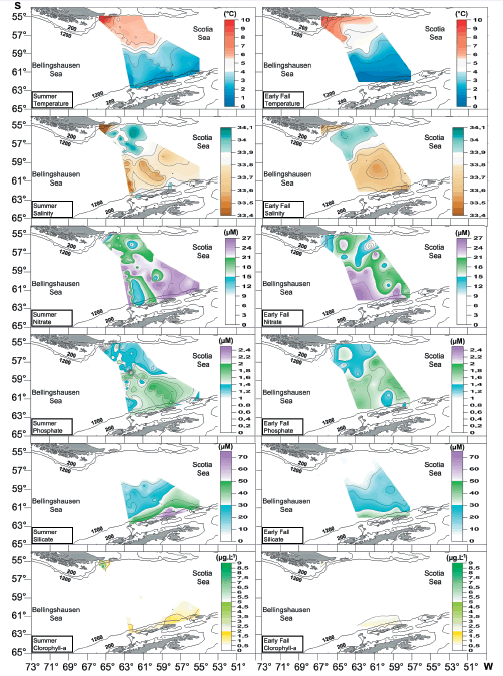
Figure 4. Temperature, salinity, macronutrients and chlorophyll-a distribution in surface waters of the Drake Passage. Left column: summer; right column: early fall.
Figura 4. Distribución de temperatura, salinidad, macronutrientes y clorofila-a en aguas superficiales del Pasaje Drake. Columna izquierda: verano; columna derecha: principios del otoño
North of the PF, nutrient concentration was lower in both summer and early fall (Figure 4). In summer, nitrate was <10 µM near the South American Shelf (SAS), in the 18-21 µM range north of the PF, and 27 µM south of the PF. A similar feature was evident in phosphate concentration, presenting lower values near the SAS (<1 µM), intermediate values north of the PF (1.1 µM to 1.4 µM), and higher concentrations south of the PF (1.5 µM to 2.0 µM). Silicate concentration was <8 µM north of the PF, but the values changed dramatically south of the PF, increasing from 10 µM to 75 µM. In early fall, nitrate concentration near the SAS was somewhat higher than in summer, and the values of nitrate north of the PF were lower than those measured in summer. A similar trend was observed south of the PF. Phosphate and silicate showed analogous characteristics as in summer but with somewhat lower values.
As mentioned above, the analysis of temporal fluctuations in nutrient concentration was based on the selection of transects as illustrated in Figure 2. The seasonal variation was tested in transects performed in the same year. Nutrient concentrations differed significantly between summer and early fall. In all cases, no significant variations were detected between February and March. In 2002, nitrate concentration in February was significantly higher than in April (P<0.05), while March concentrations were in the intermediate range. In 2003, phosphate concentrations were significantly higher in March than in April (P<0.05), while February concentrations presented intermediate values. In 2004, no significant variations were detected between months.
The interannual variation was tested in transects performed during the same month. In February and March, phosphate concentration was significantly higher in 2003 than in 2004 (P<0.05). In March also, significantly higher concentrations of nitrate were observed in 2002 than in 2004 (P<0.05). During April, however, there were no differences between years.
Chlorophyll-a concentration in summer was <0.5 µg/L throughout the DP (Figure 4). Only a few stations, near the continental shelves, showed higher values. In the case of South America, it reached 8.5 µg/L. Chlorophyll-a distribution in early fall was similar to that of summer; the few stations with slightly higher values never exceeded 1.0 µg/L.
The result of a cluster analysis based on nutrients, chlorophyll-a, temperature and salinity for summer and early fall is summarized in Figure 5. The geographical representation of clusters allows defining four groups of stations for each period and the overlapping of the clusters derived from summer and early fall: from North to South, the South American Coastal Zone (SACZ), the Polar Front Zone (PFZ), the Permanent Open Ocean Zone (POOZ), and the Seasonal Ice Zone (SIZ). The main features of each zone for summer and fall are presented in Table 1.
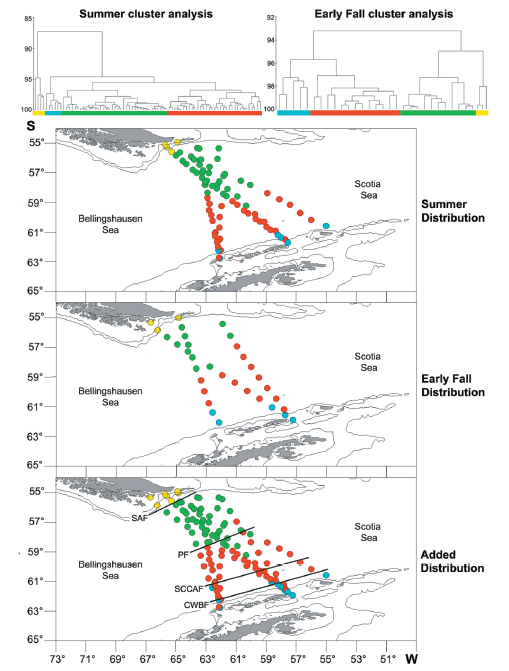
Figure 5. Cluster Analysis for summer and early fall, their corresponding geographical representation, and both plots shown simultaneously. Four zones are differentiated. Yellow: SACZ (South American Continental Zone); green: PFZ (Polar Front Zone); red: POOZ (Permanent Open Ocean Zone), and sky blue: SIZ (Seasonal Ice Zone). Straight lines show the mean position of fronts: SAF (Subantarctic Front); PF (Polar Front); SACCF (Southern Antarctic Circumpolar Current Front) y CWBF (Continental Water Boundary Front).
Figura 5. Análisis de agrupamiento para verano y principios de otoño, su representación geográfica correspondiente, y ambas imágenes simultáneamente. Se diferencian cuatro zonas. Amarillo: SACZ (Zona Continental Sudamericana); verde: PFZ (Zona del Frente Polar); rojo: POOZ (Zona Oceánica Permanentemente Abierta), y celeste: SIZ (Zona de Hielos Estacionales). Las líneas rectas muestran la posición media de los frentes: SAF (Frente Subantártico); PF (Frente Polar); SACCF (Frente Sur de la Corriente Circumpolar Antártica) y CWBF (Frente del Límite de las Aguas Continentales).
Table 1. General features of the areas yielded by the cluster analysis. SACZ: South American Coastal Zone, PFZ: Polar Front Zone, POOZ: Permanent Open Ocean Zone and SIZ: Seasonal Ice Zone.
Tabla 1. Características generales de cada una de las áreas obtenidas por el análisis de clúster. SACZ: Zona Continental Sudamericana, PFZ: zona del Frente Polar, POOZ: Zona Oceánica Permanentemente Abierta y SIZ: Zona de Hielos Estacionales.
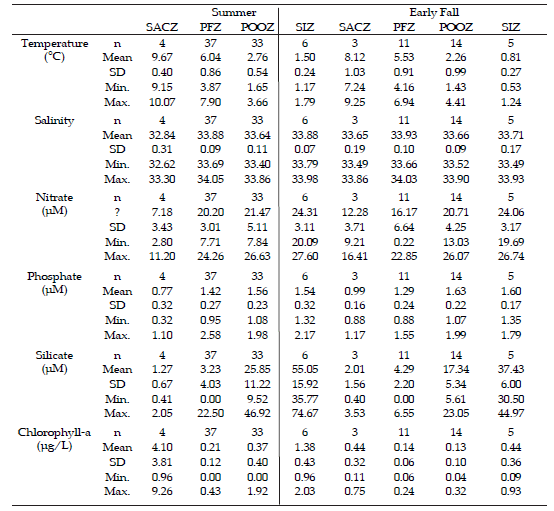
Significant differences were evident in temperature and salinity data (P<0.05) between all analyzed zones, with the exception of salinity in the SIZ and the POOZ during fall, where no differences were observed. Similarly, chlorophyll-a showed significant differences (P<0.05) in all tested areas, with one exception in fall between POOZ and PFZ.
Macronutrients behaved differently in each case. In summer, nitrate, phosphate and silicate showed signifcant differences (P<0.05) between SACZ and PFZ, but not in fall. Similarly, nutrients always showed signifcant diferences (P<0.05) between POOZ and PFZ, with one exception in summer, when nitrate showed no diferences. Finally, in the comparison between POOZ and SIZ, only silicate showed signifcant diferences (P<0.05).
Discussion
Our results show a wide variation in nutrient concentration for the PF, with significantly higher values south of it. Seasonal variability in the location of the PF was observed through thermal gradients (Figure 2), reaching more than 100 km southward in March with respect to February. However, its position in April was similar to that of March, and that is why differences are not observed in Figure 3. According to Sprintall (2003), there is a slight trend for the PF to being farthest south in austral summer, and farthest north in austral spring. We expected a low seasonal variability in the position of the PF jointly with intense features (increased width and temperature change across the front) due to the bathymetry of the DP. Spatial displacements have been observed more frequently during summer and fall (Moore et al. 1999). Moreover, due to variation in tracks across the PF in the DP, it is difficult to partition temporal from spatial variability in their location. Despite of that spatial changes among years would be strongly correlated to both zonal wind stress and wind stress curl in the southeast Pacific Ocean (Sprintall 2003), no significant spatial changes among years were observed in our data.
High concentrations of macronutrients were found in the Seasonal Ice Zone (SIZ), in accordance with previous works (Holm-Hansen et al. 1997; Castro et al. 2002; Serebrennikova & Fanning 2004). In summer, silicate concentration reaches ~70 µM, a value comparable to that provided by Hendry et al. (2008). Other authors had observed low concentrations of nutrients in coincidence with phytoplankton blooms (Smith et al. 2008; Tréguer & Jacques 1992), but during our cruises chlorophyll concentrations within the SIZ were low while macronutrients were always high.
The Permanent Open Ocean Zone (POOZ) was characterized by a gradient in silicate concentrations, which increased south of the PF, as previously described by Tréguer & Jacques (1992). Chemical species under study were normally high according to previous works (Brandini et al. 2000; DeMaster 2001; Castro et al. 2002; Kim et al. 2004), and despite the usually high standard deviation, they never reached limiting values for primary producers. Even so, this zone showed extremely low chlorophyll-a values, which was also the case in previous studies (Smith et al. 2008). This had led to the postulation of many hypotheses about other possible limiting factors for primary production, like iron depletion or a great depth of the mixed layer (Martin et al. 1990; Mitchell et al. 1991; Holm-Hansen et al. 1994).
An interesting inference emerges from the extension of these results. In theory, interfrontal zones of the ACC are characterized by similar properties around the Antarctic continent. However, this generalization would not apply to silicate concentration in the POOZ when the results for the DP are compared with those for the Indian sector (Lowanchi et al. 2001). The DP exhibited exceptionally high concentrations of silicate, which might be due to the inflow of North Atlantic Deep Water in the Atlantic sector (see Berger 2007).
The Polar Front Zone (PFZ) showed a decreasing trend from South to North in nitrate, phosphate and silicate. As in the POOZ, chlorophyll-a values were low, nutrients were high, and silicate was particularly higher than in other longitudes (Franck et al. 2000; Brzezinski et al. 2001; Sigmon et al. 2002; Coale et al. 2003; Leblanc et al. 2005; Brzezinski et al. 2005). This is supported by other studies carried out in the DP, which reported that silicate concentration were never limiting (Brandini 2000; Kim et al. 2004).
In the South American Coastal Zone (SACZ), nutrient concentrations were among the lowest registered in this work. Simultaneously, chlorophyll-a reached the highest measured values. This could be explained by a higher consumption of nutrients by phytoplankton due to better conditions for its growth within the continental shelf north of the sub-Antarctic Front, where there is a decrease in the mixing layer depth, an increase in temperature, and an increase in micronutrients such as iron (Klunder et al. 2014).
Climatological data of the DP show a higher concentration of phosphate and silicate in winter as compared to summer (García et al. 2010; Munro et al. 2015). However, none of the previous studies allows knowing when the minimum of macronutrient takes place. Our results show that nitrate and phosphate concentrations in the DP were somewhat lower in early fall than in summer. That minimum is determined by a complex sum of processes, which varies from year to year. The variations in sea ice distribution and the freshwater inputs from melting sea ice and glacial ice are the dominant influences on biogeochemical processes in Antarctic coastal systems (Vernet et al. 2008; Ducklow et al. 2013). The extent of the ice field surrounding the Antarctic continent in winter is close to 20x106 km2, but it drops in summer to 4x10⁶ km2 (Arrigo et al. 1997). This exposes 16x106 km2 of sea surface to interact with strong winds. Furthermore, this ice-free surface includes the area of greater upwelling, which is the SACCF (Martinson et al. 2008). This would lead to preserve the concentration of macronutrients in surface waters during summer (Smith et al. 2008). In early fall, the ice cover begins to grow and macronutrients decrease. However, this process occurs simultaneously with the drop in temperature and the increase of macronutrients by overall mixing of the water column. As a consequence, the minimum of macronutrients would take place in early fall.
The processes that determine annual changes did not follow predictable patterns like temperature variations in different seasons. It has been hypothesized that the greater influx of warmer Upper Circumpolar Deep Water (UCDW) from the ACC is the consequence of strengthening and southward-shifting winds over the Southern Ocean, often quantified by the movement of the Southern Annular Mode (SAM) to a more positive state. These atmospheric changes could induce stronger upwelling (Waugh et al. 2013) and onshelf flow at the Western Antarctic Peninsula shelf break and, hence, permit greater quantities of warmer water to intrude along the canyons toward the coast. Between the CWBF and the tip of the Antarctic Peninsula, intense winds drive an Ekman northward transport and a consequent Ekman pumping. This situation increases pCO2 and Chlorophyll (Bianchi et al. 2009) and probably nutrient concentrations by upwelling. On the other hand, the region between Tierra del Fuego and the SAF shows high chlorophyll values. Therefore, an enhanced phytoplankton concentration can lead to lower nutrients due to consumption. The SAM is also strongly implicated in the direct atmospherically forced changes impacting the area, along with the El Niño Southern Oscillation (ENSO) phenomenon via teleconnections with the tropical Pacific. Movement of the SAM to a more positive state is a well known phenomenon (Marshall et al. 2004; Thompson et al. 2011), and it is increasingly seen that the depletion of stratospheric ozone is a key factor in this forcing, along with contributions from greenhouse gas emissions (Lee & Feldstein 2013).
The annual trend of nutrient concentration is closely related with the advance and retreat of sea ice that surrounds the Antarctic continent (Dierssen et al. 2002). The annual changes in seasonality of ice fields are mainly driven by El Niño Southern Oscillation (Ducklow 2008; Stammerjohn et al. 2008; Smith et al. 2008; Martinson et al. 2008). The atmospheric response to "El Niño" in the DP are weak southerly winds, while during "La Niña" strong northwesterly winds are the response during spring to fall (Smith et al. 2008). When southern winds are weak, the retreat of ice during spring -particularly offshore- is delayed. On the other hand, strong winds from northwest lead to a quick retreat of offshore ice and pile-up of onshore ice. During "El Niño", ACC fronts are displaced northward. This results in reducing the mixing of coastal and oceanic waters. During "La Nina", ACC fronts are displaced southward. This results in increased mixing between coastal and oceanic waters (Ducklow et al. 2013).
This study shows nutrients concentration decreasing over the years in the DP. Year 2001 was the last of a three- "La Niña" year's series (Smith et al. 2008; Sprintall et al. 2008). Also, in that year, exceptional circumstances prevailed in the ice field of Antarctic Peninsula because of abnormalities in positive atmospheric pressure in the South Atlantic Ocean and negative atmospheric pressure in the Bellingshausen and Weddell Seas. This created a persistently strong flow of warm moist air from NNW over the Antarctic Peninsula (Massom et al. 2006). These conditions led to a quick and extensive retreat of the ice field (Turner et al. 2002). As a consequence, water column mixing was intensified and the upwelling of deep water strengthened (Martinson et al. 2008), leading to increased macronutrient concentrations in surface waters.
The remaining years covered by the present study (2002 to 2004) behaved like "El Niño" years (Massom et al. 2008). The progressive decrease in surface nutrient concentrations in DP waters can be explained by conditions associated with this climatic event in those years, as described above.
Conclusions
The spatial and temporal trends of nitrate, phosphate and silicate in surface waters of the Drake Passage during summer and early fall from 2001 to 2004 were studied. Because these nutrients are transported all around the Antarctic continent by the Antarctic Circumpolar Current and feed primary production and phytoplankton biomass, the area of its potential influence is very large.
Nutrient concentrations showed a minimum in early fall due to a complex sum of processes. In terms of years, nutrient concentrations show a decreasing trend. These variations are seemingly related to climatic processes such as Southern Annular Mode and El Niño Southern Oscillation, which regulate the ice fields and their relation to winds and the upwelling of bottom waters in the Southern Antarctic Circumpolar Current Front and the Antarctic Slope. A substantial part of the DP behaved during the studied seasons as a HNLC area. In contrast, nutrients were low and productivity high near the South America margin, suggesting that crustal-derived micronutrients such as iron are limiting phytoplankton growth in the DP. Although the zonation of the frontal and interfrontal areas has been described before based on physical measurements, here we show that the zonation is also evident in nutrient concentrations. The fronts of the Antarctic Circumpolar Current behave as barriers dividing zones with distinctive features. Given the ample diversity of the biological species in these zones, chemical measurements are an essential complement to understand their spatial and temporal dynamics.
ACKNOWLEDGMENTS. This study was conducted within the framework of a cooperative research program (ARGAU, Programme de Coopération avec la ARGentine pour l'étude de l'océan Atlantique AUstral) between the Laboratoire de Biogéochimie et Chimie Marines at the Université Pierre et Marie Curie in Paris (France), the Instituto Antártico Argentino and the Servicio de Hidrografía Naval (Argentina) from 2001 to 2004. We wish to thank L. Cantoni, A. Ulrich, C. Balestrini and M. Charo, for assistance during the fieldwork, as well as the crew members of the I/B "Almirante Irizar" and personnel of the Centro Nacional Patagónico. This project benefited from the PEI-2001, PICT-O 2010-0128 funds to V.A.A, and PICTO 6524/1108/03-ANPCyT 01-11563 grants to I.R.S. Comments provided by two anonymous reviewers greatly improved the paper. Finally, we thank Esteban G. Jobbágy for his great predisposition in the edition process.
References
1. Alder, VA & GA Thompson. 2000. Spatial and temporal distribution of tintinnids (Protozoa, Ciliata) in relation to frontal systems and the general hydrologic dynamics of the Southern Ocean (SW Atlantic Sector; 50°-64°S, 65°-49°W). Pp. 203-213 in: Davison, W; C Howard-Williams and P. Broady (eds.). Antarctic Ecosystems: Models for wider Ecological Understanding. New Zealand Natural Sciences. [ Links ]
2. Arrigo, KR; DL Worthen; MP Lizotte; P Dixon & G Dieckmann. 1997. Primary Production in Antartic Sea Ice. Science, 276:394-397. [ Links ]
3. Artamonov, YV; NP Bulgakov; PD Lomakin & EA Skripaleva. 2004. Vertical Thermohaline Structure, Water Masses, and Large-Scale Fronts in the Southwest Atlantic and Neighboring Antarctic Water Areas. Physical Oceanography, 14 (3):161-172. [ Links ]
4. Barker, PF; GM Filippelli; F Florindo; EE Martin & HD Scher. 2007. Onset and role of the Antarctic Circumpolar Current. Deep-Sea Research Part II: Topical Studies in Oceanography, 54(21-22):2388-2398. [ Links ]
5. Berger, WH. 2007. Cenozoic cooling, Antarctic nutrient pump, and the evolution of whales. Deep-Sea Research II, 54: 2399-2421. [ Links ]
6. Bianchi, AA; D Ruiz Pino; H Isbert Perlender; AR Piola; AP Osiroff; et al. 2009. Annual balance and seasonal variability of seaair CO2 fuxes in the Patagonia Sea: Their relationship with fronts and chlorophyll distribution. Journal of Geophysical Research, 114:C03018. [ Links ]
7. Boltovskoy, D; N Correa & A Boltovskoy. 2005. Diversity and endemism in cold waters of the South Atlantic: contrasting patterns in the plankton and the benthos. Scientia Marina, 69(2):17-26. [ Links ]
8. Brandini, FP; D Boltovskoy; A Piola; S Kocmur; R Rudiger; et al. 2000. Multiannual trends in fronts and distribution of nutrients and chlorophyll in the southwestern Atlantic (30-62ºS). Deep-Sea Research, 1(47):1015-1033. [ Links ]
9. Brzezinski, MA; DM Nelson; VM Franck & DE Sigmond. 2001. Silicon dynamics within an intense open-ocean diatom bloom in the Pacifc sector of the Southern Ocean. Deep-Sea Research II, 48:3997-4018. [ Links ]
10. Brzezinski, MA; JL Jones & MS Demarest. 2005. Control of silica production by iron and silicic acid during the Southern Ocean Iron Experiment (SOFeX). Limnology and Oceanography, 50(3):810-824. [ Links ]
11. Castro, CG; AF Ríos; MD Doval & FF Pérez. 2002. Nutrient utilization and chlorophyll distribution in the Atlantic sector of the Southern Ocean during Austral summer 1995-96. Deep-Sea Research II, 49:623-641. [ Links ]
12. Coale, KH; X Wang; SJ Tanner & KS Johnson. 2003. Phytoplankton growth and biological response to iron and zinc addition in the Ross Sea and Antarctic Circumpolar Current along 1701W. Deep-Sea Research II, 50:635-653. [ Links ]
13. Deacon, G. 1984. The Antarctic circumpolar ocean. Cambridge University Press; Studies in Polar Research. Pp. 180. [ Links ]
14. DeMaster, DJ. 2001. Marine Silica Cycle. Pp. 1659-1667 in: Steele, JH; SA Thorpe & KK Turekian (eds.). Encyclopedia of ocean science. Academic Press, San Diego, USA. [ Links ]
15. Dierssen, HM; RC Smith & M Vernet. 2002. Glacial meltwater dynamics in coastal waters west of the Antarctic Peninsula. Proceedings of the National Academy of Sciences, 99(4):1790-1795. [ Links ]
16. Ducklow, HW. 2008. Long-term studies of the marine ecosystem along the west Antarctic Peninsula. Deep-Sea Research II, 55:1945-1948. [ Links ]
17. Ducklow, HW; WR Fraser; MP Meredith; SE Stammerjohn; SC Doney; et al. 2013. West Antarctic Peninsula: An ice-dependent coastal marine ecosystem in transition. Oceanography, 26(3):190-203. [ Links ]
18. Dugdale, RC; FP Wilkerson & HJ Minas. 1995. The role of a silicate pump in driving new production. Deep-Sea Research, 42:697-719. [ Links ]
19. Falkowski, PG; RT Barber & V Smetacek. 1998. Biogeochemical controls and feedbacks on ocean primary production. Science, 281:200-206. [ Links ]
20. Franck, VM; MA Brzezinski; KH Coale & DM Nelson. 2000. Iron and silicic acid concentrations regulate Si uptake north and south of the Polar Frontal Zone in the Pacifc Sector of the Southern Ocean. Deep-Sea Research II, 47:3315-3338. [ Links ]
21. García, HE; RA Locarnini; TP Boyer; JI Antonov & MM Zweng. 2010. Nutrients (phosphate, nitrate and silicate). In: Levitus, S (ed.). World Ocean Atlas 2009. Volume 4. NOAA Atlas NESDIS 71, U.S. Government Printing Offce, Washington, D.C. Pp. 398. [ Links ]
22. Guerrero, RA; A Baldoni & H Benavides. 1999. Oceanographyc conditions at the southern end of the argentine continental slope. INIDEP Doc. Cient., 5:7-22. [ Links ]
23. Hendry, KR; REM Rickaby; JCM de Hoog; K Weston & M Rehkämper. 2008. Cadmium and phosphate in coastal Antarctic seawater: Implications for Southern Ocean nutrient cycling. Marine Chemistry, 112:149-157. [ Links ]
24. Holm-Hansen, O; AF Amos; N Silva; V Villafañe & EW Helbling. 1994. In situ evidence for a nutrient limitation of phytoplankton growt in pelagic Antartic waters. Antarctic Science, 6(3):315-324. [ Links ]
25 Holm-Hansen, O; CD Hewes; VE Villafañe; EW Helbling; N Silva; et al. 1997. Distribution of phytoplankton and nutrients in relation to different water masses in the area around Elephant Island, Antarctica. Polar Biology, 18:145-153. [ Links ]
26. Kim, D; J Shim; KT Kim & YC Kang. 2004. Distribution of total CO2, nutrients, chlorophyll-a in the Scotia Sea, during austral summer. Ocean and Polar Research, 26(3):401-414. [ Links ]
27. Klinck, J & WD Nowlin Jr. 2001. Antarctic Circumpolar Current. Pp. 151-159 in: Steele, JH; SA Thorpe & KK Turekian (eds.). Encyclopedia of ocean science. Academic Press, San Diego, USA. [ Links ]
28. Klunder, MB; P Laan; HJW De Baar; R Middag; I Neven; et al. 2014. Dissolved Fe across the Weddell Sea and Drake Passage: impact of DFe on nutrient uptake. Biogeosciences, 11:651-669. [ Links ]
29. Kuramoto, S & K Koyama. 1982. Preliminary report of the oceanographic observations on the 22nd Japanese Antarctic Research Expedition (1980-1981). Memoirs of National Institute of Polar Research. Special issue, 23:5-12. [ Links ]
30. Lara, RJ; V Alder; CA Franzosi & G Kattner. 2010. Characteristics of suspended particulate organic matter in the southwestern Atlantic: Infuence of temperature, nutrient and phytoplankton features on the stable isotope signature. Journal of Marine Systems, 79:199-209. [ Links ]
31. Leblanc, K; CE Hare; PW Boyd; KW Bruland; B Sohst; et al. 2005. Fe and Zn effects on the Si cycle and diatom community structure in two contrasting high and low-silicate HNLC areas. Deep-Sea Research I, 52:1842-1864. [ Links ]
32. Lee, S & SB Feldstein. 2013. Detecting ozone and greenhouse gas-driven wind trends with observational data. Science, 339:563-567. [ Links ]
33. Levitus, S; ME Conkright; JL Reid; RG Najjar & A Mantyla. 1993. Distribution of nitrate, fosfate and silicate in the world oceans. Progress in Oceanography, 31:245-273. [ Links ]
34. Marshall, GJ; PA Stott; J Turner; WM Connolley; JC King; et al. 2004. Causes of exceptional atmospheric circulation changes in the Southern Hemisphere. Geophysical Research Letters, 31:L14205. [ Links ]
35. Martin, JH; RM Gordon & SE Fitzwater. 1990. Iron in Antarctic waters. Nature, 345:156-158. [ Links ]
36. Martinson, DG; SE Stammerjohn; RA Iannuzzi; RC Smith & M Vernet. 2008. Western Antarctic Peninsula physical oceanography and spatio-temporal variability. Deep-Sea Research II, 55:1964-1987. [ Links ]
37 Massom, RA; SE Stammerjohn; RC Smith; MJ Pook; R Iannuzzi; et al. 2006. Extreme anomalous atmospheric circulation in the west Antarctic Peninsula region in austral spring and summer 2001/2, and its profound impact on sea ice and biota. Journal of Climate, 19(15):3544-3571. [ Links ]
38. Massom, RA; SE Stammerjohn; W Lefebvre; SA Harangozo; N Adams; et al. 2008. West Antarctic Peninsula sea ice in 2005: Extreme ice compaction and ice edge retreat due to strong anomaly with respect to climate. Journal of Geophysical Research, 113:C02S20. [ Links ]
39. Mitchell, GB; EA Brody; O Holm-Hansen; C McClain & J Bishop. 1991. Light limitation of phytoplankton biomass and macronutrient utilization in the Southern Ocean. Limnology and Oceanography, 36(8):1662 -1677. [ Links ]
40. Moore, JK; MR Abbott & JG Richman. 1999. Location and dynamics of the Antarctic Polar Front from Satellite Sea surface temperature data. Journal of Geophysical Research, 104(C2):3059-3073. [ Links ]
41. Munro, DR; NS Lovenduski; BB Stephens; T Newberger; KR Arrigo; et al. 2015. Estimates of net community production in the Southern Ocean determined from time series observations (2002-2011) of nutrients, dissolved inorganic carbon, and surface ocean pCO2 in Drake Passage. Deep-Sea Research II, 114:49-63. [ Links ]
42. Olguín, HF & VA Alder. 2011. Species composition and biogeography of diatoms in Antarctic and Subantarctic (Argentine shelf) waters (37-76° S). Deep-Sea Research II, 58:139-152. [ Links ]
43. Orsi, AH; T Whitworth & WD Nowlin Jr. 1995. On the meridional extent and fronts of the Antarctic Circumpolar Current. Deep-Sea Research, 42:641-673. [ Links ]
44. Peterson, RG & L Stramma. 1991. Upper-level circulation in the South Atlantic Ocean. Progress in Oceanography, 26: 1-73. [ Links ]
45. Sanders, R & T Jickells. 2000. Total organic nutrients in Drake Passage. Deep-Sea Research I, 47:997-1014. [ Links ]
46. Santoferrara, L & VA Alder. 2009. Abundance trends and ecology of planktonic ciliates of the south-western Atlantic (35-63° S): A comparison between neritic and oceanic environments. Journal of Plankton Research, 31:837-851. [ Links ]
47. Serebrennikova, YM & KA Fanning. 2004. Nutrients in the Southern Ocean GLOBEC region: variations, water circulation, and cycling. Deep-Sea Research II, 51:1981-2002. [ Links ]
48. Sigmon, DE; DM Nelson & MA Brzezinski. 2002. The Si cycle in the Pacific sector of the Southern Ocean: seasonal diatom production in the surface layer and export to the deep sea. Deep-Sea Research II, 49:1747-1763. [ Links ]
49. Smith, RC; DG Martinson; SE Stammerjohn; RA Iannuzzi & K Ireson. 2008. Bellingshausen and western Antarctic Peninsula region: Pigment biomass and sea-ice spatial/temporal distributions and interannual variability. Deep-Sea Research II, 55:1949- 1963. [ Links ]
50. Sprintall, J. 2003. Seasonal to interannual upper-ocean variability in the Drake Passage. Journal of Marine Research, 61: 27-57. [ Links ]
51. Sprintall, J. 2008. Long-term trends and interannual variability of temperature in Drake Passage. Progress in Oceanography, 77:316-330. [ Links ]
52. Stammerjohn, SE; DG Martinson; RC Smith & RA Iannuzzi. 2008. Sea ice in the western Antarctic Peninsula region: Spatio-temporal variability from ecological and climate change perspectives. Deep-Sea Research II, 55:2041-2058. [ Links ]
53. Strickland, JDH & TR Parsons. 1972. A practical handbook of seawater analysis. Fisheries Researches Board of Canadá, 167:1-310. [ Links ]
54. Technicon. 1977. Technicon Ind. Method 186-72/W: Silicate in water and seawater. Technicon Ind. Systems, Tarrytown, N.Y. USA. [ Links ]
55. Thompson, DWJ; S Solomon; PJ Kushner; MH England; KM Grise; et al. 2011. Signatures of the Antarctic ozone hole in Southern Hemisphere surface climate change. Nature Geoscience, 4:741-749. [ Links ]
56. Treguer, P & G Jacques. 1992. Dynamics of nutrients and phytoplankton, and fuxes of carbon, nitrogen and silicon in the Antarctic Ocean. Polar Biology, 12:149-162. [ Links ]
57. Turner, J; S Harangozo; G Marshall; J King & S Colwell. 2002. Anomalous atmospheric circulation over the Weddell Sea, Antarctica, during the Austral Summer of 2001/02 resulting in extreme sea ice conditions. Geophysical Research Letters, 29(2160):l-4. [ Links ]
58. Vernet, M; D Martinson; R Iannuzzi; S Stammeriohn; W Kozlowski; et al. 2008. Primary production within the sea-ice zone west of the Antarctic Peninsula: I-Sea ice, summer mixed layer, and irradiance. Deep-Sea Research II, 55: 2068-2085. [ Links ]
59. Watanabe, K. 1982. Centric diatom communities found in the Antarctic sea ice. Antarctic Record. National Institute of Polar Research, 74:119-126. [ Links ]
60. Waugh, DW; F Primeau; T DeVries & M Holzer. 2013. Recent changes in the ventilation of the southern oceans. Science, 339(6119):568-570. [ Links ]
61. Whitehouse, MJ; J Priddle & MA Brandon. 2000. Chlorophyll/nutrient characteristics in the water masses to the north of South Georgia, Southern Ocean. Polar Biology, 23:373-382. [ Links ]
62. Whitworth, T. 1980. Zonation and geostrophic fow of the Antarctic Circumpolar Current at Drake Passage. Deep-Sea Research, 21:497-507. [ Links ]
63. Zhang, B & JM Klinck. 2008. The efect of Antarctic Circumpolar Current transport on the frontal variability in Drake Passage. Dynamics of Atmospheres and Oceans, 45:208-228. [ Links ]

