


Servicios Personalizados
Revista

Articulo
 Inglés (pdf)
 Articulo en XML
 Referencias del artículo
 Enviar articulo por email
Indicadores
-
 Citado por SciELO
Links relacionados
-
 Similares en
SciELO
Similares en
SciELO
Compartir

 Permalink
Agriscientia
versión On-line ISSN 1668-298X
Agriscientia v.24 n.1 Córdoba ene./jun. 2007
Modeling population dynamics of Anoda cristata in a glyphosate-resistant soybean crop under different management systems
Puricelli, E.; J.I. Vitta, M.R. Sabbatini and G. Orioli
E. Puricelli and J Vitta. Facultad de Ciencias Agrarias, Universidad Nacional de Rosario. S 2125 ZAA - CC 14, Zavalla, Santa Fe, Argentina. (J. Vitta, deceased in May 2006.) M.R. Sabbatini and G. Orioli, Facultad de Agronomía, Universidad Nacional del Sur. 8000. Altos del Palihue, Bahía Blanca, Buenos Aires, Argentina. Correspondence to: E. Puricelli puri@arnet.com.ar
Abstract
A computer simulation model was developed to describe Anoda cristata (L.) Schlecht seedbank dynamics in soybeans. The model considers different weed management strategies: absence of control, control with the recommended rate and with glyphosate at half the recommended rate, and two soybean row spacings (35 and 70 cm). The model was evaluated using data from previous experiments obtained for four consecutive years. The model accurately reproduced the seedbank dynamics. The seedbank decreased more in weed management strategies without seed production. In absence of control, the seedbank reached an equilibrium density. When seeds were produced every year, the model output was more sensitive to changes in the rate of predation; but without seed production, seed mortality was the most important process. Simulation demonstrated that long-term eradication may occur with continuous use of glyphosate at the recommended rate or with the combination of soybean at 35 cm between rows and glyphosate at half the recommended rate.
Key words: Anoda cristata; Reduced glyphosate rates; Seedbanks; Weed population dynamics.
Puricelli, E.; J.I. Vitta, M.R. Sabbatini y G. Orioli, 2007. Modelo de la dinámica poblacional de Anoda cristata en un cultivo de soja resistente a glifosato bajo diferentes sistemas de manejo. Agriscientia XXIV (1): 1-9
Resumen
Se desarrolló un modelo de simulación de la dinámica del banco de semillas de Anoda cristata (L.) Schlecht en un cultivo de soja. El modelo considera distintas estrategias de manejo: ausencia de control, control con la dosis recomendada y con la mitad de dicha dosis y dos espaciamientos entre filas del cultivo de soja (35 y 70 cm). El modelo fue evaluado usando datos de experiencias previas realizadas durante 4 años consecutivos. El modelo reprodujo ajustadamente la dinámica del banco de semillas. El banco de semillas decreció más cuando no se produjeron semillas; en ausencia de control, alcanzó una densidad de equilibrio. Cuando se produjeron semillas todos los años, el modelo fue más sensible a cambios en la tasa de predación pero cuando no se produjeron semillas, la mortalidad de éstas fue el proceso más importante. La simulación muestra que puede ocurrir erradicación a largo plazo con el uso continuo de glifosato a la dosis recomendada, o con la combinación de soja sembrada a 35 cm entre filas y la mitad de la dosis recomendada.
Palabras clave: Anoda cristata; Dosis reducidas de glifosato; Banco de semillas; Dinámica poblacional de malezas.
Fecha de recepción: 17/10/06; fecha de aceptación: 27/06/07
Introduction
The widespread adoption of glyphosate resistant crops in Argentina has increased the use of glyphosate in field crops (Vitta et al., 2004). The area planted with herbicide-resistant soybean represents 98% of the total soybean area (James, 2001). Current economic, environmental and management concerns have provided incentive to manage weed populations according to sustainable practices, with less reliance on herbicides. One of such practices consists of applying reduced herbicide rates to provide effective control of susceptible species and to reduce biomass of less susceptible species giving the crop a competitive growth advantage (Vangessel & Westra, 1997). Another way of promoting sustainable weed management is to decrease crop row width as a means of increasing crop competition and suppressing weed growth (Johnson et al., 1997). In Argentina, soybean was initially planted in wide rows but the adoption of narrower and denser row spacing is now increasing. Earlier results in narrow-row soybean show that this technique can provide adequate weed control and soybean yield (Steckel et al., 1990; Buhler et al., 1993; Prostko & Meade, 1993; Krausz et al., 1996; Johnson et al., 1997). The efficacy of reduced glyphosate rates is better in combination with soybean planted in narrow rows (Puricelli et al., 2004).
Models play a central role in the study of plant population dynamics and may help producers manage weeds (Mortensen & Coble, 1991) and direct future experimental programs (Cousens & Mortimer, 1995). Simulation models are useful to compare long-term consequences combining weed management practices as herbicide rate with crop row width. Weed population models can help to identify changes in important weed life stages and the life cycle at a particular point (González-Andújar & Fernández- Quintanilla, 1991) and are a unique tool to describe the interactions between cropping systems and weed dynamics (Colbach & Debaeke, 1998). In annual weeds, as the seedbank is the only source of the renewal of populations, knowledge of the characteristics of this seedbank is useful to develop sustainable weed management (Zimdahl, 1995; Buhler et al., 1997). Anoda cristata (L.) Schlecht is an annual weed with a relative small but persistent seed-bank (Puricelli et al., 2002). The weed is recognized as an increasing problem in soybean [Glycine max (L.) Merr.] crops in the central and north western soybean areas in Argentina (Marzocca, 1976). Soybean yield may be reduced up to 25% in presence of 12 plants/m-2 of A. cristata (Puricelli et al., 2003). Research has quantified A. cristata seedbank, seedling recruitment, plant mortality and seed production in different cohorts (Puricelli et al., 2002), competition with soybean crops planted at different row spacing (Puricelli et al., 2003), glyphosate effects on weed density, biomass and seed production (Puricelli et al., 2004) and seed predation in soybean in different row spacing and tillage systems (Puricelli et al.,2005) but a simulation model to predict the long-term effects of management techniques on the population dynamics of the weed is lacking.
The objective of this study was to model the population dynamics of A. cristata in a soybean monoculture and to evaluate the consequences of modifying both glyphosate rate and crop row spacing on weed population size.
Materials and methods
Experimental site
Experiments were conducted at the University of Rosario Experimental Farm, Argentina (Lat. 33° 01' S; Long 60º 53'), on a vertic argiudol soil with a 0 - 2% slope; 3% organic matter; pH of 5.8, and 5% sand, 70% silt and 25% clay. During 12 years before initiating this study, the site was harrow-disked in the spring for soybean planting. Anoda cristata plants had been observed since 1990. Rainfall during the crop growing season in the years of this study were strikingly different -vaying from 396 to 869 mmwhich is representative of the rainfall extremes experienced in the region. There was sufficient moisture each year at planting date. Crop emergence was at approximately 7 days after planting.
Model description
A computer simulation model was developed to describe A. cristata population dynamics in a soybean monoculture weed control (absence of control, control with glyphosate at half of the recommended rate -540 g a.e. ha-1-, with the recommended rate - 1080 g a.e. ha-1-), and two soybean row spacing (35 and 70 cm). The herbicide was applied approximately 30 days after soybean planting when A. cristata plants had approximately 8 leaves. The model considers a reduced tillage system consisting of plots being disked and harrowed prior to planting in spring with a the depth of cultivation of 15 cm. Based on Cousens & Mortimer (1995), the life-cycle of A. cristata was divided in four stages: (i) seeds in the soil (Ss); (ii) seedlings (Sl); (iii) mature plants (M) and (iv) seeds on parent plant (Sp) (Figure 1).

Figure 1. Diagrammatic model of the life cycle of Anoda cristata. r = seedling recruitment; mt = natural mortality; k = herbicide mortality; q = fecundity; p = predation and ms = seedbank mortality.
The arrows leading from one stage to the next indicate processes and parentheses next to the arrows represent the rate at which a process occurs. The model considers the following rates: seedling recruitment (r); seed predation (p); seed mortality (ms); natural seedling mortality (ml); herbicideinduced seedling mortality (k) and seed production (q). Rates are average fixed parameters of data recorded in different years. Anoda cristata seedling density (Sl) was predicted from seedbank density (Ss) and seedling recruitment (r), a fixed parameter of data recorded in different years.
Mature plant density of A. cristata (M) was predicted from Sl, natural seedling mortality (ml) and herbicide- induced plant mortality (k) as follows:
Where k value changes according to glyphosate rate and row spacing. Seed density on parent plant (Sp) was the only density-dependent process included in the model and it was predicted from the following equation:
Where i and a are parameters of the equation. i is the initial slope parameter and a is the asymptotic seed production per unit area at high A. cristata densities. Equations were fitted for each weed control strategy. Seed density in the soil (Ss); was predicted from seeds on parent plant (Sp), seed predation (p), seedling recruitment (r) and seed mortality (ms), by using the next equation:
The model considers that glyphosate was the only weed control method and that the herbicide was applied when weed plants had 7-8 leaves 35 days after soybean planting. Application time was chosen considering that an earlier application could result in new A. cristata emergence that may compete with the crop and produce seeds and a later control could result in important crop yield reductions due to plants present beyond the critical period of competition. The critical period of weed control in soybean was found to be the period of 30 to 45 days after planting (Chhokar & Balyan, 1999). The model assumes that A. cristata was the only weed present in the field and that its spatial pattern is homogeneous. There may be great seed dispersal both from and to the point of production by machine harvesting (Ballaré et al., 1987). However, in order to predict from the model the effect of control practices on the seedbank in the following season, we assumed that no seeds are dispersed by harvesting.
Model parameterisation
Determination of seeds in the soil (Ss); seedling recruitment (r) and natural seedling mortality (ml).
Data on these determinations and a complete account of experimental methods were originally published by Puricelli et al. (2004) and Puricelli & Faccini (2005). Demographic studies of A. cristata were conducted at the University of Rosario Experimental Farm at Zavalla (lat. 33º01´S; long 60º53´) in a reduced tillage system from 1997 to 2000. Soybean was planted at two planting patterns: 35 cm (371,800 plants/ha) and 70 cm between rows (280,000 plants/ha) with and without glyphosate application. To assess both r and ml, individual weed plants were marked with wires of different colors to identify seedling emergence and planting mortality in each recording date. The r value was calculated as the proportion of A. cristata plants that emerged each year from the seedbank. To determine Ss, the experimental plots were sampled systematically each year at soybean planting using a soil probe.
Determination of herbicide-induced seedling mortality (k) and seed density on parent plant (Sp).
Data on these determinations and a complete account of experimental methods were published by Puricelli et al. (2002) and Puricelli & Faccini (2005). Experiments were conducted during 1997 and 1998 in the same experimental site detailed in the previous section. The effect of two planting patterns (35 cm between rows -514,800 plants/ha- and 70 cm between rows -375,000 plants/ha-), glyphosate rate (0,540 and 1080 g a.e./ha) and A. cristata density (2, 4, 7, 12 and 30 plants/m2) on weed seed production was determined. Values of k were obtained from 1997 experiment by marking weed plants with wires before herbicide application and counting surviving plants at harvest. The equation (4) was used to calculate Sp by pooling data of both years. Values of Sp were obtained only at 35 and 70 cm between rows without glyphosate and at 70 cm between rows with 540 g a.e./ha of glyphosate. In the rest of the treatments no seed production was detected.
Determination of seed predation (p)
Seed predation was determined at the same experimental site described previously in a soybean monoculture in a reduced tillage and a non-tillage system in soybean planted at 70cm -280,000 plants ha-1-(Puricelli et al., 2005). However, as all the other parameters were calculated for reduced tillage, only predation rate in this tillage system was considered in the model. Plots were 15 x 20 m with 3 replicates. One hundred A. cristata seeds were placed in plastic plates (15 x 15 cm, 1.5 deep) filled with field soil. Five 3-mm holes were drilled in the bottom of each box to allow water to drain. Five plates without predation exclosure and two with predation exclosure, located at random in the centre of each plot were buried so that the surfaces of soil in and surrounding the plates were leveled. Soybean residue was scattered over the plates in a manner similar to that of the surrounding plot area. The plates were collected every fifteen days, taken to the laboratory, where seeds were separated and counted. The next set of plates was put in the field at random in the same day. Seed predation rate was calculated as follows.
where s is the proportion of seeds predated each day, r is the proportion of the remaining seeds and t is the duration of the experiment in days (Mittelbach & Gross, 1984). The value of p from April (concurring with the end of weed seed rain) until November (concurring with soybean sowing) was obtained by integrating daily values of s. Only one value of seed predation was considered because it did not differ between row spacing (Puricelli et al., 2005).
Determination of seed mortality (ms)
Seeds of A. cristata were collected from plants in the field at Zavalla at the end of soybean growing season on May 1996. Lots of 100 A. cristata seeds were placed into polyprolylene packets (~~10 cm by 10 cm, 1 mm mesh size) which allowed passage of water, gases, and microorganisms and provided an effective barrier against predators. Packets were both, placed at 0 and 5 cm from the soil surface and were positioned horizontally to avoid overlap. No soil was added inside the packets. The time from harvest to seed burial was 3 days. Plots were arranged as a complete randomized design with three replications. Seed packets were exhumed at intervals varying from 2 to 6 months over the next 84 months and, following removal from each packet, intact seeds were counted to determine percent of persistent seeds. To determine germinability, seeds were washed in water surface sterilized in a sodium hypoclorite solution (1% V/V) placed on water-saturated blotting paper in 11 by 11 by 4-cm covered plastic boxes. Boxes were placed for 15 d in optimum germination conditions in a dark growth chamber at 25 ºC (Solano et al., 1976; Faccini et al., 1985). Germinated seeds were counted and removed every 2 days. The blotter paper was kept moist by adding distilled water as needed. Seeds were considered germinated when the radicle has extended at least 1 mm. On day 15, the remaining ungerminated seeds were cut and treated with 0.1% (w/v) tetrazolium chloride to determine viability. The relationship between seedbank survivorship (1-ms) and time was obtained by fitting the following equation:
Where l - ms is seedbank survivorship (%), a and b are constants and x are months since seed burial.
Model evaluation
Data on evaluation and a complete account of experimental methods were published by Puricelli & Faccini (2005). The experiment was established at the same experimental site described previously, in a soybean monoculture using a reduced tillage system consisting of a disk-harrow prior to soybean planting. The same plots were used each year from 2001 to 2003 for the same treatments. The experimental design was a split plot. The main factor consisted of two soybean planting patterns (35 cm between rows -310,800 plants/ha- and 70 cm between rows -233,100 plants/ha-) in November. The second factor consisted of glyphosate rate (0, 540 and 1080 g a.e./ha).
To study the seedbank, in all soybean planting patterns and glyphosate rates, each plot was sampled each year at planting date. Two soil cores per plot were taken with a 5.5 cm diameter soil probe to a depth of 15 cm.
Sensitivity analysis
A sensitivity analysis was conducted for various model input parameters and for all combination of herbicide rate and row spacing. Sensitivities of simulated Ss to r, p and ms after four years of soybean cropping were determined by increasing individual parameter values by 10%. The relative sensitivity (RS) of the parameter (h) was calculated as follows:
A large value of RS indicates that a small variation in the parameter will result in a large modification in the model output.
Model application
Using the parameters estimated, we were able to determine the generation map of A. cristata after four years of simulations. According to Cousens & Mortimer (1995), a generation map is a graphical way of depicting the trajectory of a population, where seedbank densities in x successive generations are plotted against one another. Equilibrium seedbank population size (i.e., Nt+x = Nt) is indicated by the intersection with the diagonal line of unit slope. Points above this line indicate that density is increasing and points below the line indicate a decreasing density. We calculated a generation map for each weed management strategies simulated.
Results
Parameter estimates
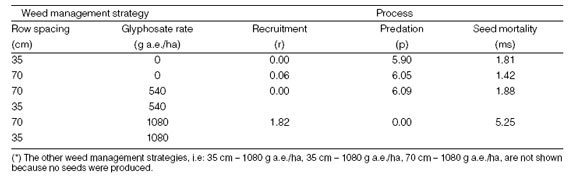
At soybean planting, the seed mortality parameter ms -obtained from equation (6)- was 24.0, 23.0, 11.3, 7.6 and 5.7 per year for the first five years. Seeds recovered from 0 and 5 cm were pooled to fit the equation (6) as no differences in seedbank survival from both depths were observed (Puricelli et al., 2005). Both seedling recruitment (r) and natural seedling mortality (ml) were 0.1 (SE = 0.01) and 0.3 (SE = 0.16), respectively. The value obtained for k parameter was 0.3 (SE = 0.04) for 70 cm row spacing with 540 g a.e./ha of glyphosate and 1.0 (SE = 0.001) for the rest of the herbicide treatments, indicating no plant survival. The parameter i of the equation (3) relating seed density on parent plant to numbers of mature plants was significantly lower in the treatment with half rate of glyphosate than in the treatments without herbicide (P < 0.05) (Table 1).
Table 1: Parameter values obtained from relating seed density on parent plant (Sp) to number of mature plants, according to equation Sp = iM/[1 + (iM/a)]; where M is mature plant density of A. cristata, i is the initial slope parameter and a is the asymptotic seed production per unit area at high A. cristata densities. For the same column, different letters indicate significant differences between parameters, based on a LSD test (P = 0.05)

The parameter a differed only among treatments without herbicide being highest at 70 cm between rows (P < 0.05). The value of p was 0.85 (SE = 0.001).
Model evaluation
The model was evaluated in a reduced tillage system with independent data. The model accurately reproduced the tendency of the seedbank dynamics in all weed management strategies (Figure 2).
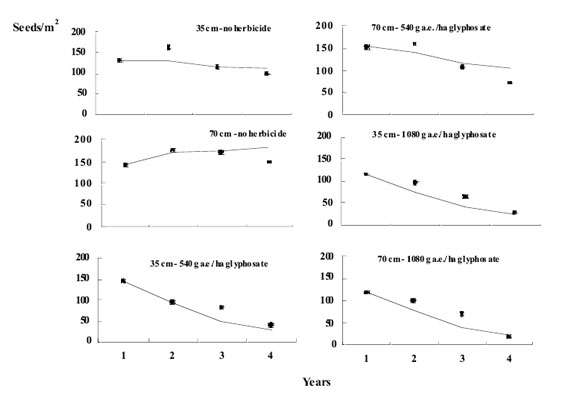
Figure 2. Evaluation of the model of Anoda cristata in different weed management strategies: Points indicate real number of seed/m2 and the line indicates the simulation results. The bars represent ±SE from the mean.
In weed management strategies that assume no seed production (i.e., 70 cm between rows- 1080 g a.e./ha and 35 cm between rows-540 and 1080 g a.e./ha) the seedbank decreased drastically during the four years of observations and simulations. At 70 cm between rows and 540 g a.e./ha, the population also decreased but in a lesser extent. Finally, when no herbicide was applied, population tended to reach an equilibrium density.
Sensitivity analysis
In weed management strategies where seeds were produced every year, i.e.: no herbicide or half rates of glyphosate on wide rows, the model output was more sensitive to changes in the rate of predation (Table 2).
Table 2: The sensitivity of seedbank population of Anoda cristata for changes in 10% in the values of the demographic process after the five years simulation time.
In such cases, the model showed a lowest sensitivity to changes in the rate of recruitment and an intermediate sensitivity to variations in seed mortality. On the contrary, in treatments where no seed were produced, sensitivity was highest for seed mortality and lowest for predation. Sensitivity analysis was not done for 35 cm - 1080 g a.e./ha of glyphosate and 70 cm - 1080 g a.e./ha of glyphosate due to absence of seed production in these treatments.
Model application
The calculated generation maps predicted a specific trajectory for each of the weed management strategies (Figure 3).
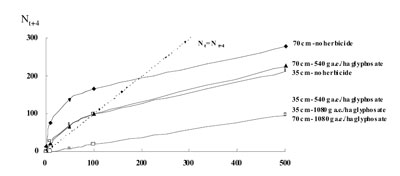
Figure 3. Trajectories of A. cristata seedbank calculated during four years of simulations and for different weed management strategies.
After four years of simulations, the calculated equilibrium population sizes (i.e. the points where generation map intercepts the diagonal line of unit slope) were: around 200 seeds/m2 at 70 cm between rows - without herbicide and, 100 seeds/m2 at both 35 cm between rows - without herbicide and 70 cm between rows - 540 g a.e./ha of glyphosate. In the rest of weed management alternatives (i.e. at 35 cm between rows-540 g a.e./ha of glyphosate, 35 cm between rows-1080 g a.e./ha of glyphosate and 70 cm between rows-1080 g a.e./ha of glyphosate), where herbicide killed all the plants and no seed production was assumed, there was no cross-over of the trajectory and the diagonal line, indicating seedbank tended to become extinct. -
Discussion
Simulation results demonstrated that methods used alone or in combination may reduce weed population in different degrees. The combination of narrow soybean spacing with a reduced glyphosate rate tended to decrease A. cristata populations in a similar way than strategies based on the use of recommended rate of the herbicide, indicating the advantage of using an integrated approach for weed management. The model incorporates the effect of the increased seed production when no herbicide is applied or when the herbicide rate is reduced which accounts for the increase in the number of seeds returned to the seedbank when plants are not killed and the greater weed density in future years.
Large sensitivity values were found for seed predation and decay when no herbicide or sub-lethal herbicide rates were used. Seed predation reduces seeds by the attack of insects, birds or mammals in many weed species (Buhler et al., 1997) and may be considered a point of vulnerability for population growth. This would be particularly true in agroecosystems with no or little herbicide use where high weed seed production occurs (i.e. organic cropping). In these systems, the proliferation of predators could be considered a way to reduce A. cristata seedbank. On the contrary, when the recommended rate in combination with any spatial arrangement or half of the recommended glyphosate rate in combination with the narrower soybean spacing were simulated, seed production was nil and thus predation effect was severely reduced. In these situations, seed decay had the largest effect, so this process should be particularly favorable to reduce the seedbank.
Sensitivity values were lower for recruitment and mortality rates. These two parameters may vary substantially between years within weed populations and these variations may turn modeling less precise (Doyle, 1991). However, in the modeled soybean monoculture systems, A. cristata recruitment proved to be stable between years but natural mortality rates were quite variable between years (Puricelli et al., 2002). The model discriminates natural mortality and induced herbicide mortality, providing a better description of population growth with and without herbicide use.
The generation map indicates that long-term eradication may occur with the continuous use of glyphosate at the recommended rate or with the combination of narrow-row soybean and glyphosate at half of the recommended glyphosate rate. However, both seed dispersal and weed spatial dynamics are not considered by the model. These processes are important in defining weed densities within fields and might contribute to make weed extinction impossible at this scale. When seed production is simulated by the model, generation maps show that seedbank population levels of A. cristata do not increase indefinitely and a tendency to a stable equilibrium is observed. This result indicates that intra-specific competition is involved in regulating weed seed population density (Cousens & Mortimer, 1995). This regulation consists of a reduction in number of seeds per plant with increasing weed density. In another model, Setaria faberi Hermm. seedbanks did not increase to infinite because seed production was also limited by density- dependent factors at high densities (Bussan & Boerboom, 2001).
Furthermore, in our model the equilibrium reached in absence of weed control is lower for narrow compared with wide-row soybean indicating that crop competition plays a significant role in the regulation of weed seedbank. Equation (3) relating seed density on parent plant and mature plants accounts for this behavior. The parameter a of this equation was higher for an interrow distance of 70 cm vs. 35 cm, indicating that the asymptotic seed production per unit area was higher in wide row spacing.
Simulation results emphasize the importance of considering weed ecology principles to design sustainable weed management strategies less dependent on herbicides. Although weed population models are relatively frequent in the literature, many of them were constructed from data obtained in a single year. Model evaluation along years is even more uncommon (Cousens & Mortimer, 1995). In order to guarantee the quality of the model predictions, long-term data sets are needed (Cousens & Mortimer, 1995) and the model needs to be tested in a large range of situations. In this paper, we evaluated our model over several years. However, the experiments for both the construction and the evaluation of the model from independent experiments carried out at the same location. Results indicate that the model predicts accurately the population growth of A. cristata. Therefore, we considered that the population trajectories simulated and the inferences about the relative importance of the processes involved in seedbank dynamics are reliable enough although the model does not include the effect of differing environmental conditions. Because there were only two row spacing, it was not possible to investigate the effect of row spacing in more detail as well as other cultivation techniques. Furthermore, future investigations oriented to incorporate seed dispersal and weed spatial distribution are encouraged as a way to improve the robustness of the model.
References
1. Ballaré, C.L.; A.L. Scopel; C.M. Ghersa and R.A. Sánchez, 1987. The demography of Datura ferox (L.) in soybean crops. Weed Research 27:91-102. [ Links ]
2. Buhler, D.D.; J.L. Gunsolus and D.F. Ralston, 1993. Common cocklebur (Xanthium strumarium) control in soybeans (Glycine max) with reduced bentazon rates and cultivation. Weed Science 41:447-453. [ Links ]
3. Buhler, D.D.; R.G. Hartzler and Forcella F., 1997. Implications of weed seedbank dynamics to weed management. Weed Science 45:329-336. [ Links ]
4. Bussan, A.J. and C.M. Boerboom, 2001. Modeling the integrated management of giant foxtail in corn-soybean. Weed Science 49:675-684. [ Links ]
5. Chhokar, R.S. and R.S. Balyan, 1999. Competition and control of weeds in soybean. Weed Science 47:107-111. [ Links ]
6. Colbach, N. and P. Debaeke, 1998. Integrating crop management and crop rotation effects into models of weed population dynamics: a review. Weed Science 46:717-728. [ Links ]
7. Cousens, R. and M. Mortimer, 1995. Dynamics of weed populations, Cambridge University Press, UK. [ Links ]
8. Doyle, C.J., 1991. Mathematical models in weed management. Crop Protection 10:432, 444. [ Links ]
9. Faccini, D.; E. Giuggia; H. Ramírez and A. Mitidieri, 1985. Efectos de distintos métodos para la ruptura de la dormición en semilla de malva cimarrona (Anoda cristata (L.) Schlecht). Revista de Investigaciones Agropecuarias 20:69-85. [ Links ]
10. González Andújar, J.L. and C. Fernández Quintanilla, 1991. Modelling the population dynamics of Avena sterilis under dry-land cereal cropping systems. Journal of Applied Ecology 28:16-27. [ Links ]
11. James, C. 2001 Global Review of Commercialised Transgenic Crops, 2001. ISAAA Briefs, 24: Preview ISAAA: Ithaca, NY, p. 15. [ Links ]
12. Johnson, W.G.; J.A. Kendig; R.E. Massey; M.S. Defelice and C.D. Becker, 1997. Weed control and economic returns with postemergence herbicides in narrow-row soybeans (Glycine max). Weed Technology 11:453-459. [ Links ]
13. Krausz, R.F.; G. Kapusta and J.L. Matthews, 1996. Control of annual weeds with glyphosate. Weed Technology 10:957-962. [ Links ]
14. Marzocca, A., 1976. Manual de Malezas. Hemisferio Sur, 580 p. [ Links ]
15. Mittelbach, G.G. and K.L. Gross, 1984. Experimental studies of seed predation in old-fields. Oecologia 65:7- 13. [ Links ]
16. Mortensen, D.A. and H.D. Coble, 1991. Two approaches to weed control decision-aid software. Weed Technology 5:445-452. [ Links ]
17. Prostko, E.P. and J.A. Meade, 1993. Reduced rates of postemergence herbicides in conventional soybeans (Glycine max). Weed Science 38:541-545. [ Links ]
18. Puricelli, E.; G. Orioli and M.R. Sabbatini, 2002. Demography of Anoda cristata in wide- and narrow- row soyabean. Weed Research 42:456-464. [ Links ]
19. Puricelli, E.; D. Faccini; M.R. Sabattini and G. Orioli, 2003. Spurred anoda (Anoda cristata) competition in narrowand wide-row soybean (Glycine max). Weed Technology 17:446-451. [ Links ]
20. Puricelli, E.; D. Faccini, D.; G. Orioli and M.R. Sabbatini, 2004. Anoda cristata control with different glyphosate doses in soybean (Glycine max) in narrow- and widerow soybean. Weed Research 17:446-451. [ Links ]
21. Puricelli, E.; D. Faccini; M.R. Sabbatini and G. Orioli, 2005. Seed survival and predation of Anoda cristata in soybean crops. Weed Research 45:477-488. [ Links ]
22. Puricelli, E. and D. Faccini, 2005. Effect of soybean spatial arrangement and glyphosate dose on Anoda cristata demography. Crop Protection 24:241-249. [ Links ]
23. Solano, F.; Schraeder J.W. and H.D. Coble, 1976. Germination, growth, and development of spurred anoda. Weed Science 24:574-578. [ Links ]
24. Steckel, L.E.; M.S. Defelice and B.D. Sims, 1990. Integrating reduced rates of postemergence herbicides and cultivation for broadleaf weed control in soybeans (Glycine max). Weed Science 38:541-545. [ Links ]
25. Vangessel, M.J. and P. Westra, 1997. Economics and efficacy of postemergence spurred anoda (Anoda cristata) control in pinto beans (Phaseolus vulgaris). Weed Technology 11:329-334. [ Links ]
26. Vitta, J.; D. Tuesca and E. Puricelli, 2004. Widespread use of glyphosate tolerant soybean and weed community richness in Argentina. Agriculture, Ecosystems & Environments 103:621,624. [ Links ]
27. Zimdahl, R.L., 1995. Weed science in sustainable agriculture. American Journal of Alternative Agriculture 10:138- 142. [ Links ]

