


 Inglés (pdf)
 Articulo en XML
 Referencias del artículo
 Enviar articulo por email
 Citado por SciELO
  Similares en
SciELO
Similares en
SciELO 
 Permalink
INTRODUCTION
The ecosystems in arid and semi-arid lands have suffered several degradation processes in the last decades such as soil and fertility loss, reduction in the forage productivity and changes in the physiognomy of forests, woodlands and rangelands. The degradation causes are due to deforestation, intense and continuous grazing, wildfires, and oscillations in the climatic regimes (McNeely, 2003; Teague and Kreuter, 2020; Chang et al, 2021).
These ecosystems show a considerable spatial heterogeneity regarding solí, vegetation, and fauna due to both natural and anthropic causes. Anthropic causes promote ecosystems with a shrubby matrix and bare soil areas of reduced physical and chemical fertility. They are usually characterised by the presence of sparse trees and shrubs, as a consequence of the sustained extractive use of the natural resources within the ecosystems, promoting better environmental conditions under the tree canopy compared to the intercanopy areas (Tongway and Ludwig, 2005). Such areas are known as “fertility islands” and are the result of a significative accumulation of soil particles, water, nutrients and biomass understorey (Rossi and Villagra, 2003; Ridolfi, Laio and D'Odorico, 2008).
The importance of trees is well known in arid and semi-arid lands as the primary regulators of terrestrial natural ecosystems or agroforestry systems (Dohn et al., 2013; Gao et al., 2018). Trees modify the physical, chemical and biological soil dynamics, regulating the amount and aval lability of nutrients, water and the functioning of living organisms, creating different micro-environments than those from above canopy. However, the studies about the ¡nfluence of shrubs in the dynamics of the fertility islands are sometimes contradictor^ They seem to depend on the species, shrub size, and environmental context (Thompson, Walker, Landau and Stark, 2005; Qu et al., 2017; Ward et al., 2018). In arid and semi-arid lands vegetation is particularly important as a factor regulating the water dynamics. It plays an important role in regulating interception, throughfall and stemflow redistribution, altering water availability, the impact energy of the droplets and runoff (Magliano, Whitworth-Hulse, Florio, Aguirre and Blanco, 2019).
The ecosystems in the Arid Chaco in Argentina are not the exception to the previously described degradation processes. They have suffered a critical reduction in productivity and regulation capacity in the last century, often transforming forests into degraded woodlands. These woodlands are extensively characterised by fertility islands nursed by Prosopis flexuosa DC. trees and Larrea divaricata Cav. shrubs (Karlin, Karlin, Coirini, Reati and Zapata, 2013).
Currently, due to changes in conservation and production paradigms, and to the changes in environmental and socioeconomic conditions, the role of shrubs in the regulation of ecosystem services is revisited. The study of the changes in biotic and abiotic variables both within and outside fertility islands is of importance in arid and semi-arid ecosystems in order to determine management, rehabilitation and conservation guidelines (Varela, Varas, Rattalino, Crabbe and Ordano, 2017).
The hypothesis was that in secondary woodlands in the Arid Chaco, both P. flexuosa and L. divaricata enhance physical soil conditions and microclimate variables, positively affecting the understorey vegetation. We predict an increase in soil moisture under canopy with respect to intercanopy areas due to improved infiltrability, reduction of soil bulk density, reduction of soil and air temperature and increased air moisture. Despite probable reductions in light intensity under canopy, the former factors might improve the frequencies in the most palatable species understorey. These effects might prove to be stronger in P. flexuosa fertility islands. The objective was to evaluate soil and microclimate biophysical variables on plant response under and intercanopy.
MATERIALS AND METHODS
Study sites and experimental design
Two plots corresponding to livestock closures on recovery were selected in the locations of La Patria (31° 32' 00” S, 65° 30' 20” W) and Los Medanitos (31° 36' 00” S, 65° 33' 00” W). The first is located at 13 km and the last at 23 km southwest of the Chancaní location, both in the Pocho Department, at the westernmost part of the Province of Córdoba, Argentina (Figure 1). According to Koppen's climatic classification (Beck etal., 2018), the study area has a warm semi-arid climate (BSh). Precipitations are highly variable and range between 350 mm and 650 mm (Karlin, 2012). During 2019, rainfall was 741 mm, calculated as the monthly rainfall weighted average with data from the cities of Villa Dolores (58 km south) and Chamical (146 km northwest) (National Climatic Data Center, 2020) (Figure 2).
La Patria plot (1.9 ha) is a community of L. divaricata shrubs, with a history of intense grazing before closure in 2015. Los Medanitos plot (2.1 ha) is a community of P. flexuosa trees with a history of moderate wood extraction. Despite closures, plots were grazed by sheep in low intensities during May of each year between 2017 and 2020. In both plots soils are poorly developed and are classified as sandy loam Typic Torriorthents.
In each plot, five individuals of P. flexuosa (Pf) and five of L. divaricata (Ld) were selected on the condition that they were isolated forming fertility islands. This way transects could be extended from the centre of the island towards the intercanopy. The transects had a length of two times the canopy radius.
Several biophysical variables were measured under the canopy (UC), at the limit of the canopy (LC) and in the intercanopy (IC), located along a transect heading north. Soil infiltrability, microtopography and soil bulk density were measured once during winter. In contrast, soil gravimetric moisture, soil temperature, air temperature, air moisture, light, and plant frequencies were measured twice in 2019, on the winter solstice (dry and temperate season) and on the summer solstice (wet and warm season).
Soil sampling and measurement
The single-ring infiltrability method was applied (Sepúlveda, 1999; Godagnone, Irurtia, Holzmann and Cuenca, 2012), using a steel cylinder of 0.21 m in diameter, 0.12 m long and 0.0032 m thick. This ring was installed in the soil at a 0.06 m depth without removing the litter. Hydraulic loads of 0.015 m were applied in the ring, measuring the draining time, repeating the procedure until basic infiltration (bl) was reached.
Once finished, the ring was retired, and the lateral water movement radius (r e ) was measured (Votrubova et al., 2017) defining an outer paraboloid. An inner paraboloid was defined by the cylinder radius (r). The difference between the volumes of both paraboloids (1) represented the water volume lost by the lateral movement. The ratio between this volume (AV) and the volume of the inner paraboloid represented a fraction that served to correct the infiltration rates.
The basic infiltration rates were calculated as the average value of the data in the asymptotic sector of the curve not exceeding 20 % of the standard deviation.
The microtopography (mT) was determined by measuring the height difference between the central point of each fertility island and each sampling point (UC, LC and IC) along the transect, by using a rule level.
For soil bulk density (BD), soil samples were extracted superficially from each sampling site with a 0.07 x 0.07 m Kopecky cylinder. In the laboratory, hey were oven-dried and weighted (Yolcubal, Brusseau, Artiola, Wierenga and Wilson, 2004).
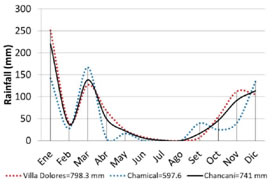
Figure 2: Monthly pondérate average precipitation diagram for the study area (black line) based on data from Villa Dolores (red dashed line) and Chamical (blue dashed line)
For soil gravimetric moisture (sM%), soil samples were obtained superficially (0-0.05 m). They were weighed before and after being dried at 60 °C in a forced-air chamber for three days until constant weight.
The soil temperature (sT°) was determined with a soil thermometer (TFA 19.1006, Germany) nailed at a 0.05 m depth. Since soil temperature drastically changed during the sampling, time was recorded in order to normalise the data.
Microclimate characterisation
The air temperature (aT°) and air moisture (aM%) were measured at the soil level with a digital thermo-hygrometer (UNI-T UT333S, China). Light intensity (L) was recorded at the soil level with a digital lux meter (UNI-T UT383, Hong Kong). During both winter and summer survey times, the sky was cloudless. For all determinations, time was also recorded for data normalisation.
Plant survey
The Point Quadrat method (Passera, Dalmasso and Borsetto, 1986) was applied, surveying litter and plant cover. Litter cover (Lit) was calculated by dividing the sum of contacts of litter in the soil by the total points along the transect. In contrast, understorey plant cover was calculated with the contact of herbs, grasses, or woody plants in the under or intercanopy areas. Bare soil frequency was calculated as 100 % - soil cover percentage.
Plants under the canopy were ¡dentified obtaining their frequencies by calculating the specific contribution by contact (SCC) using a 1.5 m long by 0.003 m wide needle. SCC is the quotient between the number of contacts of each species (C) and the sum of the contacts of every surveyed species along a transect (bare soil was not accounted) (2). The points along each transect of variable length were taken every 0.20 m.
The understorey species were grouped into three categories according to Dyksterhuis classification (1949): decreasers, ¡ncreasers and invaders. Decreasers reduce their frequencies with grazing intensity; increasers heighten their frequencies with the reduction of the decreasers' competition, but their frequency may decline if grazing continues after the disappearance of the decreasers; invaders are all the ungrazed or unbrowsed species, represented by annuals and woody species. The SCC for each species were summed according to the category, obtaining the plant frequencies per category.
Statistical analysis
Kruskal Wallis non-parametrical ANOVA tests were applied comparing treatments (UC, LC, IC). The tests were partitioned either by nurse species (P flexuosa and L. divaricata) or season (winter and summer). Litter cover and plant frequencies were compared by splitting the transect data in two: under-canopy (UC) and intercanopy (IC).
Pearson's linear correlations and Spearman's non-parametric correlations were obtained between the variables, comparing islands or seasons. Multiple linear regressions were made between plant frequencies and the measured biophysical variables by applying the method of least squares. Data were simulated according to the following model:
where SSEJs the error sum of squares in a reduced model (with p parameters including all the terms of the complete model but the term of the line in which the Cp is reported), MSE is the mean squared error of the complete model, and n is the number of observations.
For all the analysis, the statistical software InfoStat was used (Di Rienzo et al., 2019). Correlation plots were obtained using the ggplot2 package for R (Wickham et al., 2016).
Soil and air temperature, air moisture and light were normalised according to the sampling time. The data of each variable were correlated with time, and an adjusted function was obtained. The normalised data is the result of the subtraction of each datum respect to each function value at each moment.
RESULTS AND DISCUSSION
The basic infiltraron rates (Figure 3) showed significant statistical differences both in the P flexuosa and L. divaricata islands, decreasing towards the intercanopy. Nevertheless, differences were more remarkable in the L. divaricata islands (H=16.13; P=0.0003) than in the P flexuosa islands (H=7.04; P=0.0295).
Microtopography and soil bulk density only differed significantly (a=0.05) under-canopy of L. divaricata compared to the limit and the intercanopy. P flexuosa islands showed no statistically significant differences between treatments (Figure 4, a-b). Therefore, basic infiltration was only significantly correlated (a=0.05) to microtopography and soil bulk density in L. divaricata islands by using Pearson's lineal correlations. In P. flexuosa islands, these relations were not statistically significant (Figure 5, a-b). However, Spearman's correlations evidence a significative (P=0.01) monotonous (non- lineal) relation in P. flexuosa with a basic infiltration/ bulk density correlation coefficient (Sr) of -0.46.
Changes in microtopography, infiltrability and soil bulk density along the transects in L. divaricata islands may be due to the formation of pedestals at the foot of the nurse plants, and a combination of the effects of dense rooting of the spikemoss (Selaginella spp.) and tunnelling by animals like Ctenomys spp. Despite the fact that spikemoss cover was superior under the canopy of L. divaricata with respect to the intercanopy, differences were not statistically significant (winter: UC=19.78 %, IC=5.00 %, H=0.63, P=0.2562; summer: UC=12.50 %, IC=5.00 %, H=0.14, P=0.5432). Despite visual evidence in three of the L. divaricata islands, Ctenomys effect could not be quantified due to the destructive nature of the measurement methods.
During winter, the soil gravimetric moisture increased both in P. flexuosa and L. divaricata islands towards the intercanopy; however, no significant differences were found. During summer, this effect was reversed (Figure 4, c-d) with significantly higher values under the canopy of P. flexuosa. Soil gravimetric moisture was negatively related with microtopography and positively related with soil bulk density since rainfall water tends to accumulate in gullies (with denser topsoil layers) located in intercanopy areas (Lei, 2008). Nevertheless, the relations were weaker during summer, both with Pearson's (Figure 5, c-d) and Spearman's correlations (soil gravimetric moisture/microtopography: Sr=-0.13, P=0.31; soil gravimetric moisture/bulk density: Sr=0.35, P=0.01). It suggests that during summer soil moisture depends on controls other than soil factors, such as microclimate forcing (Tanga, Erenso and Lemma, 2014).
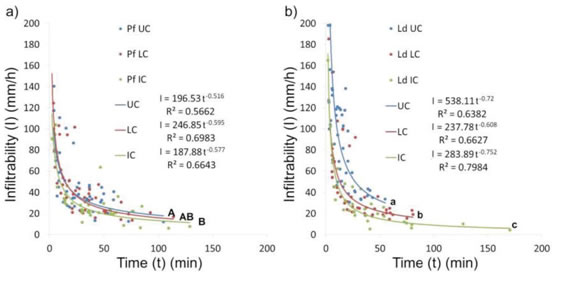
Figure 3: Infiltrability curves for a) P. flexuosa (Pf) and b) L. divaricata (Ld) fertility islands. UC: under-canopy; LC: canopy limit; IC: intercanopy. Different letters indicate statistically significant differences for basic infiltration (Kruskal-Wallis test, a=0.05)
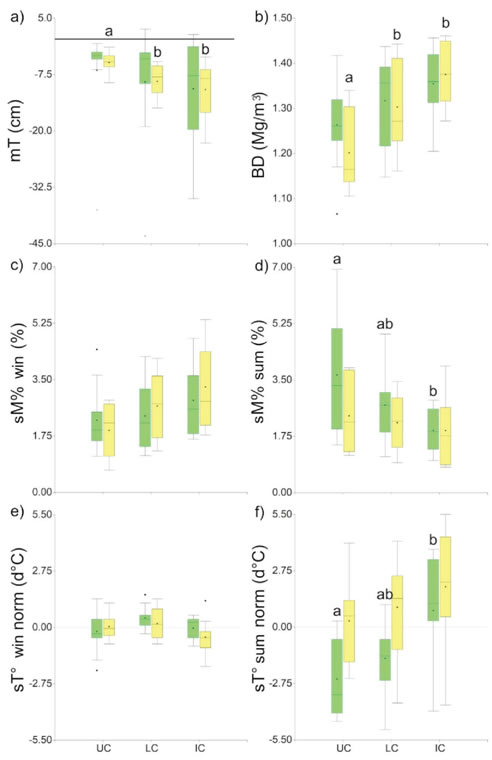
Figure 4: Box-plots of the soil variables: a) Microtopography (the line marks the base line) (mT); b) soil bulk density (BD); c-d) gravimetric
moisture (sM%); e-f) normalized soil temperature (sT° norm). UC: under-canopy; LC: canopy limit; IC: intercanopy. Green bars: P. flexuosa
islands; yellow bars: L. divaricata islands. win: Winter solstice survey. sum: Summer solstice survey. Different letters indicate statistically
significant differences (Kruskal-Wallis test, α=0.05).
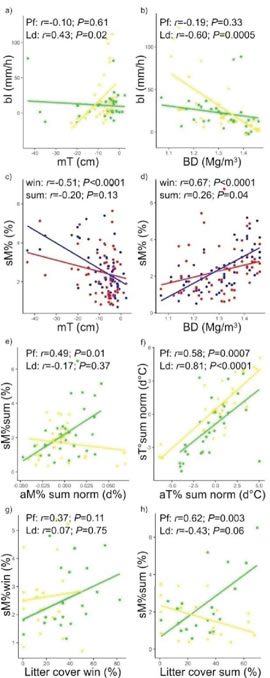
Figure 5: Pearson’s correlation plots: a) Basic infiltration (bl) - microtopography (mT); b) basic infiltration - soil bulk density (BD); c) soil gravimetric moisture (sM%) - microtopography; d) soil gravimetric moisture - soil bulk density; e) soil gravimetric moisture - normalised air moisture (aM%norm) in summer (sum); f) normalised soil temperature (sT°norm) - normalised air temperature (aT°norm) in summer; soil gravimetric moisture - litter cover (Lit) in g) winter (win) and h) summer (sum). a), b), e), f), g), h) Comparing fertility islands; in green: P flexuosa islands (Pf); in yellow: L. divaricata islands (Ld). c), d) Comparing seasons; in blue: winter (win); in red: summer (sum).
Soil temperature was indifferent to treatments during winter in both island categories. However, it differed significantly during summer in P flexuosa islands, increasing towards the intercanopy (Figure 4, e-f).
Both soil gravimetric moisture and soil temperature were significantly affected by the canopy of P flexuosa trees. They have broader and thicker crowns than L. divaricata shrubs (Hierro, Branch, Villarreal and Clark, 2000), and this aspect was reflected in the microclimate factors (air temperature, air moisture, and light) shown in Figure 6. The canopy effect over the microclimate variables was statistically significant during summer, except for light intensity which also differed significantly during winter. On the contrary, L. divaricata canopy did not seem to have any significant effect over the microclimatic factors. Nevertheless, the light intensity under L. divaricata did not differ statistically under-canopy compared to P flexuosa neither during winter (H=1.29; P=0.2568) nor during summer (H=0.69; P=0.4057). Compared to the maximum normalised light intensity, the average light intensity under the canopy of P. flexuosa was 51.66 % and 33.55 % in winter and summer, respectively. In L. divaricata it was 58.74 % and 54.22 %, respectively.
During summer, soil gravimetric moisture was significantly correlated to the normalised air moisture in P. flexuosa islands. In comparison, no significance was observed in L. divaricata islands, neighter with Pearson's (Figure 5e) nor with Spearman's correlations (P=0.98). Soil temperature was correlated to air temperature, but such relation was heightened during summer, both for P. flexuosa and L. divaricata (Figure 5f). Both island categories showed similar function slopes but the intercept was higher in the L. divaricata function. It means that for the same air temperature, P. flexuosa canopy can better temper the soil temperature than L. divaricata.
Under the canopy of P. flexuosa, the air temperature was reduced compared to the intercanopy, affecting the air moisture and the soil temperature, especially during summer. Reduced air and soil temperature, and increased air moisture might reduce soil water evaporation (Raz-Yaseef, Yakir, Schiller and Cohen, 2012). The resulting soil moisture values doubled those in the intercanopy, despite the extremely low measured values, near the permanent wilting point. Similar but more moderate effects were found under Prosopis velutina Wooton trees in the deserts of Arizona (Schade, Sponseller, Collins and Stiles, 2003) with comparable rainfall and more temperate climate.
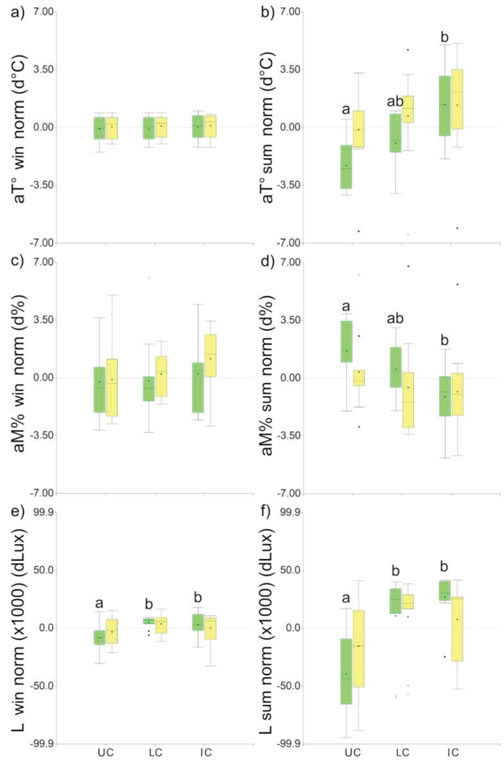
Figure 6: Box-plots of the microclimate variables: a-b) Normalised air temperature (aT°norm); c-d) normalised air moisture (aM%norm); e-f) normalised light intensity (L norm). UC: under-canopy; LC: canopy limit; IC: intercanopy. Green bars: P. flexuosa islands; yellow bars: L. divaricata islands. win: Winter solstice survey. sum: Summer solstice survey. Different letters indicate statistically significant differences (Kruskal-Wallis test, α=0.05).
Regarding litter cover, it did not differ significantly between treatments either in P flexuosa islands (winter: H=1.4x10⁻³, P=0.9698; summer: H=1.20, P=0.2727), nor in L. divaricata islands (winter: H=1.29, P=0.2529; summer: H=0.52, P=0.4686). Although during summer, significant positive correlations were found between soil gravimetric moisture and litter cover in P flexuosa islands, while this correlation was negative and marginally significant (a=0.05) in L. divaricata islands. No significant correlations were observed during winter with Pearson's correlations (Figure 5, g-h); however there was a positive non-parametric relation in P flexuosa islands during this season (Sr=0.48, P=0.03). Magliano et al. (2017) suggest that the canopy of P. flexuosa trees plus the litter accumulated under its canopy, in Arid Chaco forests, can be more efficient than canopy alone, reducing soil moisture evaporation.
Compared to P. flexuosa, L. divaricata crown density seems to be reduced, having no significant effect over soil and air moisture and temperature or light intensity. Kropfl, Cecchi, Villasuso and Distel (2002) suggest that rainfall interception by L. divaricata shrubs in the Monte Region (Argentina), especially during the cool season, reduces soil moisture under-canopy. This effect might be compensated during the warm season by a reduction of the soil water evaporation under- canopy. Magliano et al. (2019) suggest that the interception in L. divaricata is poor compared with other woody species, of about 9.4 % of the total rainfall. In our study, some interception effect might occur in both L. divaricata and P. flexuosa under- canopy conditions; nevertheless, this effect should be greater in the latter, with a denser canopy, but it is not the case. All these relationships suggest a multi-causal effect; no evident canopy effects seem to occur on soil moisture in L. divaricata islands, and microtopography seems to be stronger than litter regulating water dynamics.
No differences were found in plant cover understorey between treatments or seasons, either in P. flexuosa nor in L. divaricata islands. Nevertheless, plant cover was always higher under-canopy (P flexuosa, winter: UC=48.64 %, IC=30.67 %, H=2.29, P=0.1306; summer:
UC=43.10 %, IC=32.04 %, H=1.20, P=0.2727. L. divaricata, winter: UC=46.33 %, IC=40.93 %, H=0.37, P=0.4547; summer: UC=36.03 %,
IC=28.76 %, H=0.21, P=0.6492). Bare soil was more frequent in L. divaricata than P. flexuosa under-canopy, with a marginally significant difference (16.93 vs 35.53 % respectively; H=3.43; P=0.0635).
Regarding Dyksterhuis (1949) categories, decreasers showed significantly higher frequencies under P. flexuosa canopy (a=0.05), while increasers showed higher frequencies in the intercanopy (a=0.1). In L. divaricata islands, there were no significant differences between treatments (Figure 7).
The frequencies of each plant category depended on multiple variables. Nonetheless, as happens in most arid and semi-arid regions, water is the main limiting factor. Despite their low contents, soil moisture seems to be the leading cause explaining the frequencies of understorey plants in the studied plots (Table 1). Decreasers were positively related to soil moisture and soil temperature, and negatively related to air temperature, air moisture and light i ntensity. Increasers were positively related to soil moisture, air temperature and light intensity, and negatively related to soil temperature and air moisture. Invaders were positively related to all five variables. The low-intensity grazing during May could also have had some effect over plant frequencies. In spite of this, in neither selected fertility island the animal circulation was restricted, indicating that animal access was not an issue that could affect plant frequencies differently in each treatment, especially in P. flexuosa islands where differences between treatments are significant (Figure 7). On the contrary, shade should be an attraction for animals favouring the permanence of the animals (and consumption) under the canopy, but it seems not to be the case here.
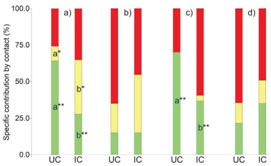
Figure 7: Specific contribution by contact: a) Winter, P. flexuosa islands; b) winter, L. divaricata islands; c) summer, P. flexuosa islands, d) summer, L. divaricata islands. Green: decreasers; yellow: increasers; red: invaders. Different letters indicate significative statistical differences (Kruskal-Wallis test, **α=0.05, *α=0.1).
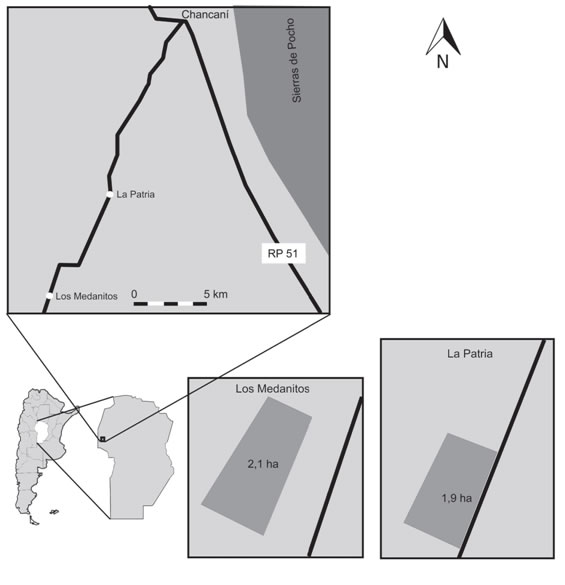
Table 1: Múltiple linear regressions parameters between plant frequencies and soil moisture (sM%), normalised soil temperature (sT° norm), normalised air temperature (aT° norm), normalised air moisture (aM% norm), normalised light intensity (L norm). VIF: Variance Inflation Factor Decreasers. n= 80; R2= 0.45; P<0.0001.
Water dynamics usually affect plant performance in arid and semi-arid lands. Nevertheless, such performance might depend on Liebig's Law of the Minimum and Shelford's Law of Tolerance (Kust, Andreeva and Cowie, 2017). Dohn et al. (2013) suggest that both tropical and temperate savannas shift from facilitative to competitive interactions as annual rainfall increases. This shift may occur at an average annual rainfall of 685 mm in mesic savannas (BSh in the Koppen classification; Beck et al., 2018). With low precipitation regimes, the canopy effect might help conserve soil moisture. Dohn et al. (2013) also suggest that when water is not limiting, light intensities below 15 % with respect to the maximum over the canopy should affect understorey grasses. Light reduction in this study was moderate, with summer values below the cited light threshold in only 40 % and 20 % of the cases, under the canopies of P flexuosa and L. divaricata, respectively. No cases below 15 % were observed during winter. Decreasers had higher frequencies under the canopy of P. flexuosa, suggesting either that light is not limiting or that decreasers respond well under such reduced light intensities. These species produce more palatable biomass than increasers (Díaz, 2007); therefore, the promotion of the covered areas with P flexuosa might prove beneficial for grass quality. However, according to Díaz (2003), tree covers above 40 % reduce total forage production.
CONCLUSIONS
Our findings suggest different effects on soil and microclimate when comparing the effect of canopies and litter cover of P. flexuosa and L. divaricata. Canopy and litter accumulation of the former tended to conserve soil moisture by reducing soil and air temperature, and increasing air moisture compared to the intercanopy. These relations also favoured the frequency of decreasers, which produce better forage quality. At the same time, total plant cover did not differ significantly from that of the intercanopy. L. divaricata effect over soil, microclimate and plant response was not what was expected in the hypothesis. Despite the increased infiltrability and reduced soil bulk density, these were not sufficient to increase soil moisture. The canopy effect is not as effective as that of P flexuosa, litter seem to have an undefined effect perhaps altered by microtopography, and plant response is not significative concerning the frequency of decreasers.
Therefore, the hypothesis is partially confirmed, recommending the promotion of P flexuosa cover over that of L. divaricata. This promotion might result in increased forage quality and reduced soil degradation. Nevertheless, L. divaricata might result in an interesting transitional plant in sites under recovery, as a transformer species, enhancing soil physical conditions under-canopy.

