


 Inglés (pdf)
 Articulo en XML
 Referencias del artículo
 Enviar articulo por email
 Citado por SciELO
  Similares en
SciELO
Similares en
SciELO 
 Permalink
INTRODUCTION
Cultivated fresh edible banana (Musa acuminata) is a polyploid hybrid that is strictly propagated by asexual cloning (Soto Balleesterios, 2008). As it is a tropical and subtropical crop, the environmental conditions in Argentina are harsh and limit its production (Galán Saúco et al., 2013). Nevertheless, it is cultivated in the North of the country, becoming a relevant alternative crop for familiar farmers in the province of Formosa (Tenaglia et al., 2009). However, and unlike traditional production areas of the world, in this ecological and socioeconomic context only one crop can be produced (Del Medico et al., 2021).
Therefore, although there is a large amount of information available on banana production at the international level, yield evaluation of cultivars known worldwide must be made in the production system of the province of Formosa. It is necessary not only for identifying areas of high potential productivity but also for determining the optimal plot size to assure statistical robustness of field trials (Silveira Viana et al., 2003).
The objectives of this study were to evaluate the yield of four banana varieties grown internationally under the conditions of the province of Formosa over four cycles of production and to determine -on the basis of their performance- the optimal plot size for field assays to become statistically robust.
MATERIALS AND METHODS
International varieties Williams, Grand Naine, GAL, and Jaffa were implanted in the 2015/2016 production cycle at Estación Experimental del Área de Investigación de Agricultura Familiar NEA (AIPAF-NEA) INTA Chaco-Formosa, located at 25,2024130 S, 58.1212980 W (Colque and Tenaglia, 2010). Crop practices were applied following Tenaglia et al. (2009). A completely randomized block design was used (n = 15 blocks with one plant per variety each, total N of plants = 60). Yield data, in kg of fruit per plant, during 4 field campaigns were compared using factorial ANOVA, Varieties, Production Cycles (2016/2017, 2017/2018, 2018/2019 and 2019/2020) and their Interaction as sources of variation. The block within the Production Cycle was also considered as a nested factor and all effects were analyzed as fixed. A GGE biplot with varieties and production Cycles was constructed according to Yan et al. (2000) for visualizing putative interactions between both principal factors affecting banana yield.
To determine the optimal plot size, the maximum curvature method reported in rice by Vargas-Rojas et al. (2014) was applied, with modifications according to the differences in the banana production system. Mean yield values per plant were calculated from the analysis described in the previous paragraph. Then, plants were randomly chosen to form groups of 2, 4, 6, 8, 10, 11, 14, and 16 individuals, i.e. different plot sizes, regardless of the variety factor. Due to the total number of evaluated plants, three groups containing 2 to 10 plants each were formed, while two groups could be formed for plot size among 11 and 16 plants each. Mean values, standard deviation and coefficient of variation of yield were calculated for each plot size, and single linear and non linear regressions were calculated between the three statistical parameters and the different numbers of evaluated plants per group. From these regressions, the optimum plot size in terms of the number of evaluated plants that produces no changes in mean values and the smallest standard deviations and coefficients of variation were determined. For all statistical analyses, Info-Gen Software (Balzarini and Di Rienzo, 2003), developed at the Universidad Nacional de Córdoba, was applied.
RESULTS AND DISCUSSION
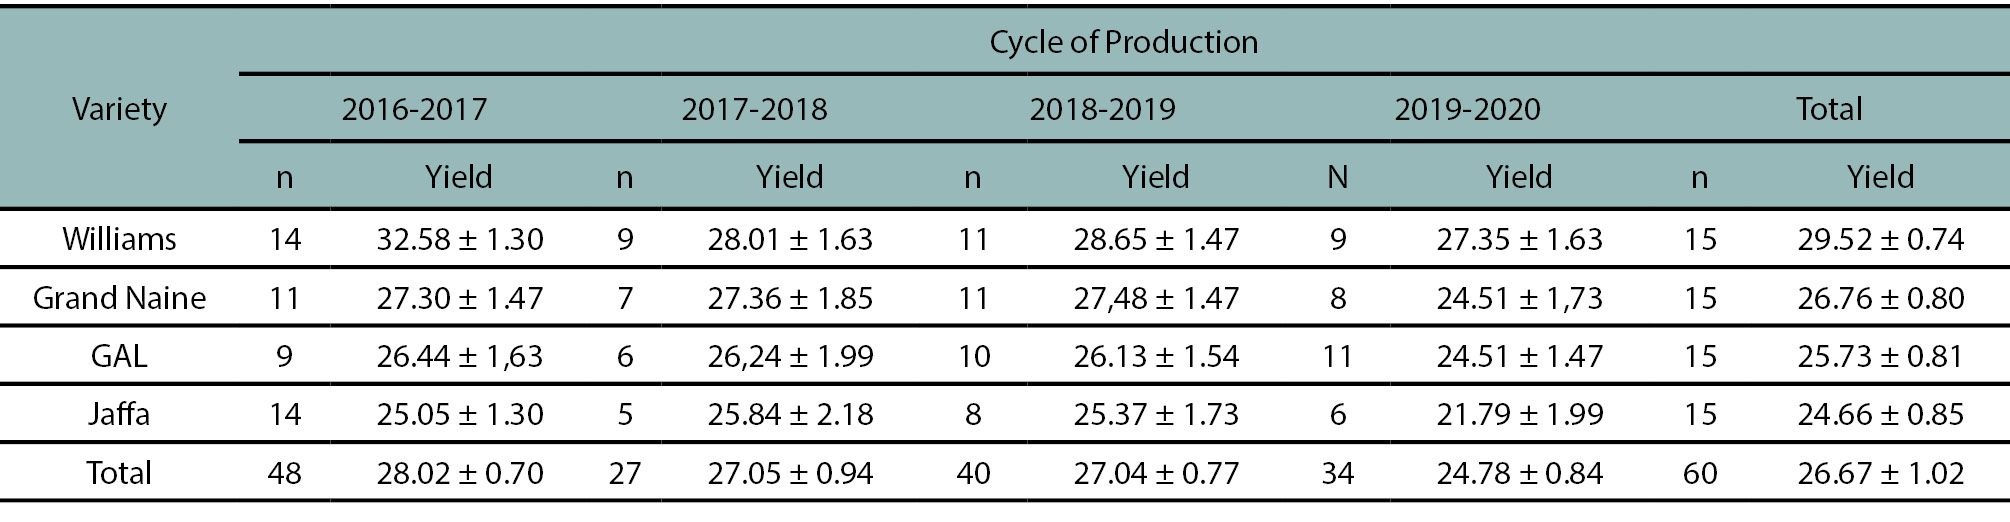
The mean values of varieties per production cycle and total are presented in table 1 and the field trial is illustrated in figure 1. The different number (as indicated by n columns in table 1) of evaluated plants per production cycle is due to the effect of the harsh environment of the province of Formosa for banana production. Highly significant differences were found among varieties (F = 6.43, p = 0.0002) and significant differences were found among production cycles (F = 2.79, p = 0.0311) while no significant effects were detected neither for blocks within production cycle (F = 1.01, p = 0.1023) nor for the interaction varieties x production cycle (F = 0.48, p = 0.8547).
The Williams variety had the highest yields over all campaigns and the Jaffa variety showed the opposite performance. Both Grand Naine and GAL varieties had intermediate values and were in general more stable than Williams and Jaffa varieties. These results partially disagree with those reported by Galán Saúco et al. (1995) testing some of these varieties in the subtropical environment of the Canary Islands, Spain. Then, the discrepancies among reports could be due to differences in mega-environments and/or in production systems management. Otherwise, the present results indicate that the environment of the province of Formosa would have a high yield potential, although it varies between years and depends on the varieties. Another interesting finding is the non-significant effects of blocks within years, which indicates that no correction due to augmented design must be made to yield data measured on clones collected at farmers field when analyzing local genotypic variability.

Though no statistically significant interaction was detected, the GGE biplot is shown in figure 2.

Figure 2.Biplot for the Variety by Cycle of production Interaction for banana production from data registered in the presently reported assay.
The first Principal Component (PC1) explained a high percentage of total variability (79.4%) and allowed the differentiation of varieties according to their average performance. Williams, the genotype with the highest average yield, was positioned in the negative PC1 values while Jaffa, having the lowest average yields, was located in its positive values. Otherwise, cycles of evaluation were appropriately discriminated by the second Principal Component (PC2, as the best cycle 2016/2017 was allocated on its negative values, close to Williams variety, while the worse cycle 2019/2020 was positioned in its positive values while far away from Jaffa) that explained the 19.8% of total variation. Hence, a high proportion of total variation of dataset (99.2%) is explained in the GGE biplot, which suggests a predictable performance of varieties in Formosa, as indicated by the lack of statistical significance of the interaction effect. It is interesting to note that the varieties and the production cycles that had a low contribution to total variability i.e., whose mean yield values were intermediate (Grand Naine and GAL genotypes, and 2017/2018 and 2018/2019 campaigns) were positioned near to the zero values of PC1 and PC2, respectively, which is expected according to the GGE Biplot algorithms (Yan et al., 2000).
As regards the determination of optimal plot size, the relationships of mean yield values, standard deviations, and coefficients of variation with the number of evaluated plants per group are presented in figures 3, 4, and 5, respectively. The lack of significant effects for both the block within the production cycle and the interaction variety x cycle of production detected in ANOVA statistically supports the computation of mean values for each plant in the analyzed dataset. Mean yield values were similar among plot size (figure 3).
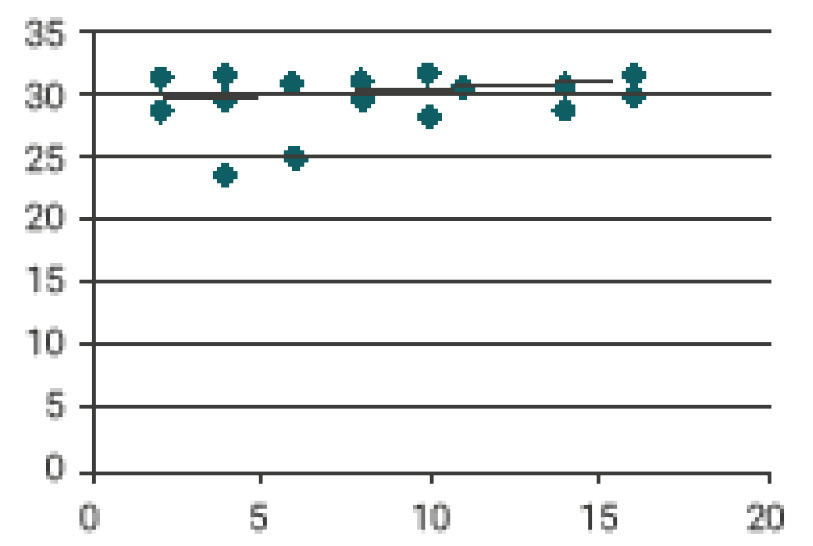
Figure 3.Relationship between the mean yield (in kg) per plant (vertical axis) and the plot size (in number of evaluated plants per size, horizontal axis).

Figure 4.Relationship between the standard deviation for yield (in kg) per plant (vertical axis) and the plot size (in number of evaluated plants per size, horizontal axis).

Figure 5.Relationship between the variation coefficient (in percentage) per plant (vertical axis) and the plot size (in number of evaluated plants per size, horizontal axis).
Indeed, both linear and non linear regression were significant between these variables (p > 0.05), indicating that the number of evaluated plants would not greatly affect the measured yield. In contrast, yield standard deviations (figure 4) and coefficients of variations (figure 5) decreased as the number of individuals evaluated per group increased, tending to stabilize at a plot size of 6-8 plants. In fact, both linear and non linear regressions were significant (p < 0.05), and the curves tended to the inverse function. In general terms, these tendencies agree with those reported in rice by Vargas-Rojas et al. (2014) and in yucca by Silveira Viana et al. (2003).
All these reports pointed out the suitability of the Maximum Curvature Methods to determine the optimum plot size in different production systems. However, and because none of all plants are capable of producing fruits each year as mentioned above and shown by the n columns in table 1, the optimum size proposed for banana field trials in Formosa province is 10 plants per plot.
CONCLUSIONS
1. The varieties presenting the greatest yield were Williams and Grand Naine along for years of evaluation under northeastern Formosa Province environment.
2. The most adequate size for field trials in this environment is 10 plants per plot.
3. The northeastern environment of the province of Formosa has a great potential and production, although it varies according to years and varieties.

