


 Inglés (pdf)
 Articulo en XML
 Referencias del artículo
 Enviar articulo por email
 Citado por SciELO
  Similares en
SciELO
Similares en
SciELO 
 Permalink
1- INTRODUCTION
The Delayed Hydride Cracking phenomena (DHC), is a fracture mechanism which occurs in materials where hydrides are formed, as is the case of zirconium and its alloys. In the particular case of Zr-2.5Nb, which is used in the manufacture of the pressure tubes of CANDU type nuclear power plants, DHC can lead to the catastrophic rupture of the component. Hydrogen can be present as a remnant impurity of the manufacturing process or enter in the alloy during the material service life. It is very important to evaluate the alloy properties with the hydrogen concentration. The DHC phenomena1 depends on the microstructure, the hydrogen solubility and the hydrogen diffusion. For example, Zr-2.5Nb is a bi-phasic alloy with grains in the  phase (hcp, with 0.6 % Nb) surrounded by plates in the
  -Zr phase (bcc, with 20 % Nb). During thermal treatments, TT, the original plates of -Zr lose continuity and the fast H-diffusion paths are interrupted while their Nb concentration changes.2 Here we have studied the hydrogen’s terminal solid solubility (TSS) for an intermediate temperature between the two thermal treatments performed by Parodi et al.3 on Zr-2.5Nb. With this purpose we have submitted the samples to ageing, gaseous hydride charge and a homogenization thermal treatment; and characterized the microstructure and hydride structure by optical microscopy, scanning electron microscopy and X-rays. In order to obtain the hydrogen’s TSS we have determined the hydride’s dissolution
  and precipitation
  temperatures. The hydrogen Terminal Solid Solubility for Dissolution (TSSD) and Precipitation (TSSP) curves were measured by Differential Scanning Calorimetry (DSC). The present paper is structured as follows: Section 2 describes the hysteresis effect on the hydrogen solubility. Sections 3 and 4-6, are devoted to summarize the material and the experimental treatments performed on the samples, respectively. Section 7 summarizes our experimental results. The last section presents some conclusions.
2- HYDROGEN SOLUBILITY IN Zr BASED ALLOYS
Zirconium and its alloys show an important hysteresis between terminal solid solubility of hydrogen during heating or dissolution (TSSD) and cooling or precipitation (TSSP). This behavior has been ascribed to plastic deformation produced in a -Zr matrix during hydride precipitation1,2 by the misfit between matrix and hydride. In two-phase Zr-2.5Nb alloy, TSS curves depend on the fraction and composition of both, -Zr and  -Zr phases and also on thermal cycles.1
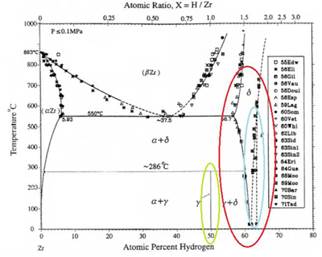
Fig. 1 shows the Zr-H system phase equilibrium diagram4 and the hydride compositions in Zr.
-Zr phases and also on thermal cycles.1
Fig. 1 shows the Zr-H system phase equilibrium diagram4 and the hydride compositions in Zr.
The Terminal Solid Solubility (TSS) is defined as the maximal hydrogen concentration in solution without forming hydrides.5 As shown in Fig. 2,5 the TSS curve for hydrogen dissolution vs. temperature presents the hysteresis phenomenon for the heating and cooling processes. As the temperature increases, the hydrogen concentration,  , in
, in  -Zr increases following the TSSD dissolution curve along the segment AB. When the temperature decreases, BC,
 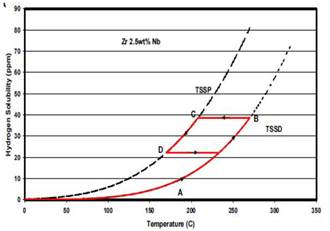 does not change until the TSSP curve is reached (C point). When the temperature decreases,
  decreases, segment CD.
  does not change until the TSSD curve is reached. The hysteresis has been ascribed to plastic deformation produced in
 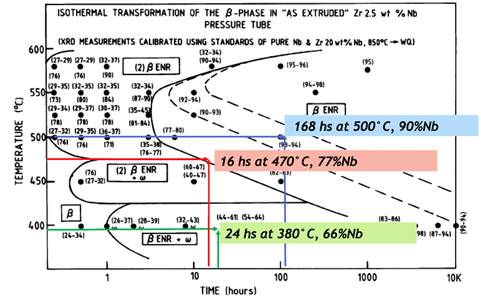 -Zr matrix during hydride precipitation6,7 by the misfit between matrix and hydride. In two-phase Zr alloys, TSS curves depend on the fraction and composition of
  and
and  phases1,2 and also on thermal cycles.8 The TSSD and TSSP curves are obtained from the differential scanning calorimetry technique, DSC, which allows to determine the hydride’s dissolution
  and precipitation
  temperatures.
  has only one value, while
  depends in general on the maximum temperature to which the sample was previously heated, the time at which that temperature is holding and the cooling speed.7
3- MATERIAL AND Zr-2.5Nb SAMPLES
Zr2.5Nb samples come from a section of an extruded and cold worked pressure tube, autoclaved at 400°C for 24 h, with approximate size of  mm3. These samples were prepared by an ageing thermal treatment, hydrogen charge and a homogenization treatment as described below. Table 1 summarizes the chemical composition of the samples.
The hydrogen TSS on samples of Zr-2.5Nb have been previously studied by Parodi et al..3 They have performed two thermal treatments, TT, namely: (i) 168 hours at 500°C and (ii) 24 hours at 380°C. These TT have resulted in the ageing of the  -Zr phase and in the increase of the Nb concentration up to 93% and 59%, respectively. We have here studied an intermediate TT between the two carried out in the work of Parodi3 obtaining then a Nb concentration of 77% in the
  -Zr phase.
Fig. 3 shows the Time-Temperature transformation diagram of Zr-2.5 Nb.9 The samples of 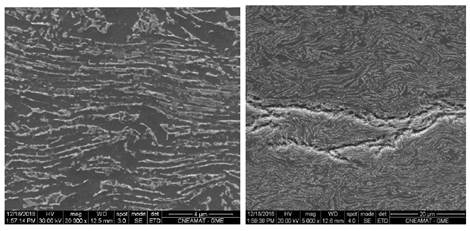 mm3, were treated at 470°C for 10 h in vacuum to decompose the
  -Zr phase in order to produce a variation in the Nb concentration. After the ageing TT, the samples were polished to eliminate the superficial defects, and cleaned with trichlorethylene to remove all possible dirt on the sample surface. Afterwards, an electrolytic oxide film deposition with a 4% SO4H2 solution was performed. The oxide film was then removed with a 600-grit silicon carbide paper, except on the edges of the surface. This anodizing process was carried out with the purpose of allowing the hydrogen enters into the sample during the gaseous charge only through the oxide free surfaces. Then, hydrogen diffuses homogeneously throughout the thickness of the sample. The process is shown in Fig. 4. Finally, the samples were submitted to a gaseous hydrogen charge procedure. Hydrogen is incorporated into the sample using the SIEVERT equipment in the Fig. 5. The charging temperature was set at 350°C so that the oxide layer is not removed.
The amount of hydrogen moles, n, which enters into the sample was calculated with the ideal gas equation, 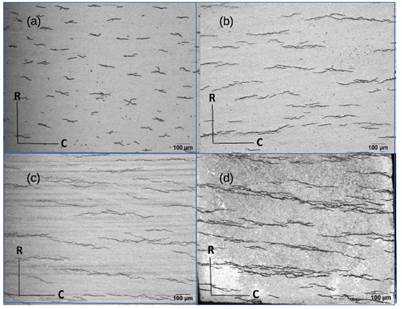 , by measuring the difference between the initial and final pressure, P, and the room temperature, T, V is the chamber volume and R the ideal gas constant.

TABLE 2: The total H concentration on samples, , with  the initial hydrogen concentration and the incorporated amount,
  .
.
After the gaseous charge the hydrogen remains mostly on the sample surface. Since, it has no time enough to diffuse homogeneously a hydride gradient was generated through the sample thickness. Then, we perform a final TT at 470°C - 6 h for hydrogen homogenization. The maximum temperature reached and the duration of the treatment are factors that deserves some cares due to their importance regarding the transformation of the  -Zr phase during the ageing treatment.
4. SAMPLES CHARACTERIZATION
In order to characterize the microstructure and hydride distribution the samples were observed by Optical Microscopy (OM) and Scanning Electron Microscopy (SEM). The microstructure was reveal by etching in a solution of 45 ml of nitric acid, 45 ml of distilled water and 6 ml of hydrofluoric acid, while a solution of 45 ml of nitric acid, 45 ml of lactic acid and 7 ml of hydrofluoric acid, to reveal the hydride particles. For a sample with 85 ppm of H, Figs. 6 and 7 show the micrograph obtained by SEM, on the Circumferential-Radial plane (CR) and on the Axial-Radial plane (AR), respectively. The presence of dark and light grey phases, correspond respectively to 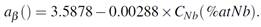 - and
- and  -Zr.
-Zr.
FIG. 6: (a) Left: SEM of the CR plane (see Fig. 4) of a sample with 85 ppm of H. (b) Right: The presence of hydride is emphasized.
Fig. 8, shows the orientation and morphology of the hydrides precipitated on the CR plane of the pressure tube. In all cases, the hydrides form plates whose orientation is perpendicular to the radial direction. These so-called "circumferential" hydrides are oriented according to the crystalline texture and residual stresses of the tube. We have observed that, hydrides quantity and length increase with the hydrogen concentration.
5- X-RAY DIFFRACTION
X-ray diffraction tests were performed with a conventional diffractometer from the position  to
to  ; with a step of
  and 33 seconds per time step, and Cu radiation. These initial parameters were used in order to observe the peak corresponding to the reflection on the (110) plane of the
  phase. The degree of
  -Zr phase transformation was evaluated through its Nb concentration by using Eq. (1), which correlates %at Nb with the lattice parameter
  of the
  -Zr phase10
(1)
6- DIFFERENTIAL SCANNING CALORIMETRY
Differential Scanning Calorimetry (DSC) measurements were performed to obtain the hydride’s dissolution, 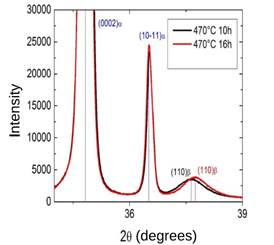 , and precipitation,
  , temperatures. The terminal solid solubility curves (TSSD/TSSP) are determined from
  and
and  using the maximum slope temperature (MST)3 criteria and the total hydrogen concentration. Before DSC measurements samples of approximately
  mm, were cleaned in ultrasonic bath containing acetone. All experiments were performed with an empty crucible as reference, under an Ar (99.9997%) dynamic atmosphere of 25 ml/min. The equipment was calibrated using the melting point of In, Sn, Al, Fe elements. Each cycle consisted of a heating up to a maximum temperature (
 ), hold time at this temperature and cooling to a minimum temperature. Two runs were performed at
  C and two others at
  C in order to analyse the effect of the maximum temperature on
  and to obtain TSSP2 and TSSP1, respectively. In these cycles, hold times at maximum temperatures were 10 min, with heating and cooling rates of 10°C/min. Dissolution and precipitation temperatures result from the average of the values obtained after each
  .
.
7- EXPERIMENTAL RESULTS
X-Ray diffraction
Zr-2.5Nb X-ray diffraction patterns for two TT are shown in Fig. 9. The position of the (110)- and (0002)- and
  peaks, are also presented.
In Table 3 we summarize the values of  parameter and Nb concentration of the
  -Zr phase according to the according to the thermal treatment performed.


Thermal solid solubility curves (TSS)
Table 4 shows the results obtained from the heating and cooling calorimetry curves. It lists the total hydrogen concentration  (in weight ppm), the dissolution temperatures
  for both,
  and
and  , hydrides and the precipitation temperature for delta hydrides
  with different maximum temperatures. The first heating cycle corresponds to the dissolution of hydrides precipitated during cooling carried out after the homogenization treatment. In this cycle, samples with 85 and data 118 ppm of H present two dissolution peaks, one of
  -hydrides and another of
  -hydrides. For 58 ppm the sensitivity of DSC could not be enough to detect the minority phase. Regarding the sample wit 138 ppm the
  -hydride was not detected either; in Ref.11 was observed that the precipitation of the
  -hydride decreases as the hydrogen concentration increases. The
  -hydrides were no detected during the subsequent DSC cycles of heating and cooling with a rate of 10°C/min. This may be due to the fact that the
  -hydride precipitates by a peritectoid transformation, as reported in Ref.,11,12 thus a cooling rate lower than 10°C/min is required. Hydrogen Terminal Solid Solubility for Dissolution (TSSD) and Precipitation (TSSP) curves were calculated by fitting the hydrogen concentration
  versus
  of
of  -hydrides reported in Table 4, according to the Arrhenius equation (2),
(2)
Where  is the pre-exponential factor,
  , are the transformation hydrides enthalpy for dissolution or precipitation respectively, and R is the gas constant.
  and
and  varies according to the alloy and the hydride phase. So, three equations can be obtained, for dissolution (3) and for precipitation (4), where i=1 corresponds to
  C and
C and  .
.
(3)
(4)
The enthalpy of dissolution,  , and precipitation,
 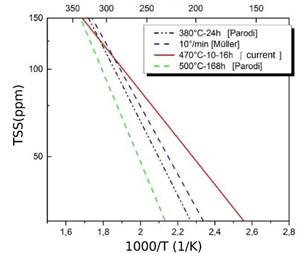 , are expressed as,
(5)
(6)
In Eqs. (5) and (6), 𝑄 𝑞 is the chemical energy, 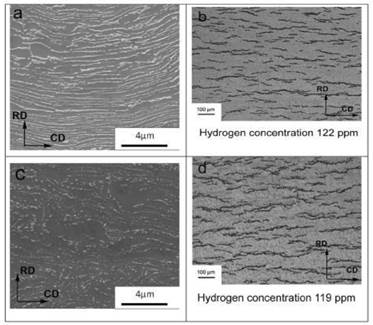 and
and  the elastic and plastic energies associated with the mismatch between hydride and matrix (due to the difference in specific volume between both phases), and
  the interaction energy with the stresses in the environment of the hydride (such as residual stresses, applied external stresses and stresses between the microplates). The term
  implies that the plastic deformation produced during hydride precipitation is recovered, which depends on the temperature attained during heating. Fig. 10 displays the experimental data reported in Table 4 and the TSSD, TSSP1 and TSSP2 curves. For samples with 58 and 138 ppm of H, no precipitation signal was detected during the cooling cycle from
  , so the TSSP2 curve could not be obtained with more data. Table 5 shows the adjustment parameters for each curve with and without considering the hydrogen concentration of 58 ppm.
TABLE 4: The precipitation and dissolution temperatures, ,  for different H concentrations at a heating/cooling rate of 10°C/min.
FIG. 10: Hydrogen concentration and dissolution/precipitation temperatures reported in Table 4. The fitting lines were obtained with the Arrhenius equation (2).
FIG. 11: Comparison of the TSSD -hhydride results measured in this work and those reported in ref 3, with thermal treatments at three different temperatures.
Fig. 11 includes TSSD results of this work together with those measured by Parodi et al.,3 with different thermal treatments. In Ref.,3 the samples with 93.1 % at Nb in -phase (treated at 500°C - 168 h) showed a lower TSS than the samples with 66.1 % at of Nb (treated at 380°C - 24 h). It was expected that the material treated at 470°C with 76.3% Nb in -phase would have an intermediate solubility between the two treatments evaluated by Parodi since the beta phase contains an intermediate percentage of Nb. Nevertheless, its TSSD is higher as shown in Fig. 11. On the other hand, Müller13 used the material treated at 380°C - 24 h and measured the solubility after a quenching treatment and thermal cycling with heating / cooling rates of 10°C/min. He have found that, although the phase has the same ageing before and after quenching, the solubility of hydrogen is affected by the different distribution of hydrides, this result was interpreted by means of the Eqs. (5) and (6). The quenching treatment promotes a finer hydride distribution, which means that they retain greater elastic deformation, thus reducing the value of Q and increasing the TSSD and TSSP. Figs. 12 and 13 show our TSSD, TSSP1 fitted curves with cooling of 10°C/min and those obtained by Müller13 and Parodi.3
Fig. 14(a) and (b), show the microstructure and hydride distribution for respectively 119 and 122 ppm of H in samples of Parodi3 for TT at 380°C - 24 h and 500°C - 168 h. The continuity of the phase treated at 470°C in this paper (Fig. 6(a)) is similar to that of the material treated at 380°C, while at 500°C the phase is remarkably spheroidized. Thus the increment in TSS observed in the samples treated at 470°C could not be attributed to the phase ageing. On the other hand, the hydride distribution observed in the samples of Parodi3 is similar to that obtained in the sample with 119 ppm used in this work (Fig. 14(c)). So the unexpected higher TSS obtained with the TT at 470°C cannot be explained nor by the beta phase ageing neither by hydride distribution as it is observed by optical microscopy.
FIG. 14: Microstructure and hydride distribution of Zr-2.5Nb with (a)-(b) 122 ppm of H and (c)-(d) 119 ppm of H, respectively in Ref..3
In Zirconium pressure tubes, hydride precipitates observed with low magnification are usually depicted like plates resting on the circumferential - axial plane, the so called circumferential hydrides. But, electron microscopy studies reveal that these plates are compose of stacks of smaller particles with habit plane close to the -Zr basal plane .6 More recent studies with X- Rays Synchrotron show that, the majority of particles precipitate in -Zr grains having poles tilted 20 - 30 degrees from circumferential direction of the tube, and a minor fraction parallel to the circumferential (hoop) direction.14,15 This trend can be reverted by tensile stresses applied along hoop direction14 or fast cooling rates.13,15 Under these conditions Terminal Solid Solubility increases.13,14 As inferred from Eqs. (5) and (6), several factors affects the hydride precipitation, the solubility of present phases, the ductility of the alloy, the presence of internal (such as intergranular) or external stresses. More studies are necessary, such as electron microscopy and X Ray synchrotron or neutron diffraction, to clarify the result obtained in this work.
8- CONCLUSIONS
In summary, we have performed heat treatment on a Zr-2.5Nb pressure tube samples to be compared with other heat treatments reported in literature. Experimentally, the percentage of Nb in the beta phase was analysed and the dissolution / precipitation solubility of hydrogen in the alloy was calculated by differential scanning calorimetry tests.
Our experimental remarks are:
Thermal treatment carried out at 470°C for 10 - 16 hours does not significantly affect the continuity of beta phase filaments compared to that of the same material treated at 380°C - 24 hours of Parodi3 unlike the treatment at 500°C in which the phase is spheroidized. A percentage of 73-77% Nb in phase was measured.
The following curves were calculated for terminal solid solubility of dissolution and precipitation: and .
Contrary to our expectative the TSS of the 470°C treatment is slightly higher than the measurements for the 380°C treatment.

