Services on Demand
Journal
Article
Indicators
-
 Cited by SciELO
Related links
-
 Similars in
SciELO
Share
Ciencia del suelo
On-line version ISSN 1850-2067
Cienc. suelo vol.31 no.2 Ciudad Autónoma de Buenos Aires Dec. 2013
TRABAJOS
Improved Field Method For Estimating Soil Salinity
Pablo Zalba1*; Maximiliano Garay1; Nilda Amiotti1,2 & Adrian Ares3
1 Departamento de Agronomía, Universidad Nacional del Sur. 8000 Bahía Blanca, Bs.As., Argentina.
2 CERZOS-CONICET.
3 Office of International Research, Education and Development, Virginia Tech, 526 Prices Fork Road, Blacksburg, VA 24061, U.S.A. * Autor de contacto: pzalba@uns.edu.ar
Recibido: 25-03-13
Recibido con revisiones: 27-08-13
Aceptado: 15-09-13
ABSTRACT
Soil salinity is a worldwide limitation for agriculture productivity and simplified procedures to assess salinity are needed. In this study, an efficient method for estimating electrical conductivity (EC) on a saturation extract (ECex) from readings in saturated soil-paste to assess soil salinity was improved. EC values measured in a saturation extract (ECex) were compared with those estimated from a saturated paste (ECest) in 36 texturally- different samples from a broad array of soils with halophyte and glycophyte vegetation in the semiarid region of Argentina. The ECest values were very close to ECex values up to 8 dS m-1, at greater values, estimates tended to diverge from observed values. Determination of EC in a saturated soil-paste is a simple and rapid procedure resulting in an accurate estimation of EC in the saturated extract as indicated by the high degree of predictability (r2= 0.95; P< 0.01). In addition, the pH measured in the saturated paste was a good predictor of soil pH, and closely approximated the pH determined in a 1:2.5 soil: water mixture.
Key word. Field soil salinity, Saturated paste.
Un Método De Campo Mejorado Para Estimar La Salinidad Del Suelo
RESUMEN
La salinidad del suelo es una limitación en todo el mundo para la productividad agrícola, planteando la necesidad de métodos simples para determinar la salinidad. En este estudio, un método eficiente de la estimación de la conductividad eléctrica (CE) del extracto de saturación (CEex) fue desarrollado a partir de las lecturas en una pasta saturada. Los valores de CE determinados en el extracto de saturación (CEex) fueron comparados con aquellos estimados desde la pasta saturada (CEest) en 36 muestras de diferente textura de una amplia variedad de suelos con vegetación halófita y glicófita en la región semiárida de la Argentina. Los valores de CEest fueron muy cercanos a CEex hasta los 8 dS m-1, luego de lo cual las estimaciones tendieron a divergir de los valores observados. La determinación de la CE en una pasta saturada es un procedimiento simple y rápido, resultando en una apreciación precisa de la CE en el extracto de saturación, tal como lo indica el alto grado de predictibilidad obtenido (r2= 0,95; P<0,01). Por otra parte, el pH medido en la pasta saturada resultó un buen indicador del pH edáfico, y muy aproximado al pH determinado en 1:2,5 relación suelo:agua.
Palabras clave. Salinidad del suelo, Pasta saturada.
INTRODUCTION
Soil salinity is a serious limitation for crop production affecting more than 800 million ha worldwide (FAO, 2008). Argentina ranks third in the world behind the former Soviet Union and Australia in land area occupied by salt-affected soils (Szabolcs, 1989). The area covered by these soils in Argentina has spread out over time mostly because of secondary salinization induced by overgrazing in arid and semiarid areas, lack of drainage in irrigation areas, and the rise of shallow groundwater tables in areas receiving increased precipitation.
A saline soil is defined as one having an electrical conductivity (EC) in the saturated paste extract (ECex) of 4 dS m-1 or more (FAO, 1988; USDA, 1993). ECex is the EC of the solution extracted from a soil sample after being mixed with distilled water to produce a saturated paste. Native flora of saline soils (halophytes) can survive in soils with up to 30 dS/m in the ECex but the growth and survival of the large majority of plant species (glycophytes) is affected by salinity (ECex > 4 dS m-1). Measuring ECex requires equipment such as vacuum pumps, porcelain funnels and Kitasato flasks, and therefore is not suitable for determinations outside the laboratory, or in places with limited resources. To overcome these shortcomings, salinity estimates in soil pastes either saturated or with different soil to water ratios have been explored to simplify the methodology (Rhoades et al., 1989; Sonmez et al., 2008; Khorsandi & Yazdi, 2011). Novel techniques such as measurement of apparent EC in the field using coulter-electrodes mounted in carts have also been developed (Moral et al., 2010). However, they need laboratory calibrations and detailed information on soil texture.
The aim of this study was to simplify the necessary steps to obtain sound values of EC by estimating ECex from measurements in a saturated paste as precisely as possible. In this method, only a conductivity meter and an analytical balance are needed to obtain accurate estimates of soil salinity.
MATERIALS AND METHODS
Thirty-six surface and subsurface genetic horizons were sampled in soils evolved in aeolic, alluvial and marine landforms in the semiarid region of Argentina. Soil samples had a wide range of textures: sand, loamy sand, loam, silt-loam, loam-clay-silt and silt. Sand, clay and silt contents varied between 7% and 90%, 2% and 38% and 5% and 79%, respectively. Vegetation included mainly halophytes such as Atriplex spp. and Distichlis spicata; salt tolerant non-halophytes such as Agropyron elongatum and glycophytes such as Bromus unioloides, Discaria americana, Baccharis ulicina, Cynodon dactylon, Nassella tenuissima and Juncus sp.
Samples were air-dried and passed through a 2mm-mesh sieve. The saturation percentage (SP) was then determined by calculating the quantity of water required for 100 g of air-dried soil to reach its saturation point, forming a paste. This value was used to transform the paste's EC values and estimate the EC of the saturation extract according to the following formula:
ECest = ECsp . 0.01 SP
where ECest= Estimated EC of the saturation extract
ECsp= EC of the saturated soil-paste
SP = Saturation percentage
The saturation extract was obtained using Buchner funnels and Kitasato flasks and creating a vacuum until cracks appeared on the surface. The EC of the extract was then measured with a conductivity meter. The functional relationship between ECex and ECest was determined using analysis of regression with the software InfoStat (Di Rienzo et al. , 2010). The sodium adsorption ratio (SAR) in the saturation extract was also determined by measuring sodium, calcium and magnesium content using plasma spectometry (Shimadzu's ICPE-9000 multitype ICP emission spectrometer). In order to determine the relationship between pH of the soil and the pH of the saturation extract, we measured pH in a soil to water ratio of 1:2,5 (pH1:2,5), pH in the saturated paste (pHsp), and pH in the saturation extract (pHex).
RESULTS AND DISCUSSION
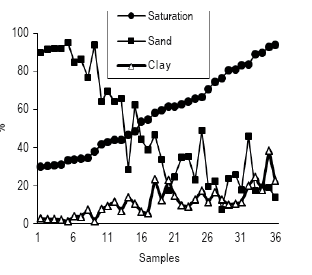
As was expected, a high association between sand and clay contents of the samples and SP was observed (Figure 1), the latter being directly proportional to the clay content and inversely proportional to the sand content. Total porosity of the disturbed samples, associated with their texture, showed a continuous, gradual increase in SP. By selecting samples with different granulometry and ordering them according to their SP values, a continuous line of values without data superposition was obtained.

Figure 1. Saturation percentage and sand and clay content in soil samples from the semiarid region of Argentina.
Figura 1. Porcentaje de saturación y contenidos de arena y de arcilla en muestras de suelo de la región semiárida de la Argentina.
The regression analysis between the sand fraction and SP (Figure 2) shows a high variability (R2=0.88). Therefore, samples were re-ordered into three groups according to their sand content: sandy-class (50-100% sand), middle-class (25-50% sand) and fine-class (less than 25% sand). Therefore, we obtaind the SP range and average for each textural group. This grouping can facilitate comparisons with different textures and a possible SP approximation in field conditions.

Figure 2. Polynomial regression between the sand percentage and the saturation percentage (SP/100).
Figura 2. Regresión polinómica entre el porcentaje de arena y el porcentaje de saturación (SP/100).
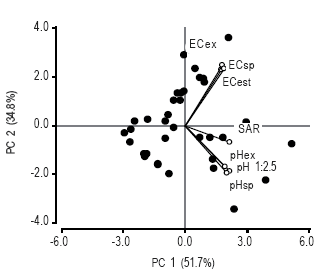
Axes 1 and 2 in the principal component analysis (Figure 3) contained more than 86% of the data cumulative variance. The first axis represented pHsp, pH1;2.5,pHse and to a lesser extent, SAR. The second axis mostly contained the variation in EC, whether estimated or measured in the soil-paste or in the saturation extract. The studied variables clustered into two groups: the electric conductivities on one side, and pH and SAR on the other side. The pH estimates were highly correlated, but there were weaker correlations between these and SAR, especially because high SAR values did not always correspond with high pH values. There was also a high correlation between EC values, but not between EC and pH, or EC and SAR.

Figure 3. Principal component axes for pH in saturated paste (pHsp), pH in 1:2.5 soil to water mixture (pH1:2,5), pH in the extract, (pHex) SAR, EC in the extract (ECex), EC in the saturated paste (ECsp) and estimated EC (ECest) in soil samples from saline environments.
Figura 3. Análisis de componentes principales para pH en la pasta saturada (pHsp), pH en suspensión suelo-agua 1:2,5 (pH1:2,5), pH en el extracto (pHex), RAS (SAR), CE en el extracto (ECex), CE en la pasta saturada (ECsp) y CE estimada (ECest) en muestras de suelo de ambientes salinos.
There was a good fit between ECest and ECex up to EC values of about 8 dS m-1, after which data variability increased and estimated EC tended to be lower than measured values (Figure 4). This behavior is likely caused by the fact that much of the physical space in the saturated paste is occupied by soil particles which interfere with and reduce co electron conduction, giving rise to lower EC values. This effect is greater at higher concentrations of soluble salts but is absent in the case of measurements carried out in the saturation extract.

Figure 4. Relationship between electrical conductivity in soil extract (ECex) and the estimation from a saturated paste (ECest) in soil samples from saline environments.
Figura 4. Relación entre la conductividad eléctrica en el extracto de saturación (ECex) y la conductividad eléctrica estimada a partir de la pasta saturada (ECest) en muestras de suelo de ambientes salinos.
The strong correlation between ECest and ECex indicated the high degree of predictability of the proposed method (R2 = 0.95; p < 0.01). A linear relationship between the EC of the extract and that of the saturated paste for soils in Grangeville, USA was also reported (Rhoades et al., 1989) with separated estimations for individual textural classes. The methodology proposed in our study is also simpler than that cited by Rhoades et al. (1999), who undertook estimations of ECex by calculating the volume fractions of total water and solids in the paste and also the average specific EC of the solid particles. The methodology in this study did not overestimate EC values determined in the saturation extract, but rather tended to slightly underestimate them when salinity levels were high, especially in the case of salt-tolerant vegetation such as Atriplex spp., Distichlis spicata and Agropyron elongatum. However, the precision needed to diagnose whether a soil is saline or not is high, as shown by the fact that an estimated value of 4 dS m-1 corresponds, on the linear curve, to a saturation extract value of 4.7 dS m-1.
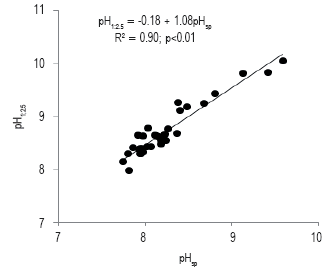
Regression functions indicated a good fit (R2=0.90, P<0.01) between pHsp and the pH1:2.5 (Figure 5). The pHse was less related to pHsp (pHsp = 0.75 pHes + 2.22; R2= 0.68, p < 0.01), particularly when SAR was correlated with pH1:2.5 (SAR= 19.51 pH1:2.5 -157.5; R2=0.72, p < 0.01). The pHsp accurately predicted the pH of the soil and closely approximated the pH1:2.5. On average, the difference between pH1:2.5 and pHsp was 0.48. Apart from the regression formula, this information could be useful and easier to remember for field estimations. SAR was unrelated to the EC and pH of soil samples.

Figure 5. Relationship between pH of a saturated paste (pHsp) and pH in a 1:2,5 soil-water mixture (pH1:2,5) in soil samples from the Pampas region of Argentina.
Figura 5. Relación entre el pH de la pasta saturada (pHsp) y el pH en suspensión suelo-agua 1:2,5 (pH1:2,5) en muestras de suelo de la región pampeana de la Argentina.
CONCLUSIONS
The aim of this study was to simplify the necessary steps to obtain sound values of EC by estimating ECsp from measurements in a saturated paste as precisely as possible. In this method, only a conductivity meter and an analytical balance were needed to obtain accurate estimates of soil salinity. Furthermore, the methodology proposed facilitates the pre-selection of soils for complete salinity analysis in the laboratory. It allows to determine soil salinity levels using a conductivity meter and distilled water, providing a reliable diagnosis in saturated soil-paste which is more useful than in 1:1, 1:2 or 1:5 soil:water mixtures. The pHsp correctly predicted the soil pH and closely approximated pH1:2.5.
ACKNOWLEDGEMENTS
We are grateful to A.M Zamponi (CONICET) for assistance in field measurements and to the ANPCyT -FONCyT and SGCyT - UNS for financial support.
REFERENCES
- Di Rienzo, JA; F Casanoves; MG Balzarini; L Gonzalez; M Tablada & CW Robledo. 2010. InfoStat versión 2010. Grupo InfoStat, FCA, Universidad Nacional de Córdoba, Argentina. [ Links ]
- FAO. 1988. Salt-affected soils and their management. FAO Soils Bulletin 39, Roma. [ Links ]
- FAO. 2008. Land and plant nutrition management service. http:/ /www.fao.org/ag/agl/agll/spush. Last accessed November 3, 2011. [ Links ]
- Khorsandi, F & FA Yazdi. 2011. Estimation of saturated paste extracts' electrical conductivity from 1:5 soil/water suspension and gypsum. Commun. Soil Sci. Plant Anal. 42: 315-321. [ Links ]
- Moral, FJ; JM Terron & JR Marquez da Silva. 2010. Delineation of management zones using mobile measurements of soil apparent electrical conductivity and multivariate geostatistical techniques. Soil Till. Res. 106: 335-343. [ Links ]
- Rhoades, JD; NA Manteghi, PJ Shouse & WJ Alves. 1989. Estimating soil salinity from saturated soil-paste electrical conductivity. Soil Sci. Soc. Am. J. 53: 428-433. [ Links ]
- Rhoades, JD; F Chanduvi & S Lesch. 1999. Soil salinity assessment. Methods and interpretation of electrical conductivity measu-rements. FAO Irrigation and Drainage Paper Nº 57, Roma, Italia. 164 pp. [ Links ]
- Sonmez, S; D Buyuktas; F Okturen & S Citak. 2008. Assessment of different soil to water ratios (1:1, 1:2,5, 1:5) in soil salinity studies. Geoderma 144: 361-369. [ Links ]
- Szabolcs, Z. 1989. Salt-affected soils. CRC Press, Boca Raton, Fl. (U.S.A.), 274 pp.
- USDA. 1993. Diagnóstico y rehabilitación de suelos salinos y sódicos. Richards, L.A. (ed.), Riverside, California, U.S.A.


