


 Inglés (pdf)
 Articulo en XML
 Referencias del artículo
 Enviar articulo por email
 Citado por SciELO
  Similares en
SciELO
Similares en
SciELO 
 Permalink
INTRODUCTION
No tillage (NT) area has been increasing continuously in the last few years. Currently the global area under this soil management system occupies 125 million ha worldwide (Blanco-Canqui & Ruis, 2018). About half of this area is located in South America, where Argentina is among the countries with the largest NT area with 30 million ha under NT, which means 80 % of the whole cultivated area of the country.
The replacement of conventional tillage (CT) by NT has been reported to lead to lower infiltration rates in a wide range of soil textures in the Argentinean Pampas region (Álvarez et al., 2009; Ferreras et al., 2000; Sasal et al., 2006; Soracco et al., 2010), together with lower macroporosity and saturated hydraulic conductivity (K0) (Lozano et al., 2013; Sasal et al., 2006, Soracco et al., 2019), particularly in silty soils with a laminar structure development (Villarreal et al., 2020). This implies a decrease of physical quality in soils under NT (Dexter & Czyz, 2007; Lozano et al., 2016). Summer crops as soybean and maize are the most common in Argentina, with long winter bare fallow periods, which has been proven to contribute to soil physical quality deterioration (Sasal et al., 2017).
In this context, integrating CC into existing cropping systems has the potential to enhance ecosystems services such as better weed control, soil conservation, and increasing carbon and nutrient cycling, improving NT performance (Blanco-Canqui et al., 2011). The inclusion of CC implies higher soil biological activity during the fallow period, coupled with higher input of organic carbon (OC) (Franzluebbers & Stuedemann, 2008; Restovich et al., 2012; Duval et al., 2016). Long-term benefits of inclusion of CC on soil physical quality are relatively well documented. It has been proven that CC can reduce soil compaction and sealing in the long-term, increase soil water retention and improve soil water movement, leading to a better soil physical quality (Blanco-Canqui & Lal, 2008). For example, Blanco-Canqui et al. (2011) in a 15 years field trial, found that the inclusion of CC enhances NT performance, increasing OC, soil water infiltration and reducing soil BD. However, higher input of OC could increase soil water repellency (Behrends Kraemer et al., 2019). In a meta-analysis performed by Álvarez et al. (2017) in Argentinean Pampas Region, in 82 % of the studied cases infiltration increased under CC rotations. In addition, CC also increased plant available water content (PAWC) and K0 (Basche et al., 2016). However, several authors found lower plant available water content in CC sequences, as compared with crop rotations without CC (Duval et al., 2016, Álvarez et al., 2017). Therefore, integration of CC could enhance NT performance by improving structural stability, soil porosity and related soil physical properties (Sasal et al., 2017; Blanco-Canqui, 2018). However, the introduction of CC could be related to a higher water consumption during the fallow period, affecting the summer cash crop yield (Nielsen et al., 2015). Some authors reported in Argentinean Pampas Region lower water availability in crop sequences with CC (Fernández et al., 2008; Álvarez et al., 2017). Duval et al. (2016) mentioned that despite the higher water consumption observed in the CC, as compared with bare fallow, the summer cash crop yield was not affected. In this sense, Meyer et al. (2020) mentioned the need of research for optimizing trade-offs between services and disservices of CC for water balance.
On the other hand, there are few data documenting impacts of CC introduction on soil physical quality in the short-term. Mukherjee & Lal (2015) reported that inclusion of CC increased OC but could not improve soil physical properties in the short term. However, these authors mentioned a tendency to higher aggregate stability and lower bulk density (BD) and available water content under crop sequence with CC, as compared with bare fallow treatment after one year. Liu et al. (2005) reported in a one-year field trial, that the inclusion of winter CC increased soil aggregate stability, related to higher OC content. Some authors mentioned that CC increased the soil macroporosity after two years (Carof et al., 2007). Villamil et al. (2006) reported that the inclusion of CC in NT corn-soybean sequences increased the aggregate stability, total porosity and available water content, and decreased the BD after four years. Haruna et al. (2018) mentioned that, in a 4 years study, CC increased water infiltration and soil sorptivity. Nascente & Stone (2018) found an improvement of different soil physical quality (SPQ) indicators, including BD, total porosity and macroporosity, and S index, after two years of cover cropping, as compared with bare fallow, especially in the 0-10 cm soil layer. In the Pampas Region, Castiglioni et al. (2016) found that CC increased the values of K0, porosity and structural stability after one year of the inclusion of this management. In the other hand, several authors reported no effects in the short term. Restovich et al. (2012) did not found differences in macroporosity values between CC and winter bare fallow after one year. Acuña & Villamil (2014) reported no differences in soil BD in the soil surface between different CC and bare fallow after one year. No differences in the short-term (< 3 years) between CC and bare fallow treatment on K0 (Carof et al., 2007) and BD (Mubiru & Coyne, 2009) were also reported. However, these studies did not consider the temporal variation of SPQ, during the crop sequence. Several authors mentioned that it is important to consider this variation, because the effects of different soil management systems on these properties is highly time dependent (Schwen et al., 2011; Villarreal et al., 2020).
To the best knowledge of the authors, there is still little information about evolution of SPQ in the short-term, after the adoption of CC, especially in the Pampas Region. We hypothesized that the adoption of CC mitigates soil physical degradation under NT, improving the soil physical quality during the first year after its introduction. The objectives of this work were: i- to determine the soil physical quality in different moments of the crop cycle, during the first year after incorporation of cover cropping, as compared with bare fallow; and ii- to measure the impact of CC on the top soil water content during the first year of its introduction.
MATERIALS AND METHODS
Site and treatments
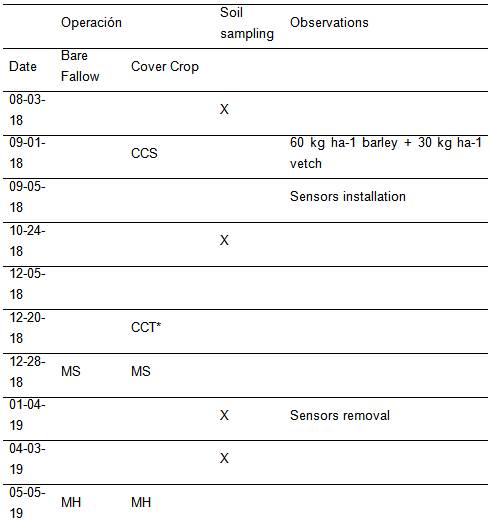
The experiment was carried out near Chascomús city, Argentina (35°44′37.61″ south and 58°03′10.22″ west). The soil was classified as a fine, illitic, thermic abruptic Argiudoll (Soil Survey Staff, 2014), Luvic Phaeozem (IUSS Working Group WRB, 2007), with an A horizon (0-0.3 m), followed by a clay-illuvial Bt horizon (0.3-0.6 m) over the mature silty sediments (C horizon, > 0.6 m). The climate in the region is temperate and the mean annual precipitation is 946 mm. Recorded and historical precipitation for the studied period are shown in Figure 1. Before the experiment was established, the plots were under NT with maize monoculture during the last 10 years, with chemically treated bare fallows during winter. In the year 2018 a completely randomized experimental design was installed with two management systems (plots of 20 m wide and 87 m long for each treatment): a) no-tillage with bare fallow (BF), b) no-tillage with winter cover crops (barley and vetch) (CC). For both treatments, maize was sown as summer crop. All labors carried out are detailed in Table 1. Samplings for soil properties determination were carried out between August 2018 and April 2019, in different dates, according to Table 1.
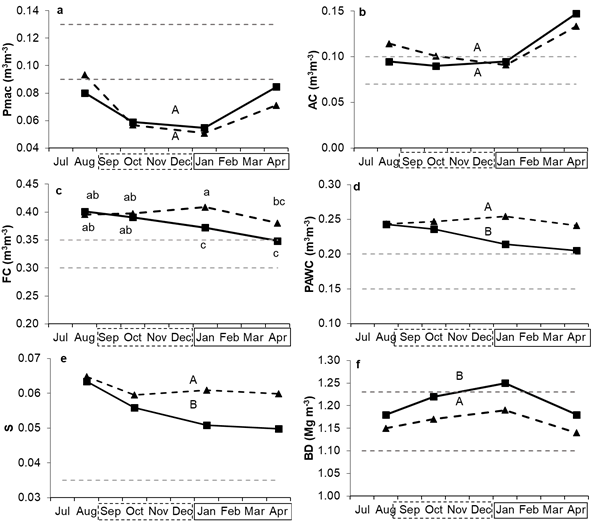
Figure 1 Figura 1 Static soil physical quality indicators (Macroporosity, Pmac; Air capacity, AC; Field capacity, FC; Plant available water content; PAWC; Dexter’s index, S; Bulk density, BD) during the studied period for the two management systems (No tillage with bare fallow, BF, full lines; No tillage with cover crop, CC, dashed lines). Uppercase letter indicates significant differences among systems; lowercase case letter (letter above is for CC, letter below is for BF) indicates significant differences among system x sampling date (LSD, P < 0.05). The enclosed months in the dashed rectangle denotes cover crop growing period and solid rectangle denotes maize growing period. Horizontal grey dashed lines indicate lower (S) and upper limits of the optimal values for each indicator according to Reynolds et al. (2008). Indicadores estáticos de calidad física del suelo (Macroporosidad total, Pmac; Capacidad de aire, AC; Capacidad de campo, FC; Agua disponible; PAWC; índice de Dexter, S; Densidad aparente, BD) durante el periodo estudiado para los dos sistemas de manejo (Siembra directa con barbecho desnudo, BF, líneas llenas; Siembra directa con cultivo de cobertura, CC, líneas cortadas). Letras mayúsculas indican diferencias significativas entre sistemas de manejo; letras minúsculas (letra de superior corresponde a CC, letra inferior corresponde a BF) indican diferencias significativas entre sistema de manejo x fecha de muestreo (LSD, P < 0.05). Los meses encerrados en un rectángulo de líneas cortadas corresponden al periodo de crecimiento del cultivo de cobertura y los encerrados en una línea sólida corresponde al periodo de crecimiento del maíz. Las líneas horizontales entrecortadas grises corresponden a los límites inferiores y superiores de los valores óptimos para cada indicador, de acuerdo con Reynolds et al. (2008).
Soil properties determinations
A homogeneous and representative 5 x 5 m area was selected in the center of the plot in each treatment and sampling date, avoiding visible wheel tracks. Within this area, sites were selected randomly in order to carried out soil sampling and infiltration runs. SPQ indicators derived from the soil water retention curve (SWRC) (so called static SPQ indicators) were determined. Ten intact soil cores (5 cm height, 5 cm diameter, 98 cm3 volume) from the first 10 cm of soil in each treatment and sampling date were taken for determination of the SWRC and BD. Values of water retention data at pressure heads, h (L), of 0, -0.1, -0.3, -0.5, -0.7, -1.0, -3.0, and -150.0 m were determined using a sand box apparatus for h values between 0 and -1, and a pressure chamber for h values ≤ -3 m. The retention curve code (RETC) (van Genuchten et al., 1991) was used to fit the van Genuchten (1980) model to the water retention data obtained for each soil sample. Static SPQ indicators (macroporosity, Pmac; air capacity, AC; plant available water capacity, PAWC; field capacity, FC; Dexter index, S) were calculated from SWRC data following Lozano et al. (2016).
SPQ indicators derived from in-situ infiltration data (so called dynamic SPQ indicators) were determined. Infiltration runs in the field were conducted using a tension infiltrometer (Perroux & White, 1988). The infiltrometer disc had a base radius of 6.25 cm, with five replications in each treatment and sampling date. Infiltration runs were performed at two values of soil water pressure head, h (-3 and 0 cm, applied in this order and in the same place). With the steady-state data of soil water infiltration curve, K (h) (i.e.,K3, and K0) were thus calculated using the multiple-head method (Ankeny et al., 1991). From K (h) data, water-conducting porosity due to pores between two radii ra and rb (ra < rb), was calculated accordingly Watson and Luxmoore (1986):
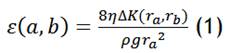
Where ρ is the density of water [ML−3], and g is the acceleration due to gravity [LT−2] and η is the water viscosity [ML-1T-1]. We defined as water-conducting macroporosity (εma) as those pores draining at h > −3 cm (equivalent r > 0.5 mm). Pore continuity index of total porosity (CwTP) and macroporosity (Cwmac, r >0.5 mm) based on water flux (Lozano et al., 2013) was calculated for each pore size family with radii between ra and rb (ra >rb) as the ratio between K (ha) - K(hb) (where ha and hb are the pressure heads at which pores with equivalent radii greater than ra and rb, respectively, drain) and the pore volume fraction occupied by this family, according to:

The volume of large macroporosity and large mesoporosity were determined from fitted water retention data. Reference values of the SPQ indicators were taken from Reynolds et al. (2008) and Dexter & Czyz (2007).
In order to measure soil water content in the topsoil of the A horizon during the studied crop cycle, soil moisture sensors (EC-5 sensor, Decagon Devices Inc., Pullman, Washington, USA) were placed in the field. For each treatment, two replicates probes were installed in depths of 5 (0-10 cm layer) and 15 cm (10-20 cm layer). The measurement interval was 12 h, and data was averaged to daily values. Soil water storage was calculated by sectioning the depths (0-10 cm, 10-20 cm), assuming that the water content (θ) was equal throughout each layer and multiplying the depth (mm) by corresponding volumetric soil water content level (m3 m−3). The total soil water storage values between 0-20 cm depth were derived by calculating the sum of the individual storage in each layer.
At the end of the studied period (April 2019), disturbed soil samples (0-10 cm) were taken in order to determine soil organic carbon (SOC) content (Walkley & Black, 1934). Additionally, water repellency index (Rindex) was determined in soil aggregates between 2-4 cm, with a microinfiltrometer device according to the sorptivity of deionized water and ethanol (96 %vol) (Hallett & Young, 1999).
Statistical analysis
Two way ANOVAs were carried out in order to determine the effects of management system and sampling date on soil properties (Sokal & Rohlf, 1995). Fisher’s least significant difference (LSD) test (Sokal & Rohlf, 1995) was used to compare the means. Because the statistical distribution of K0, εma and Cw data were skewed and non-normal, logarithmic values were used for the statistical analysis. For all analyses the significance was determined at p = 0.05.
RESULTS
Static SPQ indicators
The effects of sampling date and management system on static SPQ (Pmac, AC, FC, PAWC, S and BD) indicators from ANOVAs are shown in Table 2. There was no interaction between factors for these indicators, except for FC. Mean values of Pmac, AC, FC, PAWC, S and BD are shown in Figure 1. In general, similar values between BF and CC of these SPQ indicators were observed in the first and the second sampling dates, corresponding to the beginning of the CC growing period. On the other hand, significant differences between the two management systems were observed during the maize growing season, when CC showed higher values of FC, PAWC and S as compared with BF.
Pmac showed no difference between management systems and was affected by the sampling date (p < 0.05). For both management systems, Pmac decreased between August and October 2018, remained constant between October and January, and increased during the maize growing period (Figure 1-a). The values of AC were similar between management systems, and were also affected by sampling date, showing constant values between August and January and increasing at the end of the maize growing period (Figure 1-b). The values of FC showed different temporal trends in each management system. Under CC management, FC remained constant between August and October 2018, slightly increased in January 2019, when showed higher values as compared with BF, and decreased in April 2019; on the other hand, under BF this variable gradually decreased during the studied period (Figure 1-c). The PAWC were higher under CC management as

Table 2 Tabla 2 Analysis of variance of the effects of soil management system (S) and sampling date (D) on soil physical quality indicators (Saturated hydraulic conductivity, K0, cm h-1; effective macroporosity, εma, %; Total pore connectivity, CwTP, cmh-1; Macropore connectivity, Cwmac, cmh-1; total macroporosity, Pmac, %; Field capacity, FC, m3m-3; Plant available water content, PAWC, m3m-3; Air capacity, AC, m3m-3, Dexter index, S; Bulk density, BD, Mgm-3). Análisis de la varianza de los efectos del sistema de manejo (S) y fecha de muestreo (D) sobre los indicadores de calidad física (Conductividad hidráulica saturada, K0, cm h-1; macroporisidad conductora de agua, εma, %; Conectividad de la porosidad total, CwTP, cmh-1; Conectividad de la macroporosidad, Cwma, cmh-1; Macroporisidad total, Pmac, %; Capacidad de campo, FC, m3m-3; Agua disponible, PAWC, m3m-3; Capacidad de aire, AC, m3m-3, índice de Dexter, S; Densidad aparente, BD, Mgm-3)
compared with BF, especially during the maize growing period (Figure 1-d). The S index decreased between August and October 2018 under both management systems with similar values and remained constant to the end of the maize growing period under CC, while under BF gradually decreased (Figure 1-e); the values were higher under CC as compared with BF, especially during the maize growing period. The BD values showed the same behavior between management systems, increasing between August and January and decreasing at the end of the maize growing period. BF management showed higher BD values as compared with CC, especially in January 2019 (Figure 1-f).
Overall, the differences between management systems were observed in general during the maize growing period. CC management showed higher values of FC, PAWC and S index, and lower values of BD as compared with BF. Most of static SPQ indicators fell out the optimal ranges proposed by Reynolds et al. (2008) (Figure 1). Only BD under CC and S index under both management systems showed optimal/ideal values.
Dynamic SPQ indicators
The effect of sampling date and management system on dynamic SPQ indicators from ANOVAs are shown in Table 2. For all variables, interaction between factors was observed. Mean values of K0, εma, CwTP and Cwmac are shown in Figure 2. As was observed for the static SPQ indicators, in general similar values between BF and CC of dynamic SPQ indicators were observed in the first and the second sampling dates, corresponding to the beginning of the CC growing period. Higher differences between the two management systems were observed during the maize growing season, especially in April 2019, when CC showed higher εma and Cwmac values (Figure 2).
K0 and CwTP values did not differ between management systems in any sampling dates, except in August 2018 when CC treatment showed lower values as compared to BF treatment. Under BF these variables remained constant between August and October 2018, and increased during the maize growing period. Under CC, the values of K0 increased gradually during the whole studied period between August 2018 and April 2019 (Figure 2-a), showing different temporal trend as compared with BF. The values of εma and Cwma were similar between management systems during the fallow period, whereas during the maize growing period higher values of these variables were observed under CC management, as compared to BF (Figure 2-b and d). As was observed for K0, BF and CC treatments showed different temporal trends. Under BF, the values of εma and Cwma decreased between August and October 2018, and increased during the maize growing period, while under CC management, these variables remained constant during this period and increased between October 2018 and April 2019 (Figure 2- b and d).
Overall, the major differences between management systems were observed during the maize growing period, as was found for static SPQ indicators. In general, constant values of dynamic SPQ indicators were observed during the fallow period under BF treatment followed by increasing values during the maize growing period. On the other hand, CC treatment showed a continuous increment of the dynamic SPQ indicators along the studied period, which was more pronounced during the maize growing period. The values of εma and Cwma decreased between August and October 2018 and increased constantly until the end of the maize growing period (Figure 2-b and d).

Figure 2 Figura 2 Dynamic soil physical quality indicators (Saturated hydraulic conductivity, K0; Water-conductive macroporosity, εma; Total pore connectivity, CwTP; Macropore connectivity, Cwmac during the studied period for the two management systems (No tillage with bare fallow, BF, full lines; No tillage with cover crop, CC, dashed lines). Uppercase letter indicates significant differences among systems; lowercase case letter (letter above is for CC, letter below is for BF) indicates significant differences among system x sampling date (LSD, P < 0.05). The enclosed months in the rectangle denote growing period for each site. The enclosed months in the dashed rectangle denotes cover crop growing period and solid rectangle denotes maize growing period. Indicadores dinámicos de calidad física del suelo (Conductividad hidráulica saturada, K0, cm h-1; macroporosidad conductora de agua, εma, %; Conectividad de la porosidad total, CwTP, cmh-1; Conectividad de la macroporosidad, Cwma, cmh-1) durante el periodo estudiado para los dos sistemas de manejo (Siembra directa con barbecho desnudo, BF, líneas llenas; Siembra directa con cultivo de cobertura, CC, líneas cortadas). Letras minúsculas (letra de superior corresponde a CC, letra inferior corresponde a BF) indican diferencias significativas entre sistema de manejo x fecha de muestreo (LSD, p < 0.05). Los meses encerrados en un rectángulo de líneas cortadas corresponden al periodo de crecimiento del cultivo de cobertura y los encerrados en una línea sólida corresponden al periodo de crecimiento del maíz.
Soil water content, SOC, water repellency and dry matter production
The values of SOC and Rindex, measured at the end of the maize growing period (April 2019), are shown in Table 3. No differences between management systems were found for these two variables. According to Reynolds et al. (2008), SOC values fell in the optimal range. The values of Rindex remained below the ‘subcritical water repellency’ values mentioned by Tillman et al. (1989), being a wettable soil.
Figure 3 shows the volumetric soil water content of the top soil, measured in 0-10 cm and 10-20 cm depth, and soil water storage between 0-20 cm depth for different management systems, together with the precipitation recorded during the studied period. Precipitation between August 2018 and April 2019 was 900.5 mm which is higher as compared with the long-term average for the same period (751 mm). This was caused by high precipitation events recorded in November and December 2018, when the rainfall recorded in those months were 190.2 mm (long-term average: 91 mm) and 181 mm (long-term average: 86 mm), respectively. However, during the maize growing period a strong drought occurred. Precipitation between January and April 2019 was 230.6 mm (long-term average: 424.3 mm). During the CC growing period in general there were no differences in the soil water content between management systems in the 0-10 cm layer (Figure 3-a), while in the 10-20 cm layer higher values of θ under BF were observed before and after the strong precipitation events of November (Figure 3-b). In this sense, the soil water storage in the 0-20 cm depth were similar between management systems during the fallow period (Figure 3-c). However, during the maize growing period CC management showed higher values of soil water content as compared to BF in both depths, until the end of February, when a 30 mm rainfall was recorded (Figure 3-a). After this precipitation event, in the 0-10 cm layer CC still showed higher θ values as compared with BF, but in the 10-20 cm layer, BF showed a strong soil water content increment, showing higher values as compared with CC (Figure 3-a and b). These behaviors resulted in higher soil water storage in 0-20 cm depth under CC management between the beginning of the maize growing period and February, and no difference between management systems from February until the end of the maize cycle (Figure 3-c). Regarding the above ground dry matter production of maize, there were no significant differences between the BF and CC (Table 3). However, despite the lack of statistical difference, dry matter production under CC management were 0.8 Mg ha-1 higher as compared with BF.
DISCUSSION
Static SPQ indicators
Our results did not show a clear improvement of the static SPQ indicators in the short-term by the inclusion of CC during the fallow period as compared to bare fallow. No difference between management systems on Pmac and AC (Figure 1-a and b) is in agreement with Restovich et al. (2012) who found no difference on soil macroporosity between CC and BF after one year. On the other hand, the higher values of PAWC, FC and S index, coupled with lower values of BD under CC management (Figure 1-c, d, e and f) are in agrément with several authors who mentioned an improvement of these properties in the short-term under winter CC management (Castiglioni et al., 2016; Nascente & Stone, 2018). The higher difference of PAWC, FC and S index between management systems were especially observed after the CC growing period; probably due to the roots decay of the CC (Sharma et al., 2016). In this sense, Bodner et al. (2008) mentioned that flow-weighted mean pore radius increase under cover cropping management was related to the stabilization of pores and the enhancement of the formation of new pores remaining after roots decay. This increment was also observed for Pmac and AC towards two the end of the maize growing period, in agreement with previous reports in the same studied region (Soracco et al., 2018, Villarreal et al., 2020).

Figure 3 Figura 3 Volumetric soil water content (θ) for 0-10 cm (a) and 10-20 cm (b) depth, water storage for 0-20 cm (c) and precipitation (d) during the studied period for the two management systems (No tillage with bare fallow, BF, black lines; No tillage with cover crop, CC, grey lines). The enclosed months in the rectangle denote growing period (dashed and full lines for cover crop and maize, respectively). Contenido de humedad volumétrico () para 0-10 cm (a) y 10-20 cm (b) de profundidad, agua almacenada para 0-20 cm de profundidad (c) y precipitaciones registradas (d) durante el periodo estudiado para los dos sistemas de manejo (Siembra directa con barbecho desnudo, BF, líneas negras; Siembra directa con cultivo de cobertura, CC, líneas grises). Los meses encerrados en un rectángulo de líneas cortadas corresponden al periodo de crecimiento del cultivo de cobertura y los encerrados en una línea sólida corresponde al periodo de crecimiento del maíz.
Lower values of Pmac, FC, PAWC and S, together with lower BD values under BF, especially during the maize growing period, showed a decrease in SPQ under this management as compared to CC. The increments in BD, observed in January 2019 under CC could be attributed to the machinery traffic during the CC termination and maize seeding (Wilson et al. 2010). CC management showed relative constant values of FC, PAWC and S, showing that the inclusion of CC under NT could give to the soil higher capacity to counteract these compaction processes, increasing the SPQ and its water retention capacity. Bertollo et al. (2021) mentioned that the SPQ was improved because the inclusion of CC despite the small differences in BD and Pmac. These authors showed that after two years, CC cultivation alleviates soil compaction. Note that Pmac and AC indicators did not show differences between management systems. Lozano et al. (2016), studied the effects of different tillage treatments after one year on SPQ, and mentioned that static-based SPQ indicators are not sensitive enough to distinguishing treatments. Values of SPQ indicators outside the optimal range indicate poor physical quality under NT. This is in agreement with several authors who reported physical constrains under NT in the same studied region (Sasal et al., 2006; Álvarez et al., 2009; Lozano et al., 2013; Soracco et al., 2019).
Dynamic SPQ indicators
For all dynamic SPQ indicators, interaction between management system and sampling date was found, indicating that the temporal trend of these indicators varied differently during the studied period depending on the management system (Table 2). Similar values of K0 and CwTP between management systems during the entire studied period are in disagreement with several reports who mentioned that the inclusion of CC increases soil K0 and infiltration in the short-term (Castiglioni et al., 2016; Haruna et al., 2018). On the other hand, higher values of εma and Cwmac were observed under CC management only during the maize growing. This behavior suggests partial pore clogging by the CC roots during their growing period (Bodner et al., 2008), limiting soil water transport. However, during the maize growing period, strong increments of εma and Cwmac under CC treatment could be related to CC roots decay. Several authors mentioned that crop roots growth creates stable and continuous biopores (Landl et al., 2019) which remain after the decomposition of crop roots (Williams & Weil, 2004). Our results highlight that the inclusion of CC enhanced pore formation as compared with bare fallow management, especially the macropore fraction, being in agreement with previous reports (Imhoff et al., 2010).
For the dynamic SPQ indicators it was observed that BF management showed more stable values during the studied period, especially for water-conducting macroporosity and macropore connectivity. This is in agreement with other authors who mentioned the stabilization of soil physical properties under NT (Álvarez et al., 2009). Increasing values of dynamic SPQ indicators under both management systems during the spring-summer period could be related to higher biological activity and root growing, which is in agreement with previous reports (Schwen et al., 2011). These results support the concept that soil hydraulic properties show intra-seasonal changes as a result of swelling and shrinkage, wetting and drying, or changes in management (Jirku et al., 2013). These results also show the importance of including the temporal variation of the soil hydraulic properties, and the need to include variables which describe the configuration of soil pore system based on water movement.
Soil water content, SOC, water repellency and dry matter production
In the present work, we additionally measured the potential negative effects, also called disservices, of the inclusion of CC under NT management (i.e. low water content during the cash crop growing season, water repellency due to OC input and less cash crop production).
The inclusion of CC into the crop sequence did not show negative effects on soil water content during the maize growing season. During the CC growing period, lower values of water content, especially in the 10-20 cm soil depth under CC management, could be related to a higher water consumption during the fallow period, in agreement with several previous reports (Fernández et al., 2008; Nielsen et al., 2015; Álvarez et al., 2017). However, this situation was reverted during the maize growing period when CC showed higher values of soil water content, especially during a dry period (January-February 2019). This is attributed to the higher retention capacity (i.e. higher FC and PAWC) observed under CC during the maize growing period as compared to BF management. Note that the highest difference in PAWC was observed in January 2019. In this sense, Basche et al. (2016) reported that higher values of soil water contents of CC treatment during the summer period was due to a greater capacity of water storage. Additionally, higher values of soil water content under CC management could be related to surface residues left by the CC, leading to lower evapotranspiration (Alfonso et al., 2020). On the other hand, the strong increment of soil water content observed under BF management at the end of February in 10-20 cm depth, after a precipitation of 30 mm, shows lower water retention in the top soil as compared with CC management. Regarding the soil water storage, CC management showed higher capacity to retain water during the spring, as compared to BF management. This implies an improvement of early-season development for the cash crop (Behnke et al., 2020). Our results also show that CC management do not affect negatively maize growing, with similar above ground dry matter production as compared with BF management (Table 3). This is in agreement with previous reports in similar experiments for maize and soybean (Duval et al., 2016; Basche et al., 2016; Alfonso et al., 2020). However, our results are site-specific and were obtained during a not water-limiting period. Several authors mentioned that in arid and semi-arid regions water stored in soils decreased with CC, reducing crop yields (Álvarez et al., 2017).
There were no differences on SOC and Rindex values between management systems at the end of the studied period. It has been reported that changes in SOC are expected in long-term experiments. In agreement with our results, other authors reported no differences in SOC in the short-
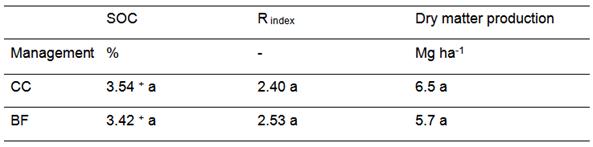
Table 3 Tabla 3 Mean values of Soil Organic Carbon (SOC), water repellency index (R index) and maize dry matter production, measured at the end of the studied period (April 2019). Valores promedio de Carbono Orgánico (SOC), índice de repelencia al agua (R index) y producción de materia seca del maíz, medida al final del periodo estudiado (Abril 2019).
term with the inclusion of CC to the crop sequence (Acuña & Villamil, 2014). The improvement on SPQ under CC management as compared with BF found in this work, without changes in SOC, was also reported by other authors in short-term experiments (Hermawan & Bomke, 1997; Kabir & Koide, 2002; Liu et al., 2005). Álvarez et al. (2014) mentioned that the most likely cause is the aggregation effects of fine roots. Related to SOC, Rindex values did not differ between management systems. This is in disagreement with Beherends Kraemer et al. (2019) who mentioned that the intensification of the crop sequence increase soil water repellency, associated to higher SOC content.
From our results, the inclusion of CC into the crop sequence enhance the SPQ, improving soil water dynamics and retention in the top soil during the first year of its inclusion. No immediately negative impact of CC introduction was observed on maize dry matter production nor on soil water content in the top soil. However, these improvements of cover cropping arise from a complex interaction between soil physical and chemical properties (Basche et al., 2016) and the used species as CC and its termination (Alfonso et al., 2020). Further studies should determine the impact of CC on SPQ and water dynamics in the long-term and during water-limiting years.
CONCLUSIONS
The inclusion of C into the crop sequence enhance the performance of NT, improving SPQ. During the first year of inclusion in the crop sequence, CC management increases soil water retention and water dynamics. The inclusion of CC without affecting cash crops growing is an opportunity for intensify crop sequences in the Depressed Pampas Region, oriented to mitigate soil physical degradation under NT.

