


 Inglês (pdf)
 Artigo em XML
 Referências do artigo
 Enviar este artigo por email
 Citado por SciELO
  Similares em
SciELO
Similares em
SciELO 
 Permalink
INTRODUCTION
Agriculture is the dominant anthropogenic global source of nitrous oxide (N2O) emissions (Tian et al., 2019). This gas is 265 times more powerful in warming potential than carbon dioxide and is the largest ozone-de-pleting substance emitted by human activities (Intergovernmental Panel on Climate Change [IPCC], 2014; Ravishankara et al., 2009). Agricultural soils are the largest source of N2O, accounting for 45% of the total current emissions (Cayuela et al., 2017), and it is estimated that they will produce 59% of the total emissions by 2030 (Hu et al., 2015). In agricultural soils, N2O is produced predominantly through bacterial-mediated transformations of inorganic nitrogen (N), such as nitrification and denitrification (Firestone & Davidson, 1989; Wrage et al., 2004). These processes are governed by diverse pedoclimatic variables including soil moisture, temperature and mineral N contents (Davidson et al., 2000; Farquharson & Baldock, 2008; Gomes et al., 2008). However, the complex interactions among soil properties, weather and management practices might explain the high variability of N2O emissions in space and time including the generally observed “hot spots” and “hot moments” (Groffman et al., 2009). This complexity can make difficult to develop generalizations regarding the impact of management system on N2O emissions (Snyder et al., 2009).
Currently, it is commonly accepted that increasing yield per unit area, while reducing environmental impact, would be the best option for increasing agricultural production, avoiding the need to expand agriculture onto more fragile land (Andrade, 2020). In this context, intensified grain production systems that include so-called “good agronomic practices” can be a way to increase grain yield, relative to the cropping systems used by local farmers, without increasing the impact on soil, air, surface and sub-surface water. In this regard, an alternative management system called ecologically intensification (EI) has been proposed, which is designed to increase crop production while reducing negative impacts on the environment, such as N2O emissions, by improving resource and input productivity using sustainable agronomic practices, a key step towards sustainable intensification (Cassman et al., 2017; Caviglia et al., 2019; Titonell, 2014). These practices contemplate the use of intensified technological practices that include cultivars with high yield potential and stability, with resistance and/or tolerance to diseases, pests and/or herbicides, planted at optimized densities and spacings and fertilized considering the best nutrient management practices, such as dosage according to the target yield, form, source and correct timing. In summary, these EI systems are proposed as an alternative to the management systems usually used by producers, with the objective of obtaining better indicators of productivity and efficiency in the use of resources and inputs (Caviglia et al., 2019), and also producing less environmental impact. Adviento-Borbe et al. (2007) concluded that intensification of cropping systems does not necessarily increase GHG emissions from agricultural systems, if crops are grown using best management practices.
Many studies about N2O emissions have considered individual effects of management practices (Burzaco et al., 2013; Cosentino et al., 2016; Eagle et al., 2013, Maharjan et al., 2014; Zhao et al., 2017) without considering the interactive effects of multiple management practices on that process. Mechanisms of N loss are interlinked in the N cycle and influenced differentially by soil-plant-water relations, thus measures to address one loss mechanism may lead to increasing losses from another. Cover crops (CC) may reduce soil N availability by sequestering this nutrient into biomass, but their decay can provide a flush of carbon and N, leading to increased N2O emissions (Mitchel et al., 2013). A metaanalysis conducted with 106 published studies has shown that CC reduced N2O emissions in 40% of cases (Basche et al., 2014). Therefore, the impact of CC in relation to N2O production is not fully understood (Cavigelli & Parkin, 2012). Applying N according to available soil N and matching the time of application to crop uptake, has also been suggested as a means of reducing N2O emissions (Mosier, 1994).
At the Pampas region of Argentina, maize crops with adequate plant density and spacing between crop rows have been shown to favor N and water uptake (Barbieri et al., 2022; Pietrobón, 2012). Also, synchronizing the moment of N fertilization application with the demand of N by the crop improves N and water productivity (Sainz Rozas et al., 2004). In the same region, splitting the N rate constitutes a recommended management practice in order to maximize barley yield and N use efficiency (Orcellet et al., 2015). These practices interact when adopted together in production systems. Consequently, it is expected that this combination of agronomic practices aimed at improving N and water use efficiencies by the crop can reduce N2O emissions.
In this work, a holistic approach is used to study N emissions from agricultural systems, integrating the effects of proven crop management practices and their interactions. The objectives of this study were i) to evaluate N2O emissions during a soybean-barley-maize rotation and their respective fallows, under two management systems, and ii) to understand the relationships between N2O flow rates with the mineral N content of the soil (NH4++ NO3-), water-filled porous space (WFPS), and soil temperature.
MATERIALS AND METHODS
Site description and experimental design
The experiment was installed in the experimental field of the Balcarce Integrated Unit (EEA-INTA Balcarce, FCA-UNMdP), province of Buenos Aires, Argentina (37º 45´S lat.; 58º 18´W long.; 130 m above sea level). The soil at the experimental site is a complex of Mar del Plata series (fine, mixed, thermic Typic Argiudoll) and Balcarce series (fine, mixed, thermic Petrocalcic Argiudoll). The petrocalcic horizon of Balcarce series is below 0.7m (Soil Survey Staff, 2014). Based on historical records (1971-2014) mean annual rainfall is 916 mm, and mean annual temperature is 14.3°C. The frost-free period is 217 d. For the 2015-2018 period mean annual rainfall was 897 mm and mean annual temperature was 15.3°C.
The surface soil (0- 20 cm) properties at the beginning of the experiment were: pH water of 5.62, 247.5 g kg−1 of clay, 275.9 g kg−1 of silt, 476.6 g kg−1 of sand, 28.3 g kg−1 of organic C content, CEC of 24.26 cmolc kg-1, 2.15 g kg -1 of total N content, a C/N ratio of 13.1, and 19 mg kg−1 of extractable Bray-1 P. Mean soil bulk density was 1.1 g Mg m-3 for the two management systems and a slope < 2%.
The field experiment was established in the year 2009 and was carried-out under rainfed and no-till conditions. Crop residues were left on soil surface after each harvest. In this work, N2O emissions were evaluated under two management systems during 2015-2018 period. This period corresponded to the rotation sequence soybean-barley-maize. Previous crop during 2014-15 was maize. Briefly, the two management systems were: a) the current management implemented by farmers of the region (FP) and b) an ecologically intensified management (EI) (Caviglia et al., 2019). The management systems were randomized in a complete block design with four replicates. The plots were 50 m long and 9.8 m wide. In EI, agronomical practices were decided based on previous knowledge and recent research in order to in-crease grain production together with an increase in resource productivity (Cassman, 1999, 2017) with respect to FP. In FP, crop management included the average input level as well as most commonly used practices, based on the opinion of expert agronomists who are devoted to advise farmers (Caviglia et al., 2019). For EI, target yield was defined as the reachable yield under rainfed conditions for each crop (Aramburu Merlos et al., 2015) whereas, for FP, it was the higher quartile average of the yields obtained by the farmers in the region. Consequently, N rate in EI management was higher than in the traditional management. For maize, N rate was 26 % higher in EI than in FP, whereas for barley N rate was 30 % higher in EI than in FP. In the barley crop, N fertilization in the EI management system was divided into two applications (early and late tillering), while in FP it was only applied in early tillering (Table 1). Regarding N fertilization in the corn crop, both in the EI and FP management systems, diammonium phosphate (DAP) was applied at planting (5 cm next to the seed and at a depth of 2 cm); in FP at planting time urea was also applied on the surface, and in IE urea was applied at the sixleaf growth stage (V6) of maize (time of highest N demand (Sainz Rozas et al., 2004)). The main management characteristics for EI and FP are summarized in Table1. After harvesting the barley (January 2, 2017), a cover crop grew in EI (spontaneous emergence of barley, CC), which was suppressed with herbicides on October 11 to plant maize. In FP, a chemical fallow (ChF) was carried out from March 23 until maize planting.
Weeds were controlled with different herbicides depending on crop. Crops seeds received a conventional treatment with insecticides and fungicides previous to sowing. Soybean seed was inoculated with Bradyrhizobium japonicum. Fungicide was applied in Zadoks stage 37, (Zadoks et al., 1974) to control leaf diseases in the barley crop. No insecticides were applied to protect leaves and seeds in soybeans, since the level of economic damage was not reached, in accordance with the concepts of integrated pest management.
Nitrous oxide emissions measurements
N2O emissions were monitored weekly throughout the study period between April 24, 2015, and May 14, 2018, including fallows. Fluxes of N2O from the soil were measured, in situ, using vented and static chambers, composed of a base and cap (Parkin & Venterea, 2010). Briefly, bases made with rings of polyvinyl chloride 15 cm height (20cm diameter for soybean, barley, barleymaize interperiod and fallows; and 30cm diameter for maize) were inserted to a depth of 8 cm into the soil, so that the headspace height remaining above the soil surface was about 7 cm. The chambers were placed at sowing covering the complete interrow space. Two bases were installed in each plot and remained in the same place during the entire experiment. The bases were removed only on some occasions to allow agronomic practices (herbicide or fertilizer applications) and then reinserted. The polyvinyl chloride cap had a vent tube and rubber stopper used as a port for air sample withdrawal and a digital thermometer. Gas samplings were taken between 10:00 and 12:00 hours when is reached the daily average temperature which is recommended to minimize the diurnal variation in flux rates (Parkin & Venterea, 2010). Caps were placed over the bases immediately before gas sampling, and gas samples of 10 mL were taken at regular intervals (0, 20 and 40 min.) from the chamber headspace through the septum by inserting a polypropylene syringe. Immediately following collection, gas samples were transferred into evacuated 7 mL glass vials, sealed with inert silicone and kept at room temperature until chromatographic analysis. Overpressure was used in the vials in order to avoid contamination with outside air.

Table 1 Management practices in crops under ecological intensification (EI) and current farmer practices (FP). Tabla 1. Prácticas de manejo de cultivos bajo intensificación ecológica (IE) y practices actuales de los productores (FP)
To quantify the concentration of N2O, the gas samples were analyzed with a gas chromatograph (Hewlett Packard 5890 Series II) equipped with a 63Ni electron capture detector. The injector, column packed, and detector temperatures were 35, 60 and 300ºC, respectively. A 5% Argon-Methane mixture was used as the carrier gas.
The flux of N2O was calculated according to the change in N2O concentration over time, using the following equation (Zanatta et al., 2010): f =(dC/dt) x (PV/RT) x (1/A) where f is the gas flow (μg m-2 h-1 in N2O), dC/dt is the change in the concentration of N2O in the chamber during the measurement time dt, P is the atmospheric pressure in the chamber (atm), assumed as 1 atm, V is the volume of the chamber (L), R is the universal gas constant (0.08205 atm L mol-1 K-1), T is the temperature of the chamber at the time of sampling (°K) and A is the area of the chamber (m2).
Cumulative N2O emissions (g N2O-N ha-1) for each crop, barley-maize interperiod and fallows, were estimated by linear interpolation and integration of fluxes measured daily.
Cumulative emissions during the soybean, barley, and maize growing season were divided by the corresponding grain yield (Mg grain ha-1) to estimate N2O-N emissions per unit of grain yield (g N2O-N Mg-1 produced grain).
N2O-N emission per unit of dry matter, protein and energy grain yield was calculated for the complete sequence. The carbohydrate, protein, lipid and ash contents of the harvested product were calculated from the chemical composition of the grains measured in local experiments (Andrade, 1995; Carpaneto & Abbate, 2017). Product energy values were taken according to Penning de Vries (1974).
Soil and weather variables
Together with N2O emissions samplings, composite soil samples were collected from each plot by taking about 8-10 cores (2.5 cm diameter) to a depth of 10 cm, near the chambers. Soil samples were placed in sealed plastic bags, returned to the laboratory, and homogenized. Subsamples were weighed for gravimetric water content determination by oven drying at 105°C for 24 h. The remaining field moist soil was used to determine the content of NO3-N and NH4+-N. NO3-N and NH4+-N analyses were performed by extracting 20 g of soil with 100 mL of KCl (1mol L-1) and shaking for 60 min at 250 revolutions min-1. Extracts of KCl were filtered through Whatman N°42 filter paper and then analyzed following the procedure described by Keeney and Nelson (1982). NO3-N and NH4+-N contents were expressed on a dry soil basis. Soil bulk density was determined in the layer 0-10 cm of soil by using the core method described by Blake & Hartge (1986). The mean soil bulk density was 1.1 g cm-3 for the two management systems.
Soil gravimetric water content and bulk density values were used to calculate water-filled pore space (WFPS), expressed as percent, using the following equation:
WFPS (%) = (θ/p) x 100
where θ is volumetric soil water content and p is soil porosity, and p was calculated as p = 1 − (dry bulk density/soil particle density)
Soil particle density was taken as 2.65 Mg m-3, a value commonly used for mineral soils (Porta Casanellas et al., 2011).
Simultaneously at the time of each flux measurement and soil sampling, soil temperature was also recorded by using a digital thermometer inserted to a depth of 10 cm and located very close to the chamber.
Daily precipitation and air temperature data were obtained from a meteorological station located at the experimental field, approximately 500 m away from the experiment.
Plant sampling
Plants were sampled at physiological maturity of each crop to determine grain yield, aboveground stove-dry mass, and N concentration. Sampling was also performed at different stages of the crops (for soybeans: V6, R1, R3, R6; R8; for barley: tillering, 15d pre-flowering, flowering and physiological maturity; for maize: V6, 15d pre-flowering, flowering, 15d post flowering, grain filling and physiological maturity). Plants were hand-harvested from four randomly selected sites per plot of 4.5 m2 for maize and 1 m2 for soybean and barley. All samples were weighed, oven-dried at 70ºC for 72-96 h and reweighed to determine the moisture and dry matter contents. Then, a subsample was ground, homogenized and passed through a 0.25-mm diameter sieve for N determination by Kjeldahl method (Bremner & Mulvaney, 1982). N uptake by the crop was calculated as the product of aboveground dry matter and N concentration. At physiological maturity, grains were separated from all other vegetal material and dry matter weights were recorded separately to determine dry grain yield and total N concentration (grain N plus plant material N).
Statistical analysis
Mixed linear models were used to study the temporal variability of N2O emissions. This allowed modeling the heterogeneity of the residual variance when it was considered convenient. N2O emissions were log-transformed to approximate a normal distribution. The models were fitted using the R environment (R Core Team, 2016) and the nlme package (Pinheiro et al., 2016). A significance level of 10% was used for the analysis of each variable due to the high variability of N2O emissions.
The edaphic variables were analyzed separately for each crop, barley-maize interperiod and fallows to detect if they presented statistically significant differences due to the management systems, sampling dates and the interaction between both variables. Dates, management system and blocks were considered as fixed factors and chambers as a random factor. The sum of NH4+-N and NO3-N contents were analyzed together as mineral N, because their relationship with N2O emissions separately was less strong than when summed as N-mineral.
Mixed models were also used to study the relationship between the N2O emission rates and the soil environmental and chemical variables, with the chambers as a random factor. These models considered N mineral (NH4+-N + NO3-N), WFPS and soil temperature as explanatory variables and N2O emissions rate as a dependent variable.
The best combination of return variables (best model) was selected through the Akaike information criterion. The marginal (R2m) and conditional (R2c) coefficients of determination were calculated for each model using the methodology proposed by Nakagawa and Schielzeth (2013). The R2m and R2c can be interpreted as the coefficients of determination of the ordinary least squares model, but R2m represents the proportion of variability of the N2O emissions explained by the fixed term of the model and R2c represents the proportion of variability explained by both fixed and random factors of the model. We used the piecewise SEM package for R statistical language (Lefcheck, 2016), which allows the use of mixed effect models to build the structural equation models.
A regression tree analysis, based on a procedure originally proposed by Morgan and Sonquist (1963) and later used by others (cited by Lemon et al., 2003), was used to separate the N2O values into more homo-geneous subgroups in relation to the edaphic variables. This analysis involves a series of decisions. The parent group is transformed into two new subgroups; each subgroup becomes more homogenous in the response variable (N2O emission rate). In such a way, each subgroup turns into a new parent group. These divisions may be repeated as many times according to the criterion used. The analysis was carried out with the R rpart package (Therneau & Atkinson, 2019) following the construction criteria of the tree proposed by Breiman et at. (1984) (cited by Venables & Ripley, 2002).
RESULTS
Soil temperature and WFPS
Air temperature fluctuated between 4.0-22.6ºC in the autumn-winter season and between 7.5-28.8ºC in spring-summer (Fig. 1A). Monthly air temperature averages during the study period were from 0.2 to 3.6 ºC higher than the historical values.
Soil temperature presented the expected dynamics throughout the seasons (Fig.1A). During the whole evaluation period, soil temperature showed occasional decreases after precipitation events or because of decreases in air temperature. The only dates on which there were significant differences in soil temperature between EI and FP (interaction management system × date, p<0.10), were 4 November during barley growth, and January 19 in the barley-maize interperiod. Otherwise, there was little variation between the two systems.
During the fallow, soybean and barley periods and the beginning of the barley-maize interperiod, rainfall was lower than the historical average. For the rest of the barley-maize interperiod rainfall was higher than the historical average. The weather conditions for most of the maize growing season were similar to the historical averages.
Soil water content normally increased following periods of intense precipitation (>20 mm). Average WFPS during the study period ranged from 12 to 60%. The only dates on which there were significant differences in WFPS between EI and FP (interaction management system × date, p<0.10) were 24 August and 26 December during the barley crop. Otherwise, there were little differences (2.5-3.0%), between the two systems (Fig. 1B).
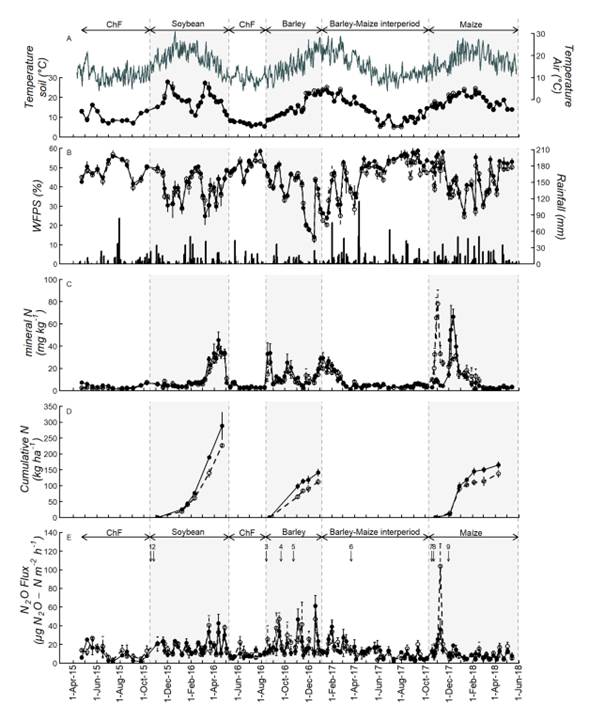
Figure 1 (A) Daily air temperature and soil temperature at 10 cm depth; (B) daily rainfall (mm) and WFPS (%) in the soil (0-10 cm depth); (C) mineral N content (NO3-N and NH4+-N) in the soil (0-10 cm depth); (D) N accumulated by soybean, barley and maize; and (E) nitrous oxide flux for plots under FP (○) and EI (●). FP: current management implemented by farmers of the region. EI: ecologically intensified management. Data measured from April 2015 to May 2018. Air temperature and precipitation data were obtained from a meteorological station located at the research station. All other data were obtained from the experimental plots. Each point represents the mean of four replicates. Vertical lines represent ± standard error (SE). Horizontal arrows in A and E indicate the crops: Soybean, Barley and Maize, chemical fallows (ChF) and barley-maize interperiod (CC/ChF). Vertical arrows in E indicate the implementation dates of management practices: 1 Soybean sowing, 2: DAP (diammonium phosphate) application (EI-FP), 3: Barley sowing and DAP application, 4: urea application (EI-FP), 5: urea application (EI), 6: chemical fallow initiation on FP, 7: Maize sowing, 8: urea application (FP), urea application (EI). Figura 1. (A) Temperatura diaria del aire y temperatura del suelo a 10 cm de profundidad; (B) precipitación diaria (mm) y WFPS (%) en el suelo (0-10 cm de profundidad); (C) contenido de N mineral (NO3--N y NH4+-N) en el suelo (0-10 cm de profundidad); (D) N acumulado por soja, cebada y maíz; y (E) flujo de óxido nitroso para parcelas bajo FP (○) y EI (●). FP: manejo actual implementado por agricultores de la región. EI: manejo ecológicamente intensificado. Datos medidos de abril de 2015 a mayo de 2018. Los datos de temperatura del aire y precipitación se obtuvieron de una estación meteorológica ubicada en la estación de investigación. Todos los demás datos se obtuvieron de las parcelas experimentales. Cada punto representa la media de cuatro repeticiones. Las líneas verticales representan ± error estándar (SE). Las flechas horizontales en A y E indican los cultivos: Soja, Cebada y Maíz, barbechos químicos (ChF) e interperíodo cebada-maíz (CC/ChF). Las flechas verticales en E indican las fechas de implementación de las prácticas de manejo: 1: Siembra de soja, 2: Aplicación de DAP (fosfato diamónico) (EI-FP), 3: Siembra de cebada y aplicación de DAP, 4: Aplicación de urea (EI-FP), 5: aplicación de urea (EI), 6: inicio de barbecho químico en FP, 7: siembra de maíz, 8: aplicación de urea (FP), 9: aplicación de urea (EI).
Soil content N mineral
Soil mineral N content in the first 10 cm was affected by the sampling date (p<0.10) for the whole sequence. Soil mineral N content was low during fallows, between 0.22 and 10 mg kg-1, and it showed high values at the end of the cycle of the soybean crop (reaching 48 mg kg-1) (Fig. 1C). At barley sowing, soil mineral N content was 22 and 10 mg kg-1 for EI and FP, respectively. Soil mineral N content increased after barley N-fertilization in both management systems, and at the end of the barley growing cycle (Fig. 1C). The mineral N soil content at the start of the barley-maize interperiod was 30 mg N kg-1 in both management systems, decreased steadily to approximately 4.5 mg N kg-1, and remained at low values for the rest of this period (Fig. 1C). During the maize growing season this variable was affected by the management system depending on the sampling date (interaction management system x sampling date, p<0.10). At the first sampling dates in the maize crop, the concentration of mineral N was higher in FP than in EI, but the differences were significant only on October 30, and November 3 (p<0.10) (Fig. 1C). The highest mineral N soil contents were observed one week after the application of N fertilizers in both management systems. After December, the levels of mineral N began to decrease and did not differ between the management systems, maintaining values below 9 mg N kg-1.
Grain yield, protein, energy and N accumulation by crops
Grain, protein and energy yields were significantly higher for IE than for MP (p<0.10) for all crops in the rotation. Cumulative plant N did not differ between management systems (p>0.10) (Fig. 1D). However, it is evident that there was a sustained trend towards a higher N accumulation at physiological maturity of all crops (20-27%) in the EI management system than in FP (Table 2). Up to 25 days after emergence, the rate of N accumulation was low in all three crops. Total N accumulation in aboveground biomass was highest in soybean, intermediate in maize and lowest in barley.

Table 2 Grain yield, dry matter for cover crop, protein, energy, and plant accumulated N for crops. Management systems were EI and FP. Management system with different letters within each column are significantly different (p<0.10). Tabla 2. Rendimiento de grano, materia seca del cultivo de cobertura, proteína, energía y N acumulado en planta para cultivos. Los sistemas de manejo fueron EI y FP. Los sistemas de manejo con letras diferentes dentro de cada columna son significativamente diferentes (p<0,10).
Nitrous oxide emissions
During the sequence under study, the N2O fluxes were affected by the sampling date (p<0.10) but not by the management system (Fig. 1E). The measured flux values were highest during the crop periods (9-43, 6-61 and 4-104 μg N2O-N m-2 h-1, for soybean, barley and maize, respectively), intermediate during the barley-mai-ze interperiod (2-47 and 3-35 μg N2O-N m-2 h-1, for CC and ChF, respectively) and lowest during chemical fallows of the maize-soybean and soybean-barley interperiods (1-26 and 5-22 μg N2O-N m-2 h-1, respectively).
The highest N2O flux for the soybean crop occurred during the grain filling stage. In the barley crop, N2O peaks were detected after rainfalls greater than 20 mm, after N fertilization, and at the end of the growing season. In the maize crop, only one N2O peak was detected on the FP management system after the N application. In the barley-maize interperiod, N2O peaks were only detected at the beginning of the period, for both CC and ChF. For further details concerning the barley crop and its subsequent crop interperiod see Casanave et al. (2020).
For the maize crop, N fertilization at V6 stage under the IE management system resulted in lower N2O emission compared to FP (Fig. 1E). In both treatments, emissions decreased after February, in coincidence with the higher rate of plant N uptake and, probably, by the decreased microbial activity because of lower temperatures in the last two months of the crop cycle (Fig. 1C).
There were no significant differences in accumulated N2O emissions between management systems for the complete sequence (3050 and 3380 g N2O-N ha-1, for EI and FP, respectively; p=0.57). Notwithstanding, significant differences in cumulative emissions between management systems were measured during the maize growing season (521 and 646 g N2O-N ha-1, for EI and FP, respectively; p=0.02, Table 3).
Cumulative N2O emissions during the complete sequence expressed per unit grain yield were affected by the management system (p=0.04). The FP management system had higher yield-scaled N2O emissions for the complete sequence than the EI management system (455 and 317 g N2O-N Mg yield-1 for FP and EI, respectively). Similar results were observed for the emissions expressed in energy terms (15 and 23 mg N-N2O MJ-1 for EI and FP, respectively, p=0.03) and in protein terms (1.88 and 2.72 g N-N2O kg-1 protein for EI and FP, respectively, p=0.02).
Individual analyses for each crop showed that cumulative yield-scaled emissions were higher for FP than for EI in soybean and maize and did not differ significantly in barley. During the barley-maize interperiod, the CC in EI produced 4.4 Mg ha-1 of aerial DM without differences in emissions with ChF (p=0.50) (Casanave et al., 2020).
Cumulative-energy and protein scale emissions were higher for the FP management system than for IE in all individual crops of the sequence (emissions per unit energy and per unit protein).

Table 3 Cumulative flux, grain yield, energy and protein-scale N2O emissions in the complete sequence. Management systems were EI and FP. Management system with different letters within each column are significantly different (p<0.10). Tabla 3. Flujo acumulado y emisiones de N2O a escala rendimiento de grano, energía y proteína en la secuencia completa. Los sistemas de manejo fueron EI y FP. Los sistemas de manejo con letras diferentes dentro de cada columna son significativamente diferentes (p<0,10).
Relationship between N2O emissions and soil variables
Analysis of the whole sequence showed that N2O emission rates were associated with soil mineral N content (p=0.010) and with two simple interactions: i) WFPS x soil temperature (p=0.057), and ii) mineral N x soil temperature (p=0.013).
Multiple regression analysis was used to assess the effects of soil temperature, mineral N, and WFPS on N2O emission rate. These biophysical factors accounted for only 10% (p<0.001) of the variation in N2O emission rate according to the following equation:
y= 1.58 + 0.025×Nm + 0.0009×WFPS×Tsoil + 0.0008×Nm×Tsoil n: number of observations=923
When y: natural logarithm N2O emissions.
Tsoil: soil Temperature (ºC); WFPS: water-filled pore space (%); Nm: mineral N (mg kg-1); R2m represents the proportion of variability explained by the fixed terms of the model
R2c represents the proportion of variability explained by the complete model (fixed plus random terms) The regression tree provided threshold splits for the effect of soil variables on the emission rate (Fig. 2). These thresholds were: 7.4 mg N kg-1 for the soil mineral N content; 10.35 and 8.7 °C for soil temperature, with low mineral N the first, and with high mineral N and intermediate WPFS the second; and 39.6 and 55.4% for WPFS, both with high mineral N.
The measured emission rates were separated into seven significantly different groups (p<0.001). The highest rate was observed in group 3 (41.8 μg N2O-N m-2 h-1 on average) explained by high N and high WFPS. Groups 4 and 7 had medium-high rates as a result of high N content and intermediate WFPS (from 39.6 to 55.4%). Groups 2 and 5 presented medium-low emission rate limited by N and WFPS, respectively. The lowest emission rates were in groups 1 and 6 (<9 μg N2O-N m-2 h-1 on average), which corresponded to low soil temperature (Fig.2).

Figure 2 Regression tree for the complete sequence. Dependent variable was N2O emissions in µg N2O-N m-2 h-1. The regressor variables were % WFPS, soil temperature (TºCsoil) and mineral N content. n: number of observations, x = mean emission rate value. Figura 2. Árbol de regresión para la secuencia completa. La variable dependiente fueron las emisiones de N2O en µg N2O-N m-2 h-1. Las variables regresoras fueron % WFPS, temperatura del suelo (TºCsuelo) y contenido de N mineral. n: número de observaciones, x = valor medio de la tasa de emisión.
DISCUSSION
Control of N2O emissions by edaphic and environmental variables
The temporal dynamics of N2O emissions and soil variables were similar among management systems and were significantly regulated by soil mineral N content, %WFPS and soil temperature. During barley and soybean crops, emission peaks occurred at the end of the growing seasons (Fig. 1E). In the case of barley, these peaks were equal to or even greater than those caused by N fertilization. These high emissions could have been consequence of low or no N plant uptake, and appropriate soil temperature (Fig. 1A) for residue decomposition and subsequent N release by mineralization (Fig. 1C). In addition, the high content of soil organic matter leads to high rates of N mineralization in late spring and early summer (Della Chiesa et al., 2018). Therefore, mineral N was available for N2O production by microbial nitrification and/or denitrification (Robertson & Groffman, 2015) (Figure 1 C). During these periods, neither mineral N nor soil temperature would have limited N2O production, so changes in %WFPS would be responsible for triggering N2O emissions, as proposed in the “hot moment” approach of Groffman et al. (2009) and Molodovskaya et al. (2012).
In the case of soybean, towards the end of the growing season, senescence and decomposition of low C/N ratio residues, can lead to increased N2O production (Yang & Cai, 2005). Furthermore, the N2-fixing bacterium, Bradyrhizobium japonicum, is associated with the soybean crop through root nodules, incorporating N that can be lost in gaseous form after the processes of decomposition and mineralization of residues, either by denitrification or by nitrification (Yang & Cai, 2005).
Therefore, the decomposition of dead nodules and rootlets provides another important source of mineral N that could generate N2O emission. This is in agreement with the findings of Inaba et al. (2009) who showed that N2O is only emitted from decomposed nodules but not from fresh nodules or roots, and with those from other studies that showed that N2O emission starts from late growth until before harvest (Ciampitti et al., 2008; Inaba et al., 2012; Sanchez et al., 2019, Uchida & Akiyama, 2013; Yang & Cai, 2005;).
Soil drying and rewetting events can induce N2O emission pulses (Beare et al., 2009; Guo et al., 2014; Leitner et al., 2017; Pelster et al., 2011), because they produce the alteration of the soil microstructure due to the process of expansion and contraction of clay particles, which increases the specific surface area exposed to the action of microorganisms (Perdomo y Barbazán, 2001; Reatto et al., 2009). This microstructure alteration which would generate the release of carbonaceous and nitrogenous substrates previously inaccessible for microbial use, and by the denitrification of N-NO3- accumulated during the drier period (Li et al., 1992). Soil rewetting would explain the peaks observed after a dry period, for example, those that occurred at the end of the barley cycle and the beginning of the barley-maize interperiod, on 19 December 2016 and 1 February 2017, when WFPS increased from 13.9 to 43.1% and from 23.6 to 43.3%, respectively, following rainfall >20 mm (Fig. 1B). Since in our experiment the %WFPS was never higher than 60% even after abundant rainfall, conditions would have been more favorable for N2O emission by the nitrification process (Casanave Ponti et al., 2020; Jantalia et al., 2008). This may be due to the fact that our experiment was conducted on an udic water regime soil (Typic Argiudol, well drained, with moderate permeability, deep water table and slope of 2%). Therefore, it is not common to find anaerobic conditions for prolonged periods in this type of agricultural soils (Glinski & Stepniewski, 1985; Taboada & Lavado, 1986). This reinforces the supposition that the emission peaks are more likely to have originated from nitrification. Although we consider that in our study favorable conditions for N2O emission by nitrification prevailed, it cannot be completely ruled out that denitrification was a mechanism through which part of the N2O was emitted. Possibly temporary anaerobic sites were generated in the soil during our experiment.
Groffman and Crawford (2003) reported that denitrifying enzyme activity is highly correlated with soil respiration, while Weier et al. (1993) found that the rate of denitrification was correlated with the presence of readily available organic C. In recent years it has been confirmed that denitrification can occur in aerobic soils. Müller et al. (2003) found that the consecutive reduction process of NO3- and NO2- is the predominant mechanism of N2O production even under dominantly aerobic conditions. Although favorable conditions for nitrification prevailed in our study, it is possible that in the CC grown during the barley-maize interperiod of the EI management system, temporary anaerobic microsites were generated by the consumption of oxygen by the microbial activity stimulated by the presence of residues. Thus, higher availability of labile C could have favored N2O emission or complete denitrification to N 2, reducing N2O emissions, depending on the level of anaerobiosis achieved (Chen et al., 2018; Cannavo et al., 2003; Millar & Baggs, 2004).
Soil moisture content is a major determinant of soil N2O emission because it regulates the availability of oxy-gen for soil microorganisms responsible for denitrification and/or nitrification processes (Butterbach-Bahl et al., 2013; Linn & Doran, 1984). Therefore, the effect of N fertilization on emissions depends on the coincidence with a significant rainfall. This coincidence explains the peak emission recorded after N fertilization and one day after >20 mm rainfall for the maize crop in the FP management system. These results are also in agreement with several studies that showed that higher N2O fluxes occur in response to rainfall events following N fertilization (Alvarez et al., 2012; Omonode et al., 2010; Shen et al., 2018; Venterea et al., 2011).
In the maize growing season, no significant N2O emission peaks were observed in the EI management system. This can be explained by the timing of urea fertilization, which was applied at the V6 stage when N uptake by the crop is high (Fig. 1D) (Sainz Rozas et al., 2001). Urea activity is normally higher than 60.3 mg kg-1 h-1 in the soil of our region, so urea hydrolysis occurred rapidly, producing NH4+ (Wyngaard et al., 2012). In turn, N-NH4+ is rapidly nitrified under aerobic conditions in these soils (Videla et al., 2005), releasing NO3-which may be susceptible to denitrification. The significant biophysical factors that determined the N2O emission rate in this study were soil mineral N content, the interaction of mineral N × soil temperature (ºC), and the interaction of soil temperature (ºC) × % WFPS. These effects together explained 10% of the variation in the N2O emission rate. A close relationship between N2O emission rate and a particular biophysical factor is rarely informed in the literature (Chang et al., 1998) because soil N2O emissions at field conditions show high spatial and temporal variability (Dalal et al., 2003; Granli & Bockman, 1994) and because associated biophysical factors may have multiplicative rather than additive effects (Parton et al., 2001). Furthermore, other biophysical factors, such as COS, may also regulate soil N2O emission rates. In controlled incubation experiments, however, the relationship between COS and N2O emission rates varies from strong (Bremner & Blackmer, 1981) to weak (Chaves et al., 2005).
The regression tree showed that topsoil mineral N was the main determinant of soil N2O flux in our study (Fig. 1). The results agree with some previous studies (Lin et al., 2010; Wang et al., 2011). In Groups 1 and 6 of the regression tree (Fig. 2), emissions were low because they occurred during the autumn-winter months in which low soil temperature (<10.35ºC and <8.7ºC, respectively) reduced N2O emissions by decreasing soil microbial activity (Farquharson & Baldock, 2008; Maljanen et al., 2009). These results agree with those observed by Álvarez et al. (2012) and Cosentino et al. (2013), who reported that N2O emissions during the winter period were generally low for the Argentine Pampa region.
Group 3 (WFPS > 55.4%), that included only 14 measurements out of a total of 923, showed the highest emissions. This low frequency of water saturation is because the experiment was conducted on an udic water regime soil. In groups 2 and 5, emissions were medium to low and limited by mineral N content and %WFPS, respectively, in agreement with Groffman (1991). Situations characterized by high mineral N con-tent, high temperature, and intermediate %WFPS (>39.94% and <55.3%) resulted in medium to high N2O emission rates, as occurred in Group 7 (Fig. 2). This is in agreement with the findings of Castaldi (2000) and Smith et al. (2003). For WFPS below 55%, the relative importance of nitrification as a source of N2O emission increases, whereas that of denitrification decreases (Linn & Doran, 1984). Moreover, the N2O emission from nitrification is usually lower than that generated by denitrification (Bateman and Baggs, 2005; Castaldi, 2000; Smith et al., 2003). These effects would be the reason for the medium to high N2O emissions in Group 7 and the high N2O emissions in Group 3.
Thresholds for soil factors obtained by regression tree analysis could be useful for deciding the intensity of soil N2O sampling throughout the year, thus saving time and effort in field and lab work. For example, decreasing the sampling frequency when soil temperature is below 10°C, since under those conditions N2O emissions are probably low or negligible (Cosentino et al., 2013). Furthermore, emission peaks can contribute significantly to total N2O emissions (Jacinthe & Dick, 1997; Parkin & Kaspar, 2006). Therefore, if these peaks are not captured by intensive sampling, particularly after nitrogen fertilizer applications and irrigation or precipitation, total N2O emissions calculated from field measurements would be underestimated (Barton et al., 2015; Parkin, 2008; Parkin & Kaspar, 2006,), leading to uncertainties in national and global N2O inventories.
Effect of management systems on N2O emissions
The management system did not significantly (p>0.1) affect cumulative soil N2O emissions in the whole sequence. Emissions averaged 3050 and 3380 g N2O-N ha-1 for EI and FP, respectively, even though EI received a higher N dose. In general, N2O emissions increase with increasing N fertilizer rates, especially when the amount of N applied is higher than crop needs (Eagle et al., 2017; Han et al., 2017; Omonode et al., 2017; Zhao et al., 2017). However, in our study, the higher N doses applied in EI compared to FP did not result in higher N2O emissions because of the combination of adequate fertilization strategies and crop management practices (Table 1).
Cumulative N2O emission during maize crop was significantly lower in EI than in FP and did not differ between management systems during the soybean and the barley crops, and during the periods between crops (Table 4). Emissions from barley and maize crops were 14.5% and 20% lower in EI than in FP, respectively, even though the N fertilization rate of barley and maize in EI was 42% and 25% higher than in FP (Table 1). In both crops, the splitting of nitrogen fertilization in EI could have contributed to reduce N2O losses in that system because of a greater synchrony between crop demand and N supply. Moreover, the N fertilization at stage V6 in maize under the IE management system resulted in greater absorption of N by the crop and less N2O evolved compared to FP (Fig. 1D).
During the barley-maize interperiod, emissions under CC in EI presented values somewhat higher, although not statistically significant, than under ChF in FP, probably because of the presence of growing plants that would have favored the activity of soil microorganisms through the contribution of Crich exudates from roots. This situation would have promoted oxygen consumption, generating microsites with temporary anaerobiosis in the soil (Bardgett & Van der Putten, 2014; Garbeva et al., 2004a; Siddique et al., 2012;), which in turn stimulate the N2O emission processes. Mitchell et al. (2013) indicated that higher biological activity favors higher soluble C, which in turn stimulates N2O emissions. In our same experimental site, a higher overall biological activity was verified in EI compared to FP, through higher indices of mean abundance, diversity, structure, and maturity of the nematode population (Thougnon et al., 2018). The availability of mineralizable C needs to be considered in future assessments of the effect of CC on N2O emissions, especially when CC is implemented as a strategy to mitigate agricultural GHG emissions through plant uptake of available mineral N from the soil (Casanave Ponti et al., 2020).
Grain yield was significantly higher for EI than for FP (p<0.05) in all crops in the rotation (Table 3). Thus, integrated crop and nutrient management practices improved crop yields by increasing productivity and resource use efficiency (water, radiation, and N) (Caviglia et al., 2019). Several authors suggested that the impact of management practices on the environment should be assessed by expressing GHG emissions per unit of crop yield instead of per unit area (Burzaco et al., 2013; Grassini and Cassman, 2012; Maharjan et al., 2014; van Groenigen et al., 2010; Venterea et al., 2011).
Yield-based N2O emissions in our study for the complete sequence were lower for EI than for FP (p<0.05, Table 3). Similar results were observed for emissions expressed per unit energy or per unit protein produced (Table 3). The EI management system decreased yield-scaled N2O emissions by 29% for soybean (p<0.05) and barley (ns) and by 30% for maize (p<0.05) compared with the FP management system. These results were due to lower cumulative emission and higher yield in maize and, to higher yield in soybean. Maize had the most important contribution to the accumulated grain yield of the crop sequence, irrespective of the treatment (Table 3). These results evidenced the crucial role of maize in the variations of the accumulated emissions of this crop sequence expressed per unit yield, energy and protein.
Considering the complete study period, the combination of management practices in EI increased crop yields and did not increase N2O emissions relative to FP, despite higher N fertilization rates and the inclusion of a cover crop in EI.
There is no information in the literature about N2O emissions at the crop level and their sequence per unit of energy and protein, so the data presented in this work constitute an original contribution.
Our values of total N2O emissions per unit area for either management system and in barley and maize are lower than that calculated by applying the IPCC direct emission factor (Tier 1) which amounts 1% of the applied fertilizer (IPCC, 2019). Other studies in Argentina (Alvarez et al., 2012; Piccinetti et al, 2021), southern Brazil (Jantalia et al., 2008) and northwestern Uruguay (Perdomo et al., 2009) arrived at similar results. These data indicate that the IPCC 1% emission factor would overestimate the true N2O emissions from notill cropping systems in southern South America.
Our data support the hypothesis that intensive crop management systems can increase crop productivity without increasing N2O emissions, avoiding the conversion of natural areas to cropland while meeting global needs for food, fiber, and biofuels (Andrade, 2020; Cassman, 1999; Snyder et al., 2009; Venterea et al., 2016; Zhao et al., 2016).

