


 English (pdf)
 Article in xml format
 Article references
 Send this article by e-mail
 Cited by SciELO
  Similars in
SciELO
Similars in
SciELO 
 Permalink
INTRODUCTION
Cardiovascular disease (CVD) is the leading cause of death both in developed and in developing countries. Approximately 80% of deaths of CV origin occur in low and middle income countries (1, 2) The INTER-HEART study showed that nine measurable and potentially modifiable risk factors are responsible for 90% of acute myocardial infarctions. (3) Most of these CV risk (CVR) factors also represent the main causes of disease burden worldwide. (2) It is critical for de-veloping countries to improve their ability to detect individuals at high CVR in order to benefit from more intense medical interventions.
In recent years, the estimation of CVR has assumed a central role in CV primary prevention, and research in the field of risk prediction has become subject of profound study. (1) The estimation of future CVR not only aids global clinical management as basis for individual therapeutic decision-making but also as a tool to evaluate the risk profile at the population level. (1) Decisions in CV prevention should be adopted after an adequate estimation of CVR; for example, medical treatment with statins in individuals at high CVR. (4) In turn, the calculation of CVR is not only an essential support tool for clinical decision-making, but also aids with the communication and diffusion of information to patients. (5)
Cardiovascular risk prediction scores are practical, easy to use tools at the level of primary care. Most models of CVR prediction have been built in devel-oped countries using databases with different socio-demographic, epidemiological and nutritional realities than those found in the South Cone of Latin America regions. (5) In this context, inaccurate risk prediction may lead to inadequate onset of medical interventions in individuals at lower real risk than that predicted by equations created in different populations. (8.9)

The aim of this study was thus to evaluate the ex-ternal validity (calibration, discrimination, sensitivity and specificity) of CVR prediction equations built in developed countries, in the first follow-up data of the Center of Excellence in Cardiovascular Health for South America (CESCAS) cohort, a representa-tive general population sample of four cities in the South Cone of Latin America (Argentina, Chile and Uruguay). To our knowledge, this is the first study that evaluates and compares different CVR prediction equations in populations belonging to the South Cone of Latin America. (9-11).
METHODS
Selected prediction equations
The selection of CVR prediction equations was based on mod-
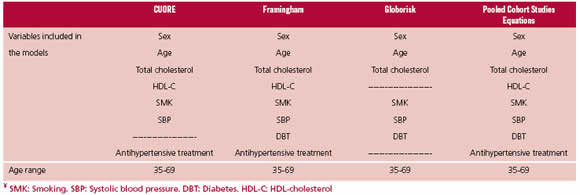
els presented in the 2016 European guidelines on CVD pre-vention in clinical practice. (12) The equations incorporated for the analysis were selected following two steps: Firstly, prediction models whose variables had all been evaluated in the Southern Cone of Latin America CESCAS cohort were included and then, equations predicting only CV mortality or coronary events were finally excluded. The models evalu-ated were: ASSIGN-SCORE, (13) QRISK1 (14) & QRISK2 (15), SCORE, (16) PROCAM, (17) Pooled Cohort Studies Equations, (18) Framingham, (19) CUORE (20) and Globo-risk. (21). Equations selected for evaluation corresponded to the last four risk models. Figure 1 depicts the selection pro-cess and Table 1 describes the final events predicted by these equations, the variables included in the models and the age ranges evaluated.
The CeSCaS cohort
The details of the analysis and sampling method of the CES-CAS cohort study have been previously published. (22-23). Essentially, CESCAS is a prospective cohort study including 7,524 adults (3,165 men and 4,359 women) from 35 to 74 years of age, recruited between December 2010 and Decem-ber 2012. The sample originates from polystage sampling representative of the general population of four cities of the Southern Cone of Latin America: Bariloche and Marcos Paz (Argentina), Temuco (Chile) and Canelones (Uruguay). The global response rate was 73.4% and was similar in men and women across cities.
Study data were collected during a home visit and in an-other visit to a medical center. Socio-demographic information (age, sex, education and occupation) was obtained dur-ing the home survey. Anthropometric measurements were obtained by certified, trained staff using standardized proto-cols and techniques. Blood pressure was measured with the participant seated after a 5-minute rest, using a standard mercury or aneroid sphygmomanometer, and the average of three readings was considered for the analysis. Body weight, height and waist circumference were measured twice during the evaluation, and their average was used in all the analy-ses.
A fasting blood sample was withdrawn to assess lipo-proteins, creatinine and blood sugar levels. The fasting in-terval was verified before blood withdrawal and no blood sample was taken if fasting was below 10 hours. Standard methods were used to determine blood glucose, total cho-lesterol, HDL-cholesterol, triglycerides and creatinine. LDL-cholesterol concentration was calculated using Friedewald’s equation when triglycerides were <400mg/dL. (24) Diabetes was defined as blood sugar levels ≥ 126 mg/dL and/or self-re-ported history of diabetes and/or its current treatment with insulin or oral anticoagulants.
Cardiovascular events (angina, fatal and non-fatal myo-cardial infarction, fatal and non-fatal stroke, coronary artery, carotid or peripheral revascularization procedure, heart fail-ure and sudden death) in this first follow-up evaluation were confirmed by a specialist in internal medicine or a cardiolo-gist after verifying the event-specific record. Of importance, the CESCAS cohort did not reveal intermittent claudication, one of the Framingham equation endpoints.
Statistical analysis: external validation of the models
The regression coefficients of the original publications were obtained for each selected model. Together with these coef-ficients, all the equations were recalibrated to the CESCAS population with the following exponential equation: (19)
where S0 (t) is survival at the specific follow-up time; βi are the estimated coefficients of regression (Log hazard ra-tio); Xi is the specific value of each risk factor considered for
-the equation; Xi refers to the mean value of each risk factor
in the CESCAS population at baseline and p corresponds to the number of risk factors for each equation.
A different “endpoint” variable for each equation was created in the database (Table2), specifically including the events for which they were designed as prediction tools.
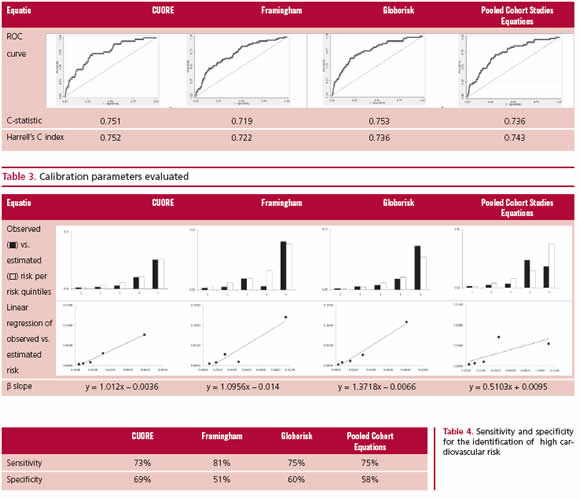
The discrimination of each equation was assessed through the calculation of the C-statistic (Area under the ROC curve, AUROC) and Harrell’s C-index. The C-statistic is the most commonly used measurement for the discrimination of CV prediction models. It reflects the ability of this index to discriminate between individuals presenting or not events. Namely, it expresses the probability that a randomly selected case (event) has a risk score above a randomly se-lected non-case (without event). (5) Harrell’s C-index is an-other similar statistical tool to compare the discrimination of a model, but allows the addition of follow-up time, which measures its capacity to assign high risk to individuals with short time to the event. (25, 26) Calibration was analyzed comparing predicted and observed events per risk quintile. In addition, the β slope of the linear regression estimates was calculated, where values close to 1 indicate better model calibration.
For the calculation of sensitivity and specificity, the American guidelines suggest a cut-off point of 7.5% risk at 10 years. Since the follow-up time of the present cohort is lower, the cut-off point was estimated as 3% risk. This adap-tation was performed using the following formula: 1 - Exp (-1*average annual incidence of events*follow-up time for the 95% cohort percentile). Sensitivity was calculated as true positives (TP)/(TP + false negatives) *100. Specificity was calculated as true negatives (TN)/TN + false positives) *100.
ethical considerations
This study was performed following data protection rights guidelines of people who voluntarily participated in the study. All CESCAS cohort participants signed an informed consent including the authorization of data use for second-ary analysis. Cohort protocol was approved by the Ethics Committees of all the centers participating in Argentina, Chile and Uruguay.
RESULTS
Follow-up of the CeSCaS cohort
After the exclusion of participants with history of CVD at baseline cohort evaluation, and cases without available complete baseline biochemical tests, 6,364 participants were included in the study. At the time of analysis of the present database, median follow-up was 2.2 years, interquartile range 1.9-2.8 years. A total of 60 primary CV events occurred during that in-terval: 21 anginas and acute myocardial infarctions, 15 strokes, 10 heart failures, 2 coronary artery revas-cularization procedures and 12 CV deaths.
DISCUSSION
The study assessed external validation parameters of equations estimating CVR in a Southern Cone of Latin America cohort. Even though current follow-up data of the CESCAS cohort did not provide significant differences among selected equations, we should point out that CUORE, Framingham and Globorisk scores had the best prediction parameters in this population. According to the literature, ROC curves rarely ex-ceed 0.8 values (27) in this type of validation analyses. In this study, all the curves in the CESCAS cohort were above 0.7, with Globorisk and CUORE presenting the highest C-statistics. Moreover, Harrell’s C-index was similar among the different equations. Assessment of the degree of agreement between observed and predicted model values (calibration) showed that CU-ORE, Globorisk and Framingham were the equations with highest accordance in the comparison per risk quintiles and with β coefficient closer to 1, whereas the AHA Pooled Cohort Studies Equations showed model instability in the higher risk quintiles with β coefficient farther from 1. The four equations showed comparable sensitivity and specificity to detect indi-viduals at elevated CV risk, the Framingham equation evidencing the highest value for sensitivity and CU-ORE for specificity.
Certain observations and limitations should be mentioned about the conclusions of this study: 1) the current follow-up time of the CESCAS cohort does not allow a long-term prediction analysis; however, all the analyses performed in the study were adjusted to sur-vival according to the follow-up time; 2) future analy-ses will have a greater number of CV events, allowing the incorporation of equations evaluating exclusively CV mortality such as the SCORE model; and 3) inter-mittent claudication cases were not considered for the evaluation of the Framingham equation, as they were not recorded in the cohort.
Among the strengths of this study, we should first mention that, to our understanding, no other external validation analysis of CVR equations has been previously published in the general population of the South-ern Cone of Latin America; second, calibration of each equation for baseline risk of the CESCAS cohort popu-lation was performed using prevalent risk factor data, which would not have been possible without individual population data for a more accurate adaptation of the model to the population under the study (27), and; third, independent analyses were performed for each equation taking into account the final events they eval-uate and the age range for which they were designed.
Current work in the CESCAS cohort will not only increase the complexity of external validation analy-ses of the equations developed, but will also allow the construction of a proper regional prediction model and the evaluation of other types of non-conventional prediction variables as inflammation or atherogenic biomarkers (PCR, lipoprotein A).
CONCLUSIONS
Risk prediction equations evaluated in the study showed similar risk prediction parameters and CUORE, Framingham and Globorisk equations present-ed the best parameters. These results represent a first approximation for the selection of the most adequate prediction model for our population. Future cut-off points of CESCAS cohort with longer follow-up and higher number of events will improve the CVR clas-sification at the population level based upon the evi-dence resulting from data of our region.

