


Serviços Personalizados
Journal

Artigo
 Inglês (pdf)
 Artigo em XML
 Referências do artigo
 Enviar este artigo por email
Indicadores
-
 Citado por SciELO
Links relacionados
-
 Similares em
SciELO
Similares em
SciELO
Compartilhar

 Permalink
Meteorologica
versão On-line ISSN 1850-468X
Meteorologica vol.31 no.1-2 Ciudad Autónoma de Buenos Aires jan./dez. 2006
ARTÍCULOS ORIGINALES
Climatic properties of the daily 500 HPA circulation ECWMF reanalysis data over southern southamerica during 1980-1988
Susana A. Bischoff *, Walter M. Vargas * **
* Universidad de Buenos Aires (Arg.)
** CONICET
Manuscript recieved December 12, 2005, in final form November 4,2007
ABSTRACT
Several properties of atmospheric circulation over South America using ECMWF reanalyzed daily circulation anomaly maps at 500 hPa over the period 1980-1988 are analyzed. Reanalysis are particularly useful in this region due to the scarce radiosonde measurements. The properties analyzed here are selected in a way that they describe the different circulation conditions over the region to obtain a statistical diagnosis for objective forecast. The most frequent circulation types were obtained in a previous paper by applying correlation matrices between fields. In this paper that matrix was used to obtain other properties of the circulation types such as persistence, "opposites types", uncommon types and those providing information independent of the sample ("quasi orthogonal types"). Uncommon circulation types whose occurrence probability ranges from 6 to 10% are relevant in May, July, August, September, October and December. Types which correlate with each other with negative coefficients compose the group of "opposites types". This would allow constructing a partial time series of circulation types. The physical standpoint means that the two types represented respond to opposite dynamic and thermodynamic conditions.
Key Words: Circulation types; Persistence; Extreme circulation patterns
RESUMEN
Se analizan diferentes propiedades de la circulación atmosférica sobre Sud América utilizando mapas de anomalías de circulación diaria en 500 hPa en el período 1980-1988 obtenidos de los reanálisis del ECWMF. Las propiedades que se estudian describen condiciones de circulación sobre la región que permitan obtener un diagnóstico estadístico para el pronóstico objetivo. Los diferentes "tipos" de circulación mas frecuentes fueron obtenidos en un trabajo previo mediante la aplicación de la técnica que usa la matriz de correlación entre campos. En este trabajo fue utilizada esa matriz para obtener propiedades de los "tipos" como la persistencia, los "opuestos", los no comunes y los que proveen información independiente de la muestra ("cuasi ortogonales"). Los "tipos" de circulación no comunes, con probabilidad de ocurrencia entre 6 y 10%, son importantes en los meses de Mayo, Julio, Agosto, Setiembre, Octubre y Diciembre "Tipos" de circulación que están correlacionados entre sí con valores negativos definen los "opuestos" que puestos en forma de serie temporal permitirían analizar la característica estructural de su comportamiento.
1. INTRODUCTION
The determination of categories of atmospheric circulation types is the first stage in order to develop a synoptic climatology approach to be used in daily weather forecasting. A particular radiosonde network, the Andean mountain range at the west of a narrow continent and a vast ocean extension to the east, exhibit particular difficulties to synoptic climatic analysis and weather forecasting in South America.
In order to develop a synoptic climatology to be used in daily weather forecasting, it is necessary, among other things, to have types that will enable an objective identification of specific daily weather maps to obtain statistical forecasting models. It is important to obtain these map types and their properties such as persistence, as well as the "opposite" ones, uncommon map types and those that provide more independent information to the sample, "quasi Orthogonal" map types. These properties should be obtained through a long series of objective analyses of daily weather maps.
Hence, this paper has been carried out with the information gathered from the reanalyses developed by the European Centre for Medium Range Weather Forecasting (ECMWF) for this region and using the results shown in Bischoff and Vargas (2003). In that paper objective reanalyses of geopotential height (Z) at 500 hPa and 1000 hPa were obtained from the ECMWF for the period 1980-1988 (regular grid 2.5x2.5 lat-long) and used for the analysis. An extended grid from 22.5ºS to 55ºS and from 52.5ºW to 85ºW was used to reduce the influence of the oceans with respect to the continental area as much possible. This area was selected because fields over the continent respond to the physics of the model and to real data, unlike the ocean where the influence of real data is smaller. Therefore, a more extended ocean area would affect the weather typing method applied over South America.
The classification method (Lund, 1965) was applied to Daily Z Anomalies map (DZA) at 500 hPa over the whole record (1980-1988). This allows the analysis of the evolution and presence of a particular type over different months and years. For modeling weather forecasts it is important to use given data properties (data in this case are maps) (Makridakis, 1978; Uriel, 1985). These properties represent the most frequent maps as well as the extreme and/or less probable characteristics to be used for model adjustments. The aim of this paper is to study special aspects of the atmospheric circulation at 500 hPa for the Southern South American region.
- "Quasi orthogonal" circulation types.
- "Opposite" and uncommon circulation types
- Daily persistence of most frequent circulation types and their distribution law. Sequence of daily anomaly Z circulation types for to estimate conditional probabilities which are useful to objective forecasting,
This paper has been divided as follows: 1. Objectives and background information, 2. Employed methodology and region under study, 3. Analysis of properties of circulation typing considered to be necessary in order to have a wider scope in variability such as "quasi orthogonal", opposite, uncommon, daily persistence and associated probabilities and analysis and characteristics of the most persistent types, 4. Conclusions.
2. DATA AND METHODS
To apply the Lund's method, DZA were used as the input data. Each of these DZA maps at 500 hPa was correlated with all the others in the sample. The map with the largest number of R≥ 0.70 correlation coefficients was named Type 1. After removing all the Type 1 cases (maps well correlated with Type 1), the first of the remaining maps not included in Type 1 was selected as Type 2 and correlated with each of the other maps in the series. This process was subsequently repeated and finished when the residual sample contained less than 5% of the whole sample. Table I shows the characteristics of the outstanding structures of the most frequent eight circulation types obtained by Bischoff and Vargas (2003).
Table I: Characteristics of the most outstanding structures of the most frequent eight circulation types.

These types represent almost 63% of the sample. The other types are less frequent, for example Type 9 accounts for only 3.5%, and for the following Types the frequencies are even smaller. Some of the types mentioned above represent important situations as regards to their association with weather phenomena. It is worth mentioning, for example, that some types such as number 2 and 5 represent situations accompanied by important precipitation and temperature singularities.
In this paper the correlation matrix of the previous paper was used to obtain:
* "quasi orthogonal" circulation types.
"Quasi orthogonal" circulation types are those which are non significantly correlated with a large number of daily circulation maps (30% or more of the sample). In mathematical terms, they have no correlation, or have correlation with R not different from zero. In this analysis, the "quasi orthogonal" circulation types have one hundred or more daily weather maps with this condition. For the sample considered, the values of non significant correlation coefficients are R ≤ .18 or R ≤ .13 for the 5 and 1% significance levels respectively (Panofsky (1965)). These types contain by themselves a large amount of statistic independent information. For these reasons it is very important that any sample that is used for statistical analysis of mathematical forecasting modelling should contain the "quasi orthogonal" circulation types .
* "Opposite" circulation types are those negatively correlated (R ≤ - .70) with daily weather maps.
* Uncommon circulation types are those maps whose probability of occurrence is less than 1%.
3. RESULTS
3.1 "Quasi orthogonal" circulation types
Some maps were identified as having the characteristic of being "quasi orthogonal" types (defined in 2).
Table II shows the number of "quasi orthogonal" maps that meet this condition during the period of analysis for each month .
Table II: Date of occurrence of monthly "quasi orthogonal" circulation types with the number of daily weather maps.

Every month presents between 5% and 1% of "quasi orthogonal" types. However, January and February present extreme singularities.
In January, there is a maximum number of types (fourteen in this case) that provide independent information. In February instead, there is only one day that meets the requirements of "quasi orthogonal" type. On the other hand, the results shown in Table II suggest that the adjustment of statistical forecast models should be made on a monthly basis.
Figure 1 shows the "quasi orthogonal" circulation type with other 235 circulation weather maps of the sample as it can be seen in Table II. This circulation type shows a trough with a NW - SE axis over the continent reaching 35° S and a strong zonal gradient. In lower latitudes another low pressure system appears in a more zonal position.
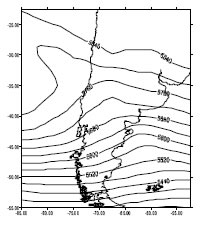
Figure 1. 05/01/87 "Quasi orthogonal" circulation type.
3.2 "Opposite" circulation types
It is important to know if in the sample there are circulation maps with patterns representing, in mathematical terms, opposite dynamic and thermodynamic conditions; such cases shall be defined as "opposite" types.
The types obtained meet this condition in some cases. Table III shows some examples of "opposite" types with correlation coefficient R≤ - .70 and the number of circulation weather maps that represent each one.
Table III: "Opposite" circulation types and number of daily maps correlated with R≤ -.70. Dates marked (*) represent "orthogonal" types and (#) shows types with correlation of -0.94.

Of the 22 annual circulation types identified in the previous paper, some have a high negative correlation showing their "quasi opposite" structures (in view of the definition in the last paragraph).
It is worth noting the relationship of this characteristic in the types defined as 4 and 3, in which each one of them represents a considerable number of days. It can be mentioned that while the first one shows a SW - NE circulation over the whole region, the second one shows a NW - SE circulation over the same region. They are very highly and significantly correlated, R≤- .94, thus being the highest relationship found in the sample under study. Other cases of opposite types have similar properties of "quasi orthogonal" circulation types. As mentioned above, the probability of occurrence of "opposite" circulation types reaches maximum value at given types, such as those identified as 3 and 4. This probability indicates the necessity of including opposite types in the temporal series model. The usefulness of this is in the association of "opposite" circulation types with extreme phenomena.
Figure 2 shows selected cases of opposite circulation types. Those types are identified by Type 20 (1/1/83) (figure 2a) representing 27 daily circulation maps and their opposite one identified by Type 16 (10/29/84) (figure 2b) representing 39 daily circulation maps with correlation coefficient R=- .77. On the other hand Type 19 (6/17/88) (figure 2c) representing 29 daily circulation maps and their opposite one identified by Type 17 (7/21/80) (figure 2d) representing 33 daily circulation maps with correlation coefficient R= 87.
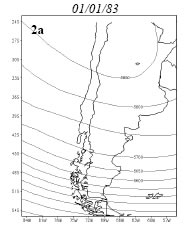

Figure 2. a, b, c and d. Opposite types
One of the uses of this subset could be as follows: if opposite circulation types are to be represented as the terms of temporal series, it could be imagined that a given type (represented by 1) and his opposite one (represented by -1) form a series. This series will have unequal intervals formed by blank, 1 and -1, in order to perform sequential studies and estimation problems of return periods. This is very important when the opposite types are associated with severe weather phenomena or those having great impacts on the surface variables. Table IV shows as an example, the series obtained that refer to the occurrence of Types 3 and 4 (above mentioned) during January of different years. This Table shows the sequences of occurrence for "opposite" type 3 (+1) and type 4 (-1) for January 1980, 1981 and 1982.
Table IV: Sequences of occurrence for opposite circulation Types 3 (+1) and 4 (-1) for January 1980, 1981 and 1982
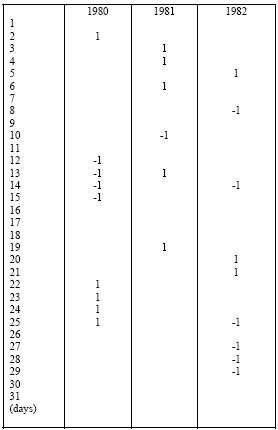
These examples show how the opposite circulation types can take place in temporal sequences. Simultaneously, the probability of change from one sequence to another can be estimated.
3.3 Uncommon circulation types
From the statistical viewpoint it is interesting to mention another particularly important case: uncommon types and their variability. These have been identified as having the lowest frequency and the greatest difficulties to mathematical forecasting modelling. Generally, it can be said that uncommon maps tend to represent patterns with trough and/or wedge axis in an unusual position or erratic combinations of them over the region under study. In these cases, the circulation can not be precisely defined neither zonally nor meridionally on a spatial scale.
Figure 3 only provides examples of some uncommon circulation types. The circulation type of April 30, 1982 (figure 3a) shows a diffluent flow over both ocean areas, an anticyclone in the north-eastern part of the continent and a trough in southern Brazil. This could suggest a blocking at rather low latitudes. The circulation type of June 30, 1983(figure 3b) presents a diffluent wedge with a NE-SW axis on the Atlantic Ocean that evolves into a trough and a low-pressure system over the Pacific, in the north-east of the region. This anomaly map would respond to the so-called "cut-off low" or "cold drop" in atmospheric circulation patterns. The circulation type of October 17, 1988 (figure 3c) shows an intense wedge in the southern area of the continent with more intense western flows at subtropical latitudes and two low-pressure systems at higher latitudes in both oceans.

Figure 3. a, b, and c. Uncommon circulation types
3.4. Circulation type persistence
The atmosphere shows some persistence effects in different temporal scales. With regard to the circulation types found in this study, an analysis of these properties for the first six types (most frequent ones) was carried out throughout the period.
Table V shows the frequency of occurrence in relation to daily persistence for each one of these types. It can be seen that in all cases the highest frequency is related to the persistence of one day (no persistence). The highest frequency of persistence equal or greater than 2 days varies during the year and according to the types under study. In particular, Type 2 shows the occurrence of the highest persistence analysed (seven days) during April, May and June, and two cases of persistence for six days during February and April. Next is Type 3, which shows seven days persistence during August and one for six days during July. In general, remaining types show lower persistence. It is interesting to note that February does not have the presence of types 5 and 6 in the analysed sample.
Table V: Frequency of persistence occurrence (in number of days) for listed types throughout the year.

Summarizing, Figure 4 shows, for each one of the types, the behaviour of the relationship between absolute frequency and daily persistence. It can be seen that in all cases the frequency could be well represented by Markov's chain model (Kaczmarek (1977)).

Figure 4: Relationship between absolute frequency and persistence for types listed in Table IV
Table VI shows the probability of change (Pc) for each type and the probability of no change (Pnc) when the same type occurs for at least two consecutive days during the total period under study. This probability distribution was studied during the January - March, April - June, July - September, October - December quarters and during the annual period. The analysis for the first six types shows that types 2 and 5 have nearly 20% less Pc than Pnc during the total period.
Table VI: Probability of change (Pc) and no change (Pnc) of the same type occurrence during the year.

For the remaining types, this difference does not exceed 10%. Type 2, associated to blocking situations, and Type 5, representing a low index circulation with a strong meridional component, are the most persistent. In relation to the distribution of these probabilities, the quarters analysed in Table VI show that Type 2 is most persistent during autumn and Type 5 during winter and spring. Type 3, having a more intense zonal circulation than the previous two models, has minimum persistence.
The behaviour between Pc and Pnc during these quarters shows that type 1, for example, has the highest probability of no persistence in the first and last quarters. During the remaining quarters, this probability is reversed.
4. CONCLUSIONS
There exists an important intermonthly variability in the frequency of the main circulation types. Using these results the forecasting methods would be developed at a monthly basis.
Uncommon maps, with probabilities between 6 and 10%, are important in May, July, August, September, October and December. They represent systems having trough and/or wedge axes in nearly zonal position or erratic combinations of them. In such a way that the circulation maps can not be defined neither as zonal nor meridional at the spatial scale.
Circulation maps that would include independent statistical information in a sample are the uncommon and "quasi orthogonal" circulation types. As regards the development of a forecasting statistical model, it would be useful that these maps be included in the working sample.
About the development of forecasting statistical models, it can be found that there are a large number of types with a structure highly correlated with others in a negative way. They are able to form a partial time series of circulation types represented by a dichotomic variable. Its significance lies in the fact that, in physical terms, those types would be representing the inverse dynamic and thermodynamic conditions. This is true for types 3 and 4.
Taking into account the importance of persistence in the series of meteorological variables, this study shows that the main types have persistence of up to seven days. Examples are the types 2 and 3. Type 2 shows the importance of blocking in the South Atlantic region. This has a strong bearing on the occurrence of humidity advections to the continent and periods of persistent rainfall.
The persistence (Pc) for circulation type 2 during the quarter APR -JUN is the lowest of the sample.
On some occasions, the Pc of a circulation type is higher than its Pnc. This is mainly the case of circulation types 1, 3, 5 and 6 during summer (JAN - MAR), showing higher circulation variability owing to the passage of shorter waves and thus, higher variability on associated phenomena. The condition of persistence is especially important during autumn and winter. From Table VI, it can be also concluded that an annual estimation of the property of no change (Pnc) or persistence in respect of the property of change (Pc) casts a shadow over the differences between these properties throughout the year. This strengthens the idea of the development of seasonal or monthly models for statistical forecasting.
The possibility to fit models of temporal series to the opposite types increases the goodness of long-term statistical forecasts in a daily scale. In the case of uncommon types this could show the low occurrence probability of these fields in order to include them in the objective forecast. Weather type persistence is another important element to be included in the models.
ACKNOWLEDGMENT: This research work has been supported by PIP 5139 /5 CONICET, X-234, X-095 UBA and PICT 26094/05.
REFERENCES
1. Bischoff S. and Vargas W. The 500 and 1000 hpa weather type circulations and their relationship with some extreme climatic conditions over Southern South America, International Journal of Climatology 23, 541-556. 2003. [ Links ]
2. Kaczmarek Z. Statistical Methods in Hydrology and Meteorology. U.S Geological Survey. Washington, D.C.1977. [ Links ]
3. Lund I. A Map - pattern classification by statistical methods, Journal of Applied Meteorology 2, 56-65. 1963. [ Links ]
4. Makridakis W. Forecasting Methods and Applications. Boston, Massachusetts. 1978. [ Links ]
5. Panofsky H. and Brier G. Some Applications of Statistic to Meteorology The Pennsylvania State University. 1965. [ Links ]
6. Uriel E. Análisis de Series Temporales. Modelos ARIMA. PARANINFO. Madrid. 1985 . [ Links ]

