Serviços Personalizados
Journal
Artigo
Indicadores
-
 Citado por SciELO
Links relacionados
-
 Similares em
SciELO
Compartilhar
Revista industrial y agrícola de Tucumán
versão On-line ISSN 1851-3018
Rev. ind. agric. Tucumán vol.91 no.1 Las Talitas jul. 2014
TRABAJO YA PUBLICADO
A biplot-based analysis for exploring interactions in sugarcane multienvironment trials with multiple harvests
Santiago Ostengo*, María I. Cuenya* and Mónica Balzarini**
* Sección Caña de Azúcar, EEAOC. santiagostengo@eeaoc.org.ar
** Consejo Nacional de Investigaciones Científicas y Tecnológicas (Conicet) y Facultad de Ciencias Agropecuarias, Universidad Nacional de Córdoba.
Abstract
Sugarcane breeding programs involve multienvironment trials (MET), where genotype yields are compared at different crop ages within and across locations. Temporal correlation among yield data from consecutive harvests per genotype and spatial correlations among data from neighboring plots are expected in each trial. It is also expected that the residual variances are not equal in different environments. Mixed Linear Models (MLM) based on the lack of independence and homogeneity of variance turn out to be more appropriate than classical analysis of variance of fixed effect models (ANOVA) to compare genotype performance and analyze genotype-location, genotype-age, and genotype-location-age interactions. MLM allow obtaining predictors of random terms (BLUPs) of interactions, which are useful to understand genotype-environment association (GE). This work proposes a graphical MLM-based approach to study interactions between genotypes and locations considering different crop ages. Data from MET of the Sugarcane Breeding Program of Estación Experimental Agroindustrial Obispo Colombres (Tucumán, Argentina) were analyzed. Twenty clones were compared with respect to cane production (tons per hectare) on six locations through three crop ages. An MLM was fitted with heterogeneous residual variances among locations and temporal and spatial correlations (based on a two-dimensional coordinate plot position). To model these correlations, a first order autoregressive model in three dimensions was applied, deriving from the direct product of temporal and spatial correlation matrixes. Location effect and genotype-location-age (GLA) interaction were considered random. Triple interaction BLUPs (GLA) were subjected to principal component and biplot analysis. Results were compared with the ones obtained with an additive main effect and multiplicative interaction (AMMI) biplot of GE interaction, where E is held as the combination of location and age factors. According to the Akaike Information Criterion and the likelihood-based test, the MLM was better than the ANOVA model assuming independent data and homogeneous variances. The biplot obtained from the triple interaction BLUPs facilitated the interpretation of genotype-age interactions for each location, and genotype-location interactions for different ages.
Key words: Predictors; Triple interaction; TUC 95-10.
Resumen
Análisis biplot para explorar interacciones en ensayos multiambientales de caña de azúcar con múltiples cosechas
Los programas de mejoramiento genético de caña de azúcar conducen ensayos multiambientales (EMA), donde se compara el rendimiento de los genotipos en diferentes edades de corte dentro y a través de localidades. En estos ensayos, se espera la presencia de posibles correlaciones temporales entre datos obtenidos en cosechas consecutivas y de correlaciones espaciales entre datos provenientes de parcelas vecinas. Se espera, además, que las varianzas residuales no sean iguales entre los diferentes ambientes. Los modelos lineales mixtos (MLM), basados en la pérdida de independencia y homogeneidad de varianzas, resultan ser más apropiados que el análisis de varianza clásico (Anova) de modelos de efectos fijos para comparar el desempeño de los genotipos y analizar las interacciones genotipo por localidad (GL), genotipos por edad (GE) y genotipo por edad por localidad (GLE). Los MLM permiten obtener predictores de términos aleatorios (BLUPs) de interacciones, los cuales pueden ser útiles para entender la asociación genotipo-ambiente (GA). Este trabajo propone una aproximación gráfica basada en MLM para estudiar interacciones entre genotipos y localidades considerando diferentes edades de corte. Se analizaron datos provenientes de EMA del Programa de Mejoramiento Genético de la Caña de Azúcar de la Estación Experimental Agroindustrial Obispo Colombres (Tucumán, R. Argentina). Se compararon 20 clones con respecto a rendimiento cultural (toneladas de caña por hectárea) en seis localidades a través de tres edades de corte. Se ajustó un MLM que contempla varianzas residuales homogéneas entre localidades y correlaciones temporales y espaciales (basadas en la posición de la parcela según coordenada bidimensional). Para modelar estas correlaciones se usó un modelo autorregresivo de orden uno en tres dimensiones (modelo tridimensional) derivado del producto directo entre las matrices de correlación temporal y espacial. El efecto localidad y la interacción genotipo-localidad-edad fueron considerados aleatorios. Los BLUPs de interacción triple (GLA) fueron sometidos a análisis de componentes principales y representación gráfica del tipo “biplot”. Los resultados se compararon con el obtenido con un “biplot” AMMI (análisis de efectos principales aditivos e interacción multiplicativa) de interacción (GA), donde el ambiente fue considerado como una combinación del efecto localidad y edad de corte. Según el Criterio de Información de Akaike y la prueba basada en verosimilitud, el modelo tridimensional fue mejor que el modelo Anova que asume independencia entre datos y varianzas residuales homogéneas. El “biplot” obtenido a partir de los BLUPs de interacción triple facilitó la interpretación de la interacción genotipo-edad para cada localidad y la interacción genotipo-localidad para las diferentes edades.
Palabras clave: Predictores; Interacción triple; TUC 95-10.
![]()
Introduction
Multi-environment trials (METs) are very important to study the interaction among genotypes and environments (GE). In sugarcane, environments represent different locations and different crop ages. It is therefore necessary to analyze genotype per location (GL), genotype per crop age (GA), and genotype per location per crop age (GLA) interactions. The additive main effect and multiplicative interaction model (AMMI) (Gauch and Zobel, 1988) and the sites regression model (SREG) (Crossa and Cornelius, 1997) have been used to study GE interaction in METs conducted during different crop ages. In these cases, the analyses are often performed considering environment as a combination of location and crop age (Chavanne et al., 2007; Queme et al., 2010). These strategies are framed within the analysis of variance of fixed effect models (ANOVA), where interaction terms are estimated under classical assumptions, such as the presence of homogeneous residual variances and independence among observations. However, two types of correlations are expected in these trials: temporal correlation among yield data from the same plot through crop ages and spatial correlations among data from neighboring plots. It is also expected that residual variances will not be equal in different environments. Correlated data analysis and the heteroscedasticity condition can be approached with mixed linear models (MLM), by modeling the variance and covariance structure of errors (Schabenberger and Pierce, 2002). In addition, mixed models allow predicting interaction terms when they are considered as random effects.
Therefore, they can be used to understand both double interactions (GL and GA) and triple interactions (GLA). This work proposes a graphical MLM-based approach to study interactions between genotypes and locations, considering different crop ages.
MATERIALS AND METHODS
Data derived from METs of the Sugarcane Breeding Program of Estación Experimental Agroindustrial Obispo Colombres, conducted on six locations of the sugarcane growing area in Tucumán, Argentina. Trials were planted in 2006, according to a randomized complete block design with three replications. Twenty genotypes were evaluated as regards tons of cane per hectare (TCH) through three crop ages. Among the genotypes tested, TUC 95-10 (released in 2011) was especially considered to illustrate the analytical approach for studying interactions.
A new approach for the interaction study was applied using a mixed model that includes heterogeneous residual variances among locations, and temporal and spatial correlations among data. The correlations were modelled for variance and covariance structure of residuals with a first orde autoregressive model in three dimensions (three-dimensional model). Dimensions given by rows and columns, to position the plot, were associated with spatial correlation, while crop age dimension was associated with temporal correlation. This model was compared to a null model, which considers the homogeneity of variance, and temporal and spatial independence among data. For both models, the effects of genotype, crop age and genotype per age interaction were considered fixed, while the effects of location, block within location and genotype per location, location per age and genotype per location per age interactions were considered as random. The models were adjusted by PROC MIXED, SAS, Versión 9.1. (SAS Institute, 2003). Model comparison was based on the Akaike Information Criterion (AIC) and the Likelihood Ratio Test (LRT).
Double (GL) and triple (GLA) interaction predictors (e- BLUPs), obtained from the best model, were subjected to a principal components analysis and subsequent biplot graph to explore the main interaction patterns. In addition, an AMMI biplot considering environment as a combination of location and crop age was obtained in order to contrast results attained by using e-BLUPs.
RESULTS
AIC values and the LRT showed that the model including temporal and spatial correlations and heterogeneous residual variances across locations presented a better fit than the null model (Table 1).
Table 1. Akaike criteria (AIC) and (-2 Log) verisimilitude values (-2L) of two models.

P = number of model parameters.
*Better adjustments according to AIC (minimum value) and LRT (p<0.05).
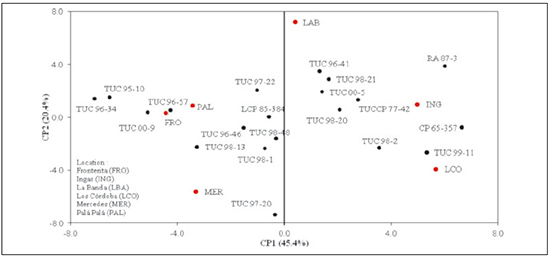
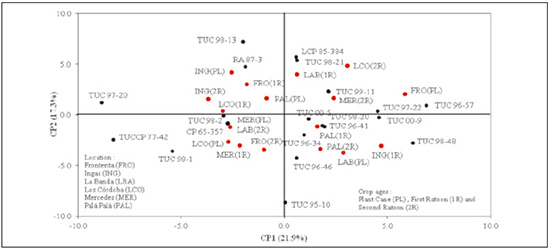
Figures 1 and 2 show the biplot graphs obtained with GL and GLA interaction predictors, respectively. TUC 95-10 interacts negatively with Ingas (ING) and Los Córdoba (LCO) locations (Figure 1). When analysing the triple biplot interaction, second ratoon and plant cane ages were the main contributors to this negative interaction for ING and LCO locations (Figure 2).
Figure 1. Principal component analysis biplot of the genotype per location (GL) interaction predictors (three-dimensional model).
Figure 2. Principal component analysis biplot of the genotype per location per crop age (GLA) interaction predictors (threedimensional model).
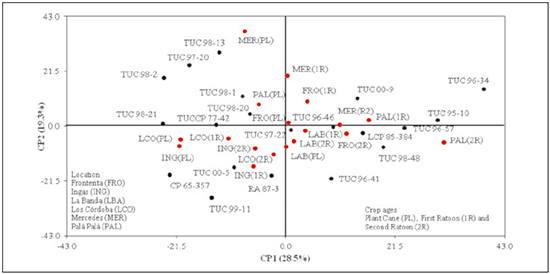
In the case of AMMI (Figure 3), the environments grouped better by locations than by ages, because age effect was masked by location effect. Therefore, considering environment as a combination of location and age made it more difficult to interpret genotype per age interactions within each location.
Figure 3. Additive main affect and multiplicative interaction model (AMMI) biplot considering environment as a combination of location and crop age.
CONCLUSIONS
MLM allowed studying the interaction at a three-way classification level (genotype, location and crop age), and the results are consistent as the e-BLUPs were obtained from models with correlations and heterogeneities. Biplots based on triple interaction predictors also facilitate the interpretation of crop age per genotype interactions within each location, in contrast to traditional analyses.
Cited references
1. Chavanne, E. R.; S. Ostengo; M. B. García y M. I. Cuenya. 2007. Evaluación del comportamiento productivo de cultivares de caña de azúcar (Saccharum spp.) a través de diferentes ambientes en Tucumán, aplicando la técnica estadística "GGE biplot". Rev. Ind. y Agríc. de Tucumán 84 (2): 19-24.
2. [ Links ] Crossa, J. and P. Cornelius. 1997. Sites regression and shifted multiplicative model clustering cultivar trial sites under heterogeneity of error variances. Crop Sci. 37: 406-415. [ Links ]
3. Gauch Jr., H. G. and R. W. Zobel. 1988. Predictive and postdictive success of statistical analyses of yield trials. Theor. Appl. Genet. 76: 1-10. [ Links ]
4. Queme, J. L.; H. Orozco and M. Melgar. 2010. GGE biplot analysis used to evaluate cane yield of sugarcane (Saccharum spp.) cultivars across sites and crop cycles. Proc. ISSCT 27: 584-590.
5. [ Links ] SAS Institute. 2003. SAS/STAT release 9.1. SAS Inst.,
6. Schabenberger, O. and F. Pierce. 2002. Contemporary statistical models for the plant and soil sciences. CRC Press, Boca Raton, Florida, USA. [ Links ]


