


 Article in xml format
 Article references
 Send this article by e-mail
 Cited by SciELO
  Similars in
SciELO
Similars in
SciELO 
 Permalink
Introducción
Yerba mate (Ilex paraguariensis St. Hil.) is a native tree species from the Paranaense rainforest, which includes parts of Brazil, Argentina, Paraguay and Uruguay, which is used in the main agricultural activities of the region while preparing the commercial product known as "processed yerba mate". Yerba mate infusions are appreciated among consumers for their stimulating and antioxidant effect due to the presence of its phytochemical compounds.
Yerba mate contains a wide variety of compounds: amino acids, phenolic compounds (caffeic derivatives and flavonoids), minerals and vitamins. In yerba mate leaves 78% of the total phenolic fraction is represented by chlorogenic acids [1, 2].
Several therapeutic properties are attributed to phenolic compounds including anticarcinogenic, antidiabetic, antiobesity, hypocholesterolemic, antihypertensive, cardioprotective, among others [3]. The content of phenolic compounds in yerba mate is strongly associated with its antioxidant capacity; they are strong reducing agents capable of providing protection to the body against oxidative stress, which is associated with a reduced risk of degenerative and chronic inflammatory diseases, related to the ability to chelate metals, inhibit lipoxygenase and scavenge free radicals [3]. In the body, phenolic compounds help inhibit oxidation of low-density lipoprotein (LDL), help retaining high-density lipoprotein (HDL), and eliminate problematic low-density lipoprotein (LDL or "bad" cholesterol). [4,5]. The ability to prevent lipid peroxidation is also applied in food preservation technology.
As the number of phenolic compounds in yerba mate is significant, the plant may be a potential natural source of polyphenols for commercial purposes. The interest in new applications of yerba mate, such as liquid extracts, dehydrates and concentrates for the development of new products, requires the extraction to be carried out under process conditions that preserve the content of the bioactive compounds.
Numerous authors have investigated the solid-liquid extraction of phenolic compounds and antioxidants from different plant matrices such as black tea, green tea, grape seeds and soybean [4, 6, 7, 8, 9, 10, 11, 12]. Conventional techniques were used for the extraction of these compounds, which required knowledge about the optimal combination of variables such as temperature, solvent solid ratios and extraction times [11, 13, 14, 15, 16, 17, 18].
Studies have been reported on the content of total phenolic compounds and their antioxidant properties in yerba mate leaves [19, 20, 21, 22, 23, 24]; however, there are few studies related to the extraction kinetics of phenolic compounds in yerba mate leaves and the conditions for their operation on an industrial scale [20, 25, 26, 27, 28].
The study and modelling of extraction kinetics is essential to optimize the extraction systems. First-order or steady-state [6,10, 28, 29, 30], second-order [31, 32, 33, 34] and second-order diffusion [26, 35, 36, 37, 38] kinetic models are often used to describe the solid-liquid extraction mechanism and the variables involved in the process.
The aim of this work was to study and model the kinetics of aqueous extraction of phenolic compounds from yerba mate leaves and to evaluate the influence of the working temperature on the proposed kinetic parameters in relation to the concentration and speed of extraction.
Materials y methods
2.1 Yerba mate
The yerba mate was supplied by Establecimiento Las Marías, Virasoro, Corrientes, (Argentina), 2015 harvest. The fraction of coarse leaves was used, zapped, de-stemmed, ground in a laboratory scale blade grinder and sieved (40 mesh) where the portions considered as yerba mate leaves are retained.
2.2 Reagents and solvents
The reagents used were anhydrous gallic acid (Biopack, Argentina), Folin-Ciocalteu reagent (Anedra, Argentina), and anhydrous sodium carbonate (Merck, Germany). The water used as solvent was treated by reverse osmosis (ROMI 100, HIDROLIT, Argentina).
2.3 Batch extraction
The experiments were carried out in a SCHOTT GERATE thermostatic bath, model CT1150, with a differential temperature control system (± 0.1 °C). A 500 mL glass beaker, supported inside the bath, was used as a reactor [25].
Stirring was performed with a 60 mm diameter propeller stirrer placed on the axis of the beaker one centimeter from the bottom. The extraction temperature was monitored with an electronic thermometer (± 0.1 °C, Hanna HI-9063). The stirring speed used was 400 rpm for the ratio of 25 g yerba mate leaves /200 mL water; this stirring speed is sufficient to achieve good mixing and facilitate optimal mass transfer. Kinetic runs were carried out at four temperatures: 40°C, 50°C, 60°C and 70°C using contact times for extraction in the range 0.5 - 60 minutes. At zero-time, yerba mate leaves were added and left in contact with the solvent for the corresponding extraction time. Once the times were reached, the leaves were separated and the suspension was filtered. The extracts were then centrifuged at 2500 rpm and phenolic compounds were determined using the supernatant fraction.
2.4 Determination of total phenolic compounds
The determination of phenolic compounds was performed by the Folin-Ciocalteu technique following the methodology described by ISO 14502 [39]. 1 mL of the extract was diluted (1:5) and then (1:100) with distilled water. 1 mL of the latter solution was taken and placed in a test tube. Subsequently, 5 mL of 10 % Folin-Ciocalteu's reagent was added. After 8 minutes, 4 mL of 7.5% Na2CO3 was added. A standard curve was made with anhydrous gallic acid, the concentration range of which was 10 to 50 ug/L. Absorbance was read using a UV-visible spectrophotometer (SHIMADZU, model 2250) at a wavelength of 765 nm. The samples were analysed in triplicate and the final concentration was expressed as g GSD/100 g dry yerba mate.
2.5 Mathematical modelling of extraction kinetics
2.5.1 Spiro and Jago pseudo-first order kinetics(1982)
Equations (1) and (2) were used to represent the expression of the pseudo first order steady state kinetic model of Spiro and Jago [6]:

In (1) the term on the left-hand side represents the rate of accumulation of the solute and on the right-hand side, the net rate from the solid to the liquid phase, where 'c' is the concentration at time t (g AGE/100 g dried yerba mate), '' is the equilibrium concentration at infinite time (g AGE/100 g dried yerba mate), 'k_obs' is the rate constant (min-1).
Equation (2) represents a straight line with a slope equal to k_obs and an intersection of the curve with the y-axis with ordinate value "a".
2.5.2Second Order Kinetics
Due to the similarity of the extraction curves (concentration of phenolic compounds versus time), with the sorption curves (moisture content versus time), the extraction process was described with the model proposed by Peleg [31] (Eq. 3) modified by Bucic-Kojic [9] for a solid-liquid extraction process (Eq. 4):
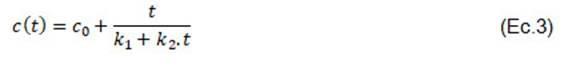
Where "c(t)" is the concentration of total phenolic compounds for time t (g EAG 100 g dried yerba mate), "t" the extraction time (min), "c_0" is the initial value of the concentration of total phenolic compounds for time t = 0 (g EAG /100 g dried yerba mate), "k_1" is the second order rate constant (min.100 g /g EAG) and "k_2" (100 g g EAG) is the second order capacity constant, with which the equilibrium concentration of the components was obtained (Eq.4):

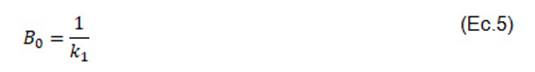
The extraction velocity value at the initial time "B_0" (t=t_0) is related to the constant "k_1" and was calculated according to (Eq.5):
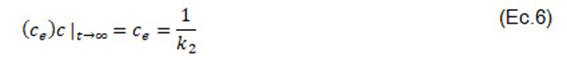
From the constant "k_2" the maximum extraction yield, i.e. the equilibrium concentration of the extracted phenolic compounds "(c_e )" over time was expressed. The maximum extraction yield (c_e ) was obtained as follows (Eq.6)
2.5.3Second-order diffusive model
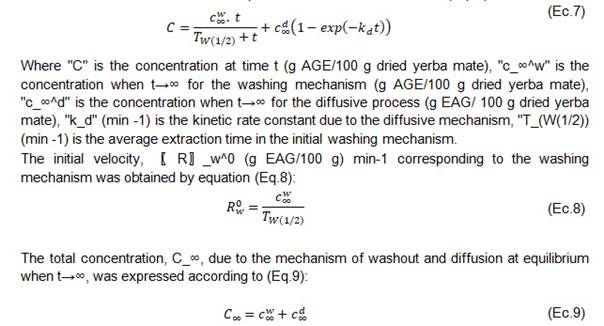
In the microstructure of yerba mate leaves, the bioactive components are distributed non- homogeneously. At the beginning of an extraction process, there is a rapid mass transfer of the metabolites into solution and then tends to a plateau or equilibrium. Therefore, the overall extraction process can be explained with the second-order diffusive kinetic model proposed by Linares et al [26], as the addition of two different mass transfer mechanisms treated separately. The equation is represented by two terms that assume two diffusive processes of different rates: a first stage of washing and swelling mechanism and a second stage of diffusive mechanism of the solid components in the extraction solvent (Eq. 7):
2.5.4 Influence of temperature
The influence of the extraction temperature on the kinetic constants was analysed by means of the Arrhenius equation, whose linearized expression has the form (Eq.10):
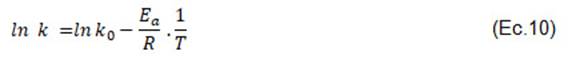
Where:
k_0: is the kinetic constant of the model.
R: the universal gas constant (8.314 J / mol K).
T: the absolute temperature (K).
The influence of temperature was studied from the velocity constant B_0 (1/k_1 ). From the representation of ln 1/k_1 vs 1/T with slope -E_a/R the activation energy for phenolic compounds E_a (kJ / mol) was obtained.
2.6 Statistical análisis
Statistical analysis was performed with Statgraphics Centurion XVII, version 17.2.00 (Manugistics, Inc., USA) and GraphPadPrism 5.04 for Windows (GraphPad Software, Inc., La Jolla, CA, USA). Experimental data were analysed by the statistical method of analysis of variance (ANOVA). Results were reported at 95% confidence level. Equation constants were estimated by linear and non-linear regression on the proposed mathematical models. The goodness of fit was assessed with the parameters RMSE (root mean square error) (Eq.11), MBE (mean deviation error) (Eq.12), R2 (coefficient of determination) and EP % (percentage error) (Eq.13).
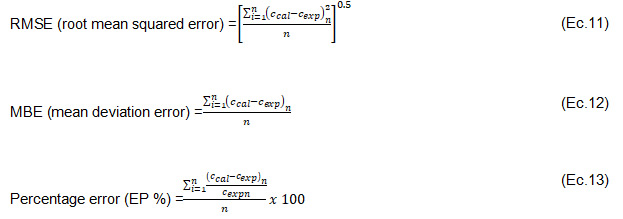
Where "c_cal" is the calculated value, "c_exp" is the experimental value and "n" is the number of determinations. A good fit was indicated by low values of RMSE, MBE, R2 > 0,85 and percentage errors EP % 10 %.
Results and discussion
Statistical analysis of the experimental data (multifactorial ANOVA -Analysis of Variance-) showed that time and temperature significantly influenced the concentration of phenolic compounds (p0.05).
Table 1 shows the concentrations of phenolic compounds for the temperature range between 40 and 70°C. at experimental times between 0.5 and 60 minutes.
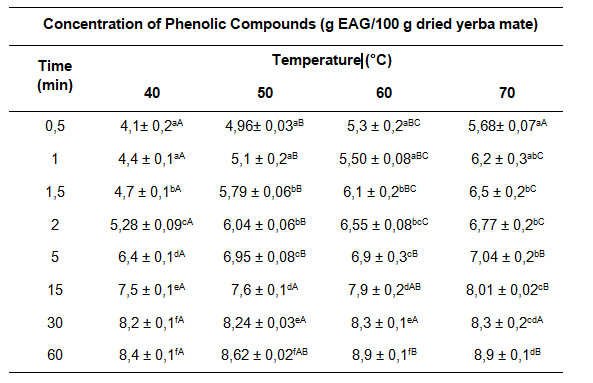
Table 1: Content of phenolic compounds obtained from yerba mate leavesin aqueous extraction at different extraction times and temperatures.
Data are expressed as mean ± standard error. Different superscripts in the same column or row (columns in lower case and rows in upper case) indicate that there are significant differences (p<0.05), for each of the separate determinations.
Extraction time had a significant effect on the content of total phenolic compounds (p<0.05). A higher content of phenolic compounds was observed using longer extraction times, in combination with increasing working temperature. The increase in the content of phenolic compounds in the extracts may be mainly related to the mechanism of swelling and dilatation of the capillaries of the yerba mate leaves in the initial stage of the extraction process. Similar results were reported in the washing stage of the aqueous extraction of soluble compounds from yerba mate and rosehip tea with hibiscus [26, 40].
The extraction kinetics of phenolic compounds were studied by evaluating the fit to experimental data of the pseudo first-order [6], second-order [9] and second-order diffusive models [26].
Table 2 shows the values of the kinetic constants of the Spiro and Jago (1982) [6] equation and the goodness of fit of the model, for the extraction of phenolic compounds at 40, 50, 60 and 70°C.
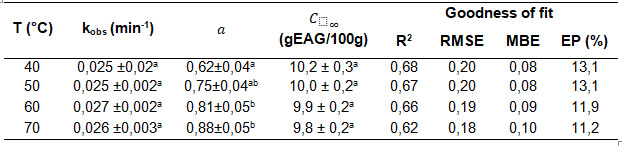
Table 2: Values of the observed kinetic constants of the Spiro and Jago (1982) equation, and the goodness of fit of the model for the extraction of phenolic compounds at 40, 50, 60 and 70°C.
Data are expressed as mean ± standard error. * Different superscripts in the same column indicate that there are significant differences (p<0.05), for each of the separate determinations
A good fit to the experimental data was not achieved using the pseudo first order model of Spiro and Jago [6]. Table 2 shows low values of the coefficient of determination (R2< 0.85) and values of the percentage error EP% > 10 %. Positive MBE values indicated that the model predicts values that are slightly overestimated with respect to the experimental data.
The Spiro & Jago model [6] is commonly used for fitting experimental data in the kinetics of solute extraction in different plant extracts [6, 8]. Table 2 shows that, in the extraction of phenolic compounds, the values obtained from the intersection "a" increased with temperature. The value of the empirical constant of "a" influenced the model error, the evaluation of the final equilibrium concentration and the kinetic parameters (R2<0.68).
This model typically provides an acceptable linear fit for aqueous extraction processes [26, 29, 30], however, there are studies of model error associated with extending the analysis to a large number of sheets or particles in solution with the same diffusion properties and considering that swelling has been completed before the onset of infusion, affecting the samples analysed differently [41, 42]. Researchers indicate that the non-zero intersection term, "a", predicts high initial mass transfer rates due to the gradient that arises immediately in the surface regions of the solid [41] and that early points before t=0.1 influence the model uncertainty in the first instants of extraction [41].
The second-order empirical model (Eq.4) of two parameters k_1 and k_2 describes the continuous change of the kinetics towards asymptotic equilibrium, from which the values of the initial extraction rate "B_0" and the final equilibrium concentration "C_eq" obtained from Eq. 5 and 6, respectively, can be calculated. The kinetic data for the extraction of phenolic compounds with the second order model are presented in Table 3.
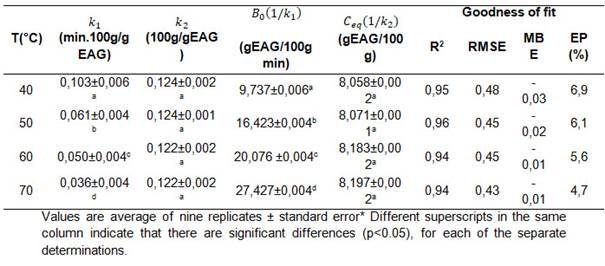
Table 3: Values of the constants k_1 and k_2 of the second order equation, speed B_0, the equilibrium concentration C_eq and the goodness of fit of the model for the extraction of phenolic compounds at 40, 50, 60 and 70 °C.
The fit of the second-order model to the experimental data was good, as shown by the R2, RSME, MBE and EP % values. Negative MBE results indicated that the values predicted by the model are underestimated with respect to the experimental values.
Analysis of variance (ANOVA) on the kinetic parameter values of the model, within the range studied, showed that temperature did not influence the kinetic constant k_2 at equilibrium concentrations C_eq (p>0.05). However, it was observed that with increasing temperature the kinetic constant k_1 decreased, which correlated with a significant increase in the initial velocity B_0 (1/k_1) (p<0.05).
The maximum initial extraction rate of phenolic compounds" 𝐵 0 "was achieved at the temperature of 70°C (27.427±0.004 g EAG/100g min), while, for the same extraction times, the lowest initial rate was obtained at the temperature of 40°C (9.737± 0.006 g EAG/100g min). These results are in agreement with those found by Cacace and Mazza [16], who stated that with increasing temperature, the initial diffusion rate and solubility of the extracted phenolic compounds increase [11].
The values obtained for the total content of phenolic compounds at equilibrium, C eq , are in the range of the values reported in "hot mate" infusions by Hartwig [20], Bravo [21] and in encapsulated aqueous yerba mate extract subjected to different drying conditions, reported by Vera [43].
Figure 1 shows the experimental data and those predicted with the second-order model (Eq.4) for the extraction of phenolic compounds at a ratio of 25 g yerba mate leaves /0.2 L water in the range between 40 and 70°C.

Figure 1: Experimental data and predicted by the second order model for the extraction of phenolic compounds.
During the first minutes of the extraction process, a steep rise in the concentration of phenolic compounds is observed, followed by a slower stage, asymptotically approaching the equilibrium concentration.
These aqueous extraction kinetics curves of yerba mate phenolic compounds obtained in the temperature range of 40 to 70°C were similar to those reported for grape seeds by Bucić-Kojić [9], grape pomace by Amendola et al [14] and soybean extracts by Jokić et al [11].
La variación de los parámetros cinéticos del modelo de segundo orden con la temperatura se evaluó mediante la ecuación de Arrhenius (Ec.12). En la Figura 2 se muestra la representación de la ecuación de Arrhenius linealizada para las constantes de las velocidades iniciales de extracción acuosa de compuestos fenólicos a las distintas temperaturas. La energía de activacióncalculada a partir de la pendiente de la recta fue de.
The variation of the kinetic parameters of the second order model with its temperature was evaluated by using the Arrhenius equation (Eq.12). Figure 2 shows the representation of the linearized Arrhenius equation for the initial rate constants of aqueous extraction of phenolic compounds at different temperatures. The activation energy calculated from the slope of the line was 30 4 kJ.mol-1 (r2=0,9).

The calculated activation energy value is in the order of those reported by Linares et al [26] for the aqueous extraction of soluble solids from yerba mate leaves in the same temperature range of 21,9 ± 3,8 kJ mol-1 (r2 = 0,8) and that obtained for the extraction of phenolic compounds from grape seeds of 23,47 kJ mol-1 (r2 = 0,9) at temperatures between 25 and 80°C by Bucic-Kojic et al [18].
The goodness-of-fit parameters of the second-order diffusive kinetic model of Linares et al [26] are shown in Table 4 and the model fit curves in Figure 3.
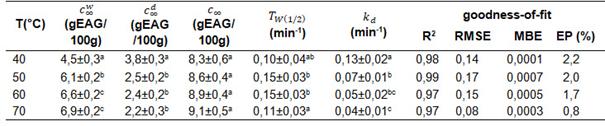
Table 4: Values of the kinetic constants of the second order diffusive kinetic model and goodness of fit for the extraction of phenolic compounds at 40, 50, 60 and 70 °C.
Values are average of nine replicates ± standard error. Different superscripts in the same column indicate that there are significant differences (p<0.05), for each of the separate determinations.
The R2 values close to 1, small RMSE values and the EP % less than 10% indicated the good fit of the model to describe the aqueous extraction kinetics of phenolic compounds from yerba mate leaves with two mass transfer mechanisms: fast stage (washing) followed by a slow stage (diffusion).
During the first minutes of the extraction process, a rapid increase of the initial concentration( was observed due to the swelling of the solid material (washout mechanism) followed by the asymptotic decrease of the concentration values due to the diffusion of the compounds (diffusive mechanism) until equilibrium was reached (Figure 3).
Figure 3: Experimental data and data predicted by the second-order diffusive kinetic model for the extraction of phenolic compounds from yerba mate leaves.
When comparing the values obtained for the parameters and corresponding to the washing and diffusion mechanism, for the same temperature range, the values of de were higher with respect to the concentration values of the diffusive mechanism (p<0,05).
Analysis of variance (ANOVA) indicated that temperature influenced the final concentration of phenolic compounds corresponding to the washing stage, , and the diffusion stag (p 0.05). At the temperature of 40 ºC, the lowest final concentration value was observed in the washing stage (4.5 g ± 0.3 EAG/100g) and the highest concentration value in the diffusive mechanism stage (3.8 ± 0.3 EAG/100g).
The extraction temperature did not influence the total equilibrium concentration (p 0,05); this may be because once the equilibrium concentration is reached above a certain temperature the stability of the bioactive components may be affected due to chemical degradation or thermal decomposition losses [44, 16].
Table 5 shows the initial velocity values o obtained from the concentration and the average extraction time corresponding to the washing mechanism.
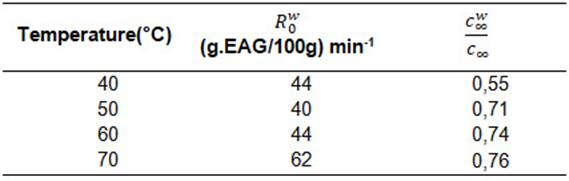
Table 5: Initial speed of the washing mechanism and ratio of wash equilibrium concentration to total equilibrium concentration, model of Linares et al. (2010) at 40, 50, 60 and 70 °C.
The total equilibrium concentration() in relation to the concentration of the washing mechanism increased in the range of 55 to 76% with increasing temperature, indicating the higher extraction and concentration of phenolic compounds in this first stage.
In the diffusive mechanism, the kinetic constant k_d values decrease with increasing temperature (p<0.05), which can be attributed to changes in the mixing behaviour or dilution effects [38].
In general, in two-stage extraction mechanisms, the highest speed and concentration is observed in the first extraction or washing stage [26, 37], a phenomenon indicative of the fact that these compounds are readily available on the surface of the solid, allowing their rapid extraction [38]. Although the extraction process is favoured at higher temperatures in the initial extraction stage, the equilibrium concentration is not significantly influenced by temperature [37]. Therefore, the extraction of phenolic compounds from yerba mate leaves should be carried out at lower working temperatures (40° and 50° C), thus avoiding possible partial degradation of these compounds, with potential energy savings in the industrial extraction process.
Conclusions
In the study of aqueous extraction kinetics, the experimental results showed that the extraction time and temperature significantly influence the extraction rates of phenolic compounds from yerba mate leaves. Based on the statistical indicators, the best fits were obtained with the second-order and diffusive second-order models, which allows their application for the modelling and optimization of the solid-liquid extraction process in aqueous extracts of yerba mate, in the temperature range studied. It was observed that the extraction temperature influences the initial velocity, being a relevant parameter for the optimization of the extraction process. Increasing the temperature increases the initial extraction speed, but does not significantly alter the final equilibrium concentration. Knowing the average extraction times of the phenolic compounds allows the choice of the initial temperatures that accelerate the extraction speeds in the first stage, as well as the overall process temperature that preserves the availability of these compounds and reduces the energy consumption in the industrialization of the extraction.
Agradecimientos
This research was partially supported by the FCEQyN-UNaM (Faculty of Exact, Chemical and Natural Sciences of the National University of Misiones).Ing. López Gabriela Gisela holds an Internal Doctoral Scholarship, awarded by (CONICET: National Scientific and Technical Research Council) and is pursuing her PhD in Applied Sciences at the FCEQyN (UNaM). The authors would like to thank the students Cinthia Melany Demorani and Rebeca Vogel Ester, both scholarship holders at the Argentine Institute of Yerba Mate (INYM) for their collaboration in the development of the extraction processes.

