


 Articulo en XML
 Referencias del artículo
 Enviar articulo por email
 Citado por SciELO
  Similares en
SciELO
Similares en
SciELO 
 Permalink
Introduction
Currently, the disproportionate growth in the volume and complexity of waste is endangering the capacity of nature to sustain our needs and those of future generations.
According to the Municipal Solid Urban Waste Management Plan - Posadas [1], construction and demolition waste (CDW) represents more than 15% of all waste generated in Posadas.
In Latin America, 75.3% of the population resides in cities with more than 10,000 inhabitants and almost 60% in large urban agglomerations with more than 100,000 inhabitants [2].
Particularly in Argentina, the level of urban population is 92%, with 21 Metropolitan Areas of more than 100,000 inhabitants [3].
Within this context, the Metropolitan Area of Misiones Province (AMPGC) is highly urbanised, with 98% of its population living in the cities of Posadas, Garupá and Candelaria.
According to the National Population, Household and Housing Census [3], the number of private homes surveyed in the AMPGC was 81,536.
The report on Territoriality, City Economy and Social Structuring [4] shows that, considering only the three large conglomerates of social housing, built by the Provincial Institute for Housing Development (IProDHa) and the Yacyretá Binational Entity (EBY), which exceed 10,000 dwellings each, 40% of the construction typology of the AMPGC is concentrated in the AMPGC. This does not include the smaller neighbourhoods built by both organisations in the rest of the Metropolitan Area.
Currently, the CDW generated in the AMPGC is disposed of in open dumps, causing pollution of the physical-natural, socio-economic and cultural environments.
It is therefore essential to create systematic processes of data collection, processing and analysis to support decision making, evaluation, control and improvement of waste management systems.
Numerous research studies have developed models that estimate the volume and characteristics of CDW from the project design stage. In this way, the possible types of waste generated at the construction site are established [5]-[7].
Other researchers have established indicators and estimation parameters describing CDW [8], [9].
Entre estos estudios existe un trabajo en el cual se presenta un sistema basado en BuildingInformationModelling (BIM) para la Estimación y Planificación de la Demolición y Renovación de Edificios en Hong Kong [10], con limitaciones basadas en el proceso y la tecnología que no permiten expresar en forma exacta el volumen de los RCD.
Consecuentemente, existen trabajos que incorporaron TIC para cuantificar los materiales consumidos en los proyectos de construcción [11].
Among these studies, there is a paper presenting a Building Information Modelling (BIM)-based system for Estimation and Planning of Building Demolition and Renovation in Hong Kong [10], with limitations based on process and technology that do not allow the volume of CDW to be accurately expressed.
Consequently, there are works that incorporated ICT to quantify the materials consumed in construction projects [11].
Accordingly, it is essential to reduce CDW before it is generated and to treat the resulting waste as a resource in order to minimise the environmental impact and preserve natural resources; therefore, it is interesting to know the CDW that will be generated in a project, which will allow waste management plans to be established according to its size.
This research makes it possible to identify and quantify accurately, in the project phase, the CDW, as well as its origin in relation to the construction materials, by applying the Weighted Transfer Method.
The purpose of this method is to determine, during the planning stage of the construction project, the amount of CDW that will be generated, following the hypothesis that the waste is proportional to the amount of materials consumed during the execution stage of the work. Therefore, the coefficients used to measure the amount of materials consumed were obtained from the study of different construction processes, which are used as a reference in the original research [12].
Although there are currently different ICT developments that allow the parameters of construction elements and materials to be obtained automatically from a BIM model using the measurement of 3D objects or the construction elements of the project, which speeds up the design process and the execution of construction tasks, they do not take into account the packaging materials of each element.
Therefore, the main objective of this article is to present a method for the quantification of construction and demolition waste, analysing the information of each material element and then organising it according to the proposed weighting rules and methods, and the determined measurement criteria.
Materials and methods
The development of the CDW quantification model was carried out using the Method of Weighted Transfers (MTP), using as a starting point a known structure of classification and characterisation of CDW generated in the project.
Regarding the choice of the social housing prototype, IProDHaResolution N°195/17 [13] was considered, which replaced the MD/10 prototype of the tendered works to be built throughout the province with the CheRoga 14 prototype. The prototype does not include galleries, walls or perimeter fences, among other details, which presents a simpler design that facilitates future remodelling.
The research quantified and classified the waste expected to be generated in the construction of 154 social housing units with the CheRoga 14 prototype [14] in the ItaembéGuazú housing development in the city of Posadas.
Although the waste generated by the selected prototype is independent from the implementation site, the total waste may differ due to the volume of waste generated in the movement of soil necessary for the settlement of housing in the specific location.
On the other hand, the province of Misiones has a high housing deficit throughout its territory, which is even more evident in its metropolitan area, due to the concentration of inhabitants, which is reflected in a greater implementation of social housing in the cities of Posadas, Garupá and Candelaria.
The social housing units analysed consisted of units intended for social housing that conform to the CheRoga 14 prototype, with the following technical characteristics: (i) ceramic brick masonry construction; (ii) exterior carpentry complete with latticework; (iii) galvanised iron sheet roofing N°27; (iv) thermal insulation in ceilings; (v) interior and exterior plastering; (vi) cold water installation; vii) Electrical installation; viii) Installation for electric shower; ix) Tiles in bathroom, kitchen and laundry room; x) Glazed ceramic floors in bathrooms; xi) Latex paint in interiors and exteriors; xii) Protective perimeter pavement.
Figure 1 [14] shows the façade plan of the CheRoga 14 social housing.
The case study of this article presents the structural foundation of reinforced concrete slabs and reinforcement beams of the external perimeter of the slabs of this house.

Classification of CDW
In the absence of a system for the classification and characterisation of CDW at national or regional level, the European Waste List [15] was used to make this research more representative.
In order to identify the waste-generating elements, the method is based on the data contained in the tender documents and in the calculation and budget form submitted by the bidder to the Provincial Institute of Housing Development (IProDHa).
After coding each element of the project with the capacity to generate waste, the quantity of CDW expected in the execution stage of the work must be determined.
Although most of it will be construction materials, the previous cleaning and soil movement works will also be considered.
Conversion of consumed resources into generated waste
Once all the elements with the capacity to generate waste have been identified and quantified, the indirect measurement by the Weighted Transfer Method is applied, which serves as an instrument for determining the amount of CDW, based on the measurement of the construction elements that generate them. For this purpose, the following formula 1 [16] is used, a mathematical model generated from the MTP in which the hypothesis ofproportionality between the amount of waste generated and the amount of product consumed is accepted.
Qr=qx∑Qmn= (CRm x CTm x CCm) x ∑Qmn (Formula 1)
Where:
Qr = Quantity of waste
q = Coefficients of the material
Qmn = Amount of material provided by the waste for each category.
CRm = Material coefficient to measure the part of the source base or auxiliary item that becomes waste.
CCm = Material coefficient for converting the unit of measure of the source basic or auxiliary item into the unit of measure of the destination item.
CTm= Coefficient of the material to convert the measurement criterion of the source basic or auxiliary item into the measurement criterion of the destination item.
Quantification of the construction waste generated
Finally, the waste generated in the foundations of the 154 Che Roga14 social housing units in the ItaembéGuazú housing estate is quantified, expressing the results in the units of measurement associated with the calculation and budget spreadsheet presented, in order to finally classify and group the different CDW.
To carry out the case study and thus obtain the quantities of waste during the execution of the foundations of 154 social housing units, the process to be followed is as follows:
Classification of CDW
The waste generated in the structural foundations of reinforced concrete slabs was extracted from the European Waste List and found:
- 17 01 01 Concrete
- 17 04 05 Iron
- 17 01 05 Excavated soil
To identify the waste-generating elements, the data set out in the tender documents and in the project budget were used.
From the tender documents: given the topographical characteristics of the AMPGC, the soil movement aims to create reasonable slopes between the street, pavement and housing terrace, which do not affect pedestrian or vehicular access to the houses and ensure the drainage of rainwater from the bottom to the front of the lots and does not spill over to neighbouring lots.
From the project spreadsheet and budget: Excavation of foundations 172.48 m3.
From the bidding specifications: Reinforced concrete roof, minimum thickness: 0.10 m of H° A° 1:3:3 with a reticulated mesh of 1 Fe of 6 mm every 0.15 m in both directions and external perimeter reinforcement beams of 0.20 m x 0.20 m with 4 Fe of 8 mm and stirrups of Fe of 6 mm every 0.15 m.
From the project spreadsheet and budget: Reinforced Concrete Roof of 0.10 m - 357.48 m3.
- The excavated soil waste produced during the execution of the work corresponds to the total volume of soil removed as waste.
Waste generated:
- The concrete waste produced during the execution of the work corresponds to the volume of concrete that is not definitively integrated into the structure and is removed as waste.
- The iron waste produced during the execution of the work corresponds to the weight of iron that is not definitively integrated into the structure and is removed as waste.
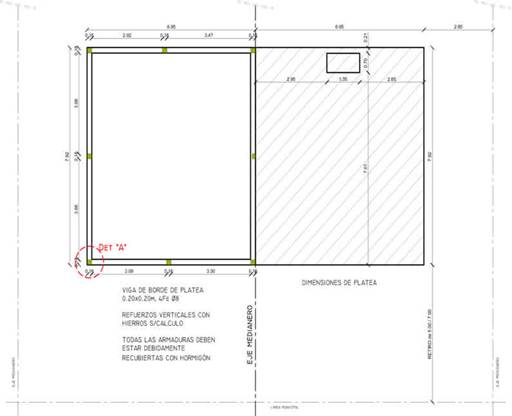
Figure 2 [14] shows the foundation plan of the external perimeter reinforcement slabs and beams.
Conversión de recursos consumidos en residuos generados
17 01 01 Hormigón
CR es igual a 0,01. El coeficiente de pérdidas que se convierte en residuo es el 1%. Las pérdidas globales consideradas habitualmente para determinar la cantidad de componentes en los precios unitarios son de 5%, pero de esos cinco puntos porcentuales sólo uno se convierte en residuo.
CC1 es igual a 1,00 porque la unidad de medida del elemento (m3 de hormigón) es la misma en el proyecto de construcción que en el plan de gestión de residuos.
CT es igual a 1,10 para el Hormigón.
En la tabla 1, se presenta la medición de residuos del hormigón armado.
Figure 2. Foundation plan of external perimeter reinforcement slabs and beams.
Conversion of consumed resources into generated waste
17 01 01 Concrete
CR is equal to 0.01. The loss ratio that becomes a residual is 1%. The overall losses usually considered for determining the amount of components in the unit prices are 5%, but of these five percentage points only one becomes a residual.
CC1 is equal to 1.00 because the unit of measurement of the element (m3 of concrete) is the same in the construction project as in the waste management plan.
CT is equal to 1.10 for Concrete.
In table 1 , the waste measurement of reinforced concrete is presented.

17 04 05 Iron
CR is equal to 0.01, the coefficient of losses that becomes waste is 1%.
CC1 is equal to 2.82 because the unit of measurement of the element (m2 of slab) is different in the construction project than in the waste management plan (the weight of the chasm mesh of 0.15 x 0.15 x 0.006 m of 6 x 2.40 m = 40.60 kg = 2.82 kg/m2) is 2.82 kg.
As the project budget only refers to the concrete of the slabs, to calculate the iron of the reinforcement beam, the perimeter of the 154 slabs (obtained from the prototype plan) is considered and multiplied by the 4 8mm irons that make up the beam.
CC2 is equal to 0.395 because the unit of measurement of the element (m of beams) is different in the construction project than in the waste management plan (weight of a 12 m bar of 8 mm iron = 4.74 kg/12 m = 0.395 kg/m) - Perimeter of the slab 29.80 m.
In relation to the stirrups, the perimeter of the 154 slabs is considered and multiplied by 6.66 (which is the number of stirrups every 0.15 m that fit into 1 m) and multiplied again by 0.6 m which is the perimeter of the stirrups for a beam of 0.20 m x 0.20 m.
CC3 is equal to 0.222 because the unit of measurement of the element (m of ties) is different in the construction project than in the waste management plan (weight of a 12 m bar of 6 mm iron = 2.664 kg/12 m = 0.222 kg/m) - Perimeter of the slab 29.80 m.
CT is equal to 1.00 for iron.
The measurement of Structural Iron residues is presented in table 2 .

- 17 01 05 Excavated soil
CR is equal to 1.00 when the soil is not used as backfill and is extracted as waste.
CC is equal to 1.00 because the unit of measurement of the element (m3 of soil) is the same in the construction project as in the waste management plan.
TC takes into account the change in soil volume after excavation, which takes place during clearing and excavation. The coefficient is 1.25, an average expansion value for different soil types.
In table 3, the measurement of foundation excavation waste is presented.

Results and discussion
The application of the Weighted Transfer Method demonstrates that it is possible to quantify the CDW expected to be generated during the construction phase of a building project.
Its development in a case study determined the quantities of waste concrete, steel and excavated soil generated during the execution of the foundations of 154 dwellings, as well as the total amount of material resources consumed in their execution.
The results show that of the 357.48 m3 of reinforced concrete consumed in the foundation of 154 reinforced concrete slabs and external perimeter reinforcement beams, 11.21m3 of concrete waste will be generated, of the 8,510.04 m2 of reticulated mesh plus the 36,695.24 m of structural iron, necessary for the reinforcement of the slabs and perimeter reinforcement beams, 352.01kg of iron waste will be generated.
In addition, for the remedial works, of the 172.48 m3 of excavation for foundations, 215.60 m3 of waste will be generated.
Table 4 shows the coefficients of the weighted transfer equation determined for the entire project.

Table 4: Coefficients and origin of the waste generated in the construction of 154 social housing units CheRoga 14.
Source: Own elaboration.
Conclusions
In accordance with the main objective of this work, the applied method allows the quantification of construction waste, analysing the information of each material element and then organising it according to the proposed weighting rules and the determined measurement criteria.
That is why its application will support decision making, evaluation, control and improvement of waste management systems, being able to selectively correlate the source material with its environmental impact or its cost.

