


 Inglés (pdf)
 Articulo en XML
 Referencias del artículo
 Enviar articulo por email
 Citado por SciELO
  Similares en
SciELO
Similares en
SciELO 
 Permalink
Introduction
Ice cream is a frozen dessert consumed worldwide by groups of all ages [1]. The meaning of the term "ice cream" varies from country to country, due to different regulations and traditions, and therefore covers a wide range of ingredients and compositions, as well as in terms of product texture and manufacturing processes. From a manufacturing point of view, ice cream can be categorized as industrial or artisanal depending on the process technologies and production scale [2].
Ice cream is made up of sugar, fat, emulsifiers, stabilizers, water, proteins, corn syrup, dextrose and flavorings. The final product is a three-phase system consisting of air, solid phase and liquid phase. The liquid phase contains ice crystals in embedded form and air cells in dispersed form. Milk proteins, soluble and insoluble salts, fat particles, stabilizers and sugars are also present in the liquid phase, which is why it is considered a complex food from a physical-chemical point of view [3]. It constitutes a healthy, nutritious and palatable dairy product [3] with a high cost value [4].
The ice cream production process typically comprises pasteurization, homogenization, aeration and freezing. This process has remained largely unchanged since mass production began. In the production of ice cream, the first stage consists of mixing a series of multiple liquid and solid ingredients in a certain order, in specific quantities and at specific temperatures, until a liquid mixture is obtained. After mixing, processing and pasteurization, the liquid is poured into an aeration machine that incorporates between 30% and 50% of air into the mixture (overrun). The resulting material is then kept at temperatures below 0 ºC, forming a diffusible semi-solid product.
Specific characteristics of the ice cream product such as flavor, structure and texture are determined by the quality of the ingredients used, the balance of the mixture and the manufacturing process. The standard mass composition of a milk-based ice cream is: 64% water, 18% sugar, 10% non-fat milk solids and 8% fat milk solids [5]. All these components are expected to have a stable structure, maintaining their characteristics below 0 ºC, with a smooth and uniform texture (without the appearance of ice crystals), diffusible (it can work at its preservation temperatures) and stable (maintain its characteristics at the service temperature) [6].
The standard chemical composition of ice cream is: fat 7-15%, milk protein 4-5%, lactose 5-7%, other sugars 12-16%, stabilizers, emulsifiers and flavors 0.5%, total solids 28-40%, and water 60-72% [7].
Stabilizers and emulsifiers are important ingredients in the production of ice cream. Stabilizers are added to increase viscosity, improve air incorporation and distribution, body and texture, storage stability, and mixing properties. Stabilizers also minimize the development of large crystals and provide the final structure to the product [8]. The most common stabilizers used are polysaccharides such as guar and locust bean gum, carboxymethylcellulose, carrageenans and xanthan gum [9].
Emulsifiers are sometimes integrated with stabilizers in proprietary mixes, but their function and action are very different from stabilizers. Emulsifiers are surfactants that operate in the ice cream fat phase, facilitating the mixing of fat and water. The presence of emulsifiers in ice cream contributes to a smoother texture and better shape retention, while improving the ability of the mix to incorporate air. The most common emulsifiers used are mono- and di-glycerides and ethoxylated esters of sorbitol (polysorbates) [9].
Cream is an important ingredient in the making of ice cream. It is a concentrated emulsion of milk lipid globules in skimmed milk, and it is separated from the milk either by gravity or centrifugal force [10].
Cocoa powder is a dry powder obtained by grinding cocoa beans and totally or partially extracting the fat or cocoa butter. Cocoa powder is used commonly to flavor cookies, ice cream, drinks and cakes. It is also used in the production of toppings for confectionery and frozen desserts. It is made with a proportion of cocoa that ranges between 25 and 32%, and is more or less degreased [11].
There are several authors who have studied ice cream production processes from a techno-economic point of view. In this sense, Bongers and Bakker [12] applied a modeling and simulation route to identify which bottleneck needs expansion, taking into account the costs and time required. The model was designed to quantify the influence of the work procedures, the minimum storage time of the mixtures, and the modifications and extensions of the equipment. Also, Carvalho et al. [13] defined an optimal planning and scheduling model based on a Resource Task Network, where profit maximization is developed taking into consideration the cost commitment relationship between the inventory-based methods of perishable raw materials on the planning horizon versus just-in-time raw material delivery policy. In addition, León et al. [14] designed a liquor-based cream ice cream production line in the city of Piura, Peru, determining several profitability indicators of the production process. Likewise, Sierra [15] carried out a feasibility study for the creation of a Thai-type, artisanal ice cream production plant with exotic organic fruits from Colombia in the city of Bogotá D.C., also conducting a financial study to determine the economic viability of the project. On the other hand, Castaño & Fuentes [16] determined the techno-economic feasibility of creating an ice cream production plant in Bogotá, Colombia. Finally, Banda et al. [17] designed a production process for the production of ice cream based on discarded banana in Piura, Peru, verifying the economic viability of the project.
Process simulation is the representation of a chemical process using a mathematical model, which is then solved to obtain information about the performance of the chemical process. It is also defined as the use of computers to carry out steady-state mass and energy balances, equipment sizing, and economic calculations in a chemical process [18].
A process simulator is software used for modeling the behavior of a chemical process in steady state, by determining pressures, temperatures, and flows. It can also be used to carry out equipment sizing, cost estimation, analysis and estimation of physical-chemical properties, operational analysis, and optimization of the operating conditions of new or existing plants [19]. Among the most used commercial and academic simulators today are Speed Up®, Design II®, Aspen Hysys®, ChemCAD®, PRO II® and SuperPro Designer®.
The SuperPro Designer® is a professional process simulator developed by Intelligen Incorporated, which facilitates the modeling, design, evaluation and optimization of integrated processes in a wide range of industries such as pharmaceutical, biotechnology, agrochemical, food, wastewater treatment and water purification, among others. It features several advanced and useful tools such as performing mass and energy balances, extensive databases of chemical components and mixtures, equipment sizing and costing, comprehensive economic calculations, characterization of waste streams, and it can handle both batch and continuous processes [20].
The SuperPro Designer® simulator has been used to simulate different processes and plants in the chemical industry, among which we can mention the optimization of the citric acid production process using a client-server interface [21]; the design of a plant for the production of the enzyme transglutaminase from potato residues [22]; obtaining process and cost models for an ethanol production plant from sugar beet juice [23]; the analysis of a wastewater treatment process using activated sludge [24]; the modeling of the partial demineralization of cow’s milk [25]; the economic analysis of oleoresin production from Capsicum frutescens through supercritical fluid extraction [26]; the techno-economic performance of three possible alternative technologies for the production of biodiesel from low-value inedible oil [27]; and the techno-economic analysis of hyaluronic acid production using Streptococcus zooepidemicus [28].
Currently, the most consumed and preferred ice cream flavor worldwide is chocolate, followed by vanilla [29] [30]. According to the criteria and opinion of executives and directors of various existing industrial-scale ice cream production plants in Cuba, chocolate ice cream is the most produced and marketed in the country, as Bofill [31] also noted during an optimization study carried out in a Cuban ice cream plant.
Although the production of ice cream is a well-established process on an industrial scale, the determination of the profitability and techno-economic feasibility of a production plant of this type, through the use of simulators such as SuperPro Designer®, is not available in the current literature. That is, to date the simulation of an industrial-scale ice cream production plant using a professional chemical process simulator like SuperPro Designer® has not been reported yet. Thus, it is required to simulate an industrial-scale ice cream production process in SuperPro Designer® simulator, in order to know how much will cost to erect and operate a production plant of this type and scale under the current economic conditions of Cuba, through the estimation of key productivity, profitability and economic indicators.
Considering the above, an ice cream production process was designed, simulated and economically evaluated with the aid of SuperPro Designer®, assuming that the production plant will be located in Camagüey province, Cuba, and will have a manufacturing capacity of approximately 808 containers of 10 L of chocolate ice cream per batch (961,520 L of ice cream per year). The main economic feasibility parameters were determined, and two sensitivity analyses were carried out to evaluate the influence of the fluid milk unit cost and interest rate on the Net Present Value (NPV) indicator, to determine from what value of these two parameters the technological proposal begins to be economically unprofitable.
Materials and methods
Description of the chocolate ice cream production process
The chocolate ice cream production process used in this work consists of the following stages: 1) Reception of milk and cream; 2) Preparation of the sugary saline solution; 3) Preparation of the mixture; 4) Filtration; 5) Homogenization; 6) Pasteurization and cooling; 7) Aging 8) Cooling 9) Freezing and air injection; and 10) Packaging and labeling. Each of these stages is described below.
Reception of milk and cream:
First, 2,058 kg of fluid cow milk and 671.52 kg of cream are pumped into two tanks of 4000 L capacity, using a diaphragm pump. Both milk and cream are analyzed for acidity to determine if they are suitable for consumption, as well as the percentage of fat, the percentage of non-fat solids, density and temperature.
Preparation of the sugary saline solution:
The sugar-saline solution (syrup) is prepared in two jacketed mixing tanks with a total capacity of 300 L. A total of 799.12 kg of refined sugar (sucrose) and 44.4 kg of common food grade sodium chloride are diluted in 300 L of water, at a rate of 150 L of water per tank.
Agitation is applied for 20 minutes and during this time the solution is maintained at a temperature of 60 ºC by circulating steam inside the jacket of both tanks. This favors the adequate dilution of both the refined sugar and the salt in the water.
Preparation of the mixture:
After having carried out the physical analyses on both the fluid cow milk and the cream, and confirming that they are within the parameters established by the process, both raw materials are pumped to the mixing tank. In this process, the sugary saline solution previously prepared is also pumped to this tank. The same centrifugal pump is used to carry out these pumping operations. 216.03 kg of skimmed milk powder; 133.19 kg of cocoa powder; 22.2 kg of Brigel L-6108 stabilizer and 235.07 kg of water are also added to this mixing tank, and the mixture is stirred for 30 minutes at a temperature of 60 ºC, for which steam flows inside of the jacket of this tank.
Filtration:
Once the agitation time has finished, the hot mixture at 60 ºC is pumped using a centrifugal pump towards two mesh filters, with the objective of removing foreign matter and suspended solids that were not diluted during the preparation process of the mixture.
Homogenization:
The mixture filtered and preheated to 60 ºC is then sent to a homogenizer, where the size reduction of all the particles of the mixture occurs, making them totally homogeneous. This is especially important for fat globules that might otherwise separate from the milk at later stages. In fact, the diameter of the fat globules is reduced to less than 2 µm, leading to a uniform fat distribution in the mixture. As such, the mixture becomes a genuine emulsion in this processing step. Homogenization occurs at a pressure of 96.5 bar (1,400 psi).
Pasteurization and cooling:
Pasteurization is carried out with the aim of eliminating pathogenic microorganisms that can harm the health of consumers and decompose the product. The mixture is pasteurized at a temperature of 78 ºC for a period of 15 seconds using steam, and then the pasteurized mixture is cooled in the same pasteurizer equipment using chilled water at 5 ºC, until a cold pasteurized mixture is obtained at approximately 14 ºC. Cooling is carried out to retard microbial development, giving greater durability to the cold pasteurized stream obtained in this stage.
Aging:
After being cooled in the pasteurizer, the mixture is sent to the aging tank where it is left to rest for 12 hours. The objective of this stage is to achieve the hydration of the proteins; the correct combination of the stabilizer with the water, making its function effective, and ensure the solidification of the fat globules.
Cooling:
After the aging step, the mixture is pumped through a plate and frame heat exchanger by means of a centrifugal pump, in order to be cooled to 8 ºC using chilled water at 5 ºC. The cold mixture leaving the cooler is then sent to a receiving tank with a capacity of 1,100 L and equipped with agitation. It is worth pointing out that in this stage sub-batches of 1,000 L are cooled in a stepwise manner; that is, first 1,000 L of the mixture coming from the aging tank are cooled in the heat exchanger, and then they are poured into the receiving tank to be processed in the next stage. Once the receiving tank has been emptied (i.e. the 1,000 L initially deposited is removed), another 1,000 L sub-batch of matured mixture is cooled and transferred to the receiving tank, and so on until all the mixture contained in the aging tank is processed. In this stage, 4 sub-batches of approximately 1,000 L each are carried out.
Freezing and air injection:
The cooled mixture contained in the receiving tank is sucked by the freezer unit pump at a flow rate of 750 L/h. Due to the transfer of heat from the mixture to the ammonia that surrounds the freezer tube, the mixture is whipped, aerated and scraped, gradually reducing its temperature and thus favoring the injection of air. This results in the formation of a consistent, smooth and firm ice cream at an outlet temperature of - 4 ºC. In this stage, air is incorporated into the mixture until it forms 50% of the mixture (referred as 50% overrun), and part of the remaining water (( 40.0%) is frozen. There is also approximately 10% that does not freeze because it is highly concentrated in this solution.
Packaging and labeling:
The ice cream obtained at the exit of the freezer equipment is packaged in containers at a rate of 10 L of ice cream per container, and then the containers are properly labeled with labels containing the information of the finished product batch, ingredients content, among other data of interest. Around 808 filled and labeled containers of chocolate ice cream are obtained per batch.
Figure 1 shows the block diagram of the chocolate ice cream production process described above.
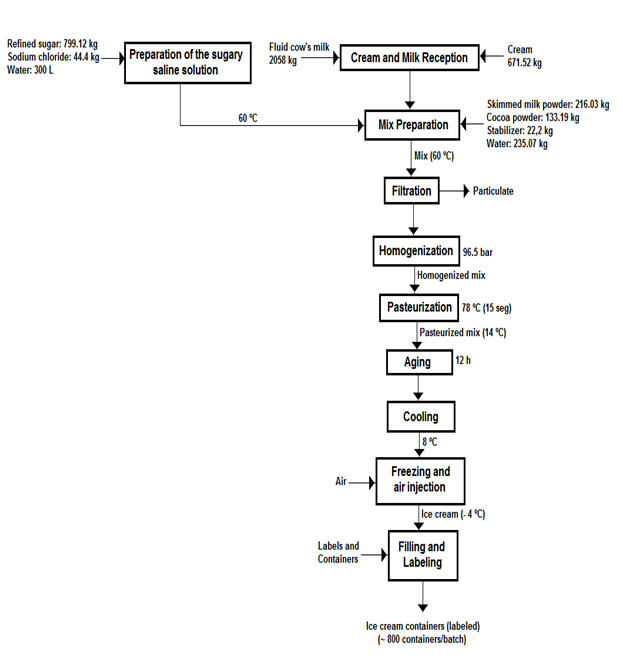
Figure 1: Block diagram of the chocolate ice cream production process.
Chemical composition of raw materials used in the process
Chemical composition of fluid cow milk, skimmed milk powder and cream
Liquid cow milk, skimmed milk powder and cream present the average percentage composition shown in Table 1 [32].

Table 1: Average chemical composition of fluid cow milk, skimmed milk powder and cream.
Chemical composition of cocoa powder
Cocoa powder presents the average percentage composition displayed in Table 2 [11].

Table 2: Average chemical composition of cocoa powder.
Unit cost of raw materials used in the process
Table 3 presents the unit costs of the raw materials consumed in the chocolate ice cream production process, which were taken from a real ice cream production plant currently installed and operating in the city of Camagüey, Cuba. The raw material requirements to produce a liter of chocolate ice cream are also shown in this table.
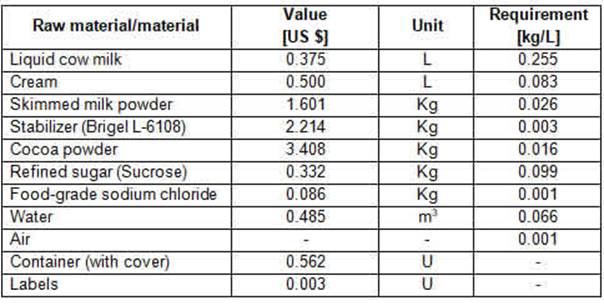
Table 3: Unit costs and material requirements for the raw materials used in the chocolate ice cream production process.
Equipment cost
Table 4 expresses the purchase costs of the main equipment used in the ice cream production process [33] [34] [35] [36] which were updated to August 2021 using the cost index from Chemical Engineering magazine [37]. Type 304 stainless steel was chosen as the construction material for the main equipment used in the production process.

Table 4: Purchase cost of the main equipment used in the production process.
Simulation of the chocolate ice cream production process in SuperPro Designer® simulator
The chocolate ice cream production process was simulated in SuperPro Designer®, which performs mass and energy balances and facilitates economic calculations. For the economic evaluation, it was considered that the working capital covers the expenses of 20 days of labor, raw materials, utilities and waste treatment; that the start-up and validation cost is 20% of the Direct Fixed Capital [38]; that the costs related to quality assurance and control in the laboratory are 15% of the total labor cost [38]; that around US $ 78,000 per year is spent on fuel consumption in the boiler (which will be included in the miscellaneous costs item of the annual operating cost as shown in Table 8); and that US $ 5,000 per year is spent for process validation operations [38]. The list of utilities employed and their unit costs are shown in Table 5.

Table 5: Utilities consumed in the ice cream production process and their unit costs.
The unit cost of electricity was considered as US $ 3.29/kWh, similar to the electricity cost of an existent industrial-scale ice cream production plant installed in the province of Camagüey, Cuba. It was assumed that 50 kWh per batch is consumed by equipment items not listed in the main production process. The salaries of the operators and supervisors were set to US $ 0.71/h and US $ 0.90/h, respectively. The plant operates 24 hours per day. The operators and supervisors work in two shifts of 12 hours each, while six operators and two supervisors per work shift will be necessary. A construction period of 10 months, a start-up period of 4 months and a projected life time of 20 years were considered. In addition, an interest rate of 11% was considered to determine the plant NPV [36].
It was assumed that it is a grass-rooted/green-field plant that will operate at 70% capacity during the first five years, at 80% capacity for the next five years (that is, from year 6 to 10), and at 100% capacity during the rest of its lifetime (from year 11 to 20). These values of percentage of capacity were considered taking into account the technical suggestions and recommendations of experienced managers and supervisors of a real ice cream production plant currently installed in Camagüey province, Cuba, which has about 35 years of uninterrupted operation.
The product failure rate was set to 15%, which means that 15% of the finished product (ice cream) produced per year is rejected or discarded because it does not meet the established quality parameters. In this case, the rejected ice cream is sent to pig farms. The income tax was considered to be 32%. A cycle time slack of 4 hours was assumed, leading to the execution of 140 batches of chocolate ice cream per year. The nominal production capacity was set to 808 containers/batch and a selling price of US $ 14.00 was chosen for the 10 L container of chocolate ice cream.
Aspects such as the real possibility of obtaining the required investment, the origin or source of this investment, the necessary financing rate and the possible restrictions or limitations that may exist during the investment process were not included in this work.
The facility-dependent cost was determined by SuperPro Designer® based on maintenance and depreciation options which were included in the Capital Investment Parameters section. Finally, research and development (R&D) costs, as well as advertising and selling (A&S) expenses, were not considered in this study. In this case, a research institute located in Havana city, Cuba, will assume the costs associated with R&D procedures and operations in order to obtain novel ice cream formulations and also to optimize the existing ones from the techno-economic point of view, and will transfer the acquired know-how to the ice cream plant evaluated in this work, while the A&S costs will be assumed by the head office to which the proposed ice cream production plant will be subordinated.
Economic evaluation parameters
SuperPro Designer® simulator can be used to calculate key economic parameters in preliminary studies, to evaluate the feasibility and economic profitability of a proposed process. The key parameters considered in this work are: the unit production cost, Return on Investment (ROI), NPV, Internal Rate of Return (IRR) and Payback Time (PT). The unit production cost is the ratio of the annual operating cost to the annual production rate. This is a significant variable of the sale price of the product and the profitability of the process, as well as a comparative basis with similar processes. ROI is a measure of profitability calculated as the ratio of net profit to total investment, and is used to evaluate the viability of an investment or to compare the profitability of a number of different investments. However, the ROI does not take into account the time value of money. The NPV, which considers the value of money over time, is the difference between the present value of all accumulated and positive expected cash flows with all cash expenditures, such as capital investment. The NPV is a measure of the feasibility of the proposed process. The IRR, also called the discounted cash flow rate of return or the true rate of return, is a discount rate that makes the NPV equal to zero over a predetermined life of the project. The IRR is generally a suitable comparative basis for the project with respect to its local economic environment. Finally, the PT refers to the duration required for the total return to equal the capital investment [23] [33] [39].
Sensitivity analysis
SuperPro Designer® could be employed to accomplish a sensitivity analysis with respect to strategic design parameters after the model has been developed. Besides, the changes of the value of a certain parameter to determine its influence in a global economic parameter is important with the objective of analyzing the techno-economic fluctuation or discover an opportunity to optimize the project [40].
According to experts and executives from the Cuban dairy industry, the unit cost of cow milk is the economic parameter that currently presents the greatest uncertainty and volatility, thus it is expected to increase in the future due to restructuring of the internal wholesale market, variation in national production, and other intrinsic commercial and financial factors, both external and internal. As such, a first sensitivity analysis was carried out in order to evaluate how an increase in the cow milk unit cost influences the NPV parameter, and determine at which value the ice cream production plant becomes unprofitable (that is, when a negative NPV value is obtained). In this analysis, the unit cost of cow milk was varied between US $ 0.21 - 2.29/L, keeping the unit cost of the other raw materials constant.
According to [36], NPV is highly dependent on the interest rate used and the time period studied. The interest rate for determining the NPV value is a key variable for discounting future cash flows to present value. Increasing the interest rate allows adjusting for risks or other uncertainties throughout the plant operation. [41]. Therefore, a second sensitivity study was accomplished in this work, in order to evaluate how an increase in the interest rate impacts in the NPV indicator, to determine from which value of this parameter a negative NPV value begins to be obtained, and thus the project starts to be unprofitable. In this case, the value of the interest rate was varied between 10 - 30 %.
Results and Discussion
Figure 2 shows the process flow diagram (PFD) for the chocolate ice cream production process, while Figure 3 shows the Gantt chart for a single batch. Both figures were obtained from SuperPro Designer®.

Figure 2: Process flow diagram for the chocolate ice cream production process created in SuperPro Designer®.
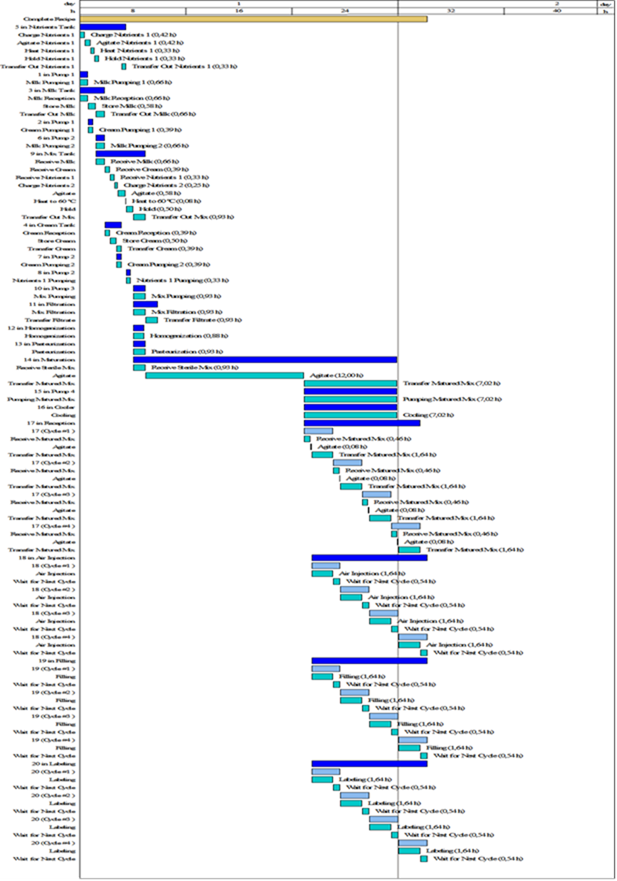
Figure 3: Gantt chart for a single batch of the ice cream production.
The Gantt chart enables users to visualize the execution of a batch process in detail, displaying meticulous scheduling information for one or multiple batches. In Figure 3, the golden bar indicates the duration of the entire recipe; whereas the dark blue and cyan bars represent the duration of procedures and operations, respectively. It can be observed from this figure that the Batch Time was 26.28 h, while the equipment with the longest occupancy (excluding equipment shared across batches and auxiliary equipment, and referred as scheduling bottleneck) was number 14 (Aging), with about 20 hours of duration. Also, the Recipe Cycle Time, which is the time between two consecutive batch starts, was 23.95 h, and the Minimum Cycle Time, denoted as the minimum possible cycle time based on the time (scheduling) bottleneck, was 19.95 h.
Economic evaluation
Table 6 lists the main economic indicators for the ice cream production process, which were determined through simulation in SuperPro Designer®.
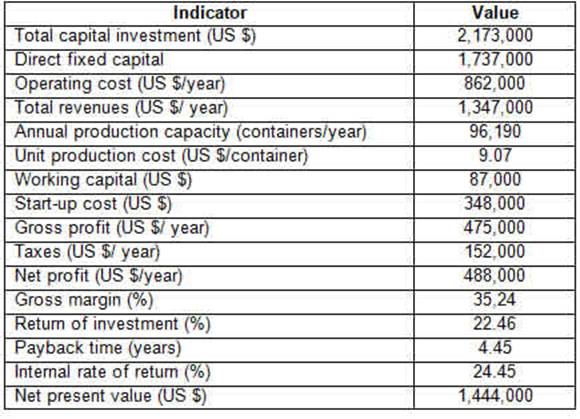
Table 6: Main economic indicators for the ice cream production process.
A total capital investment of approximately US $ 2.2 million is required to build the proposed ice cream production plant. Working capital, which included the raw materials required for initializing the production, training for operators and supervisors, etc., had a value of US $ 87,000, while the start-up cost was US $ 348,000. The annual operation costs amounted to US $ 862,000, while the total annual revenues, gross profit and net profit reached values of US $ 1,347 million, US $ 475,000 and US $ 488,000, respectively. In case of the positive value obtained for the gross profit indicator, it indicates that the total annual revenues exceed the annual operating cost; while the positive value obtained for the net profit indicator means that the annual gross profit of the project exceeds the annual income taxes. The positive values calculated for both the gross and net profit indicates the economic feasibility of the project. On the other hand, the gross margin was 35.24% indicating that this percentage value is considered as a gross profit from the annual revenues obtained, while the unit production cost of a 10 L ice cream container was US $ 9.07, and the ROI was 22.46%. The positive ROI value obtained suggests that the project is economically viable. Finally, the project had a PT value of 4.45 years, an IRR of 24.45%, and an NPV of US $ 1,444 million. These results indicate that the process represents an attractive investment and is profitable and economically feasible given that the NPV is positive and the calculated PT is less than 5 years [36] [42].
Leon [14] carried out the preliminary design of a liquor-based ice cream production plant with a production capacity of 390 L/day in Piura, Peru, and determined the indicators NPV and IRR, whose values were US $ 844,894.30 and 1,098.72 %, respectively. In this study, the total initial investment was US $ 51,070. Sierra [15] accomplished a feasibility study to erect an artisanal Thai-style ice cream plant in the city of Bogota, Colombia using Colombian exotic fruits as adjuncts. This author determined the NPV, IRR and PT indicators for this project, which were US $ 26,150, 26.0% and 3.75 years, respectively, while the initial investment was US $ 38,205. Finally, Banda [17] designed an artisanal-type ice cream production process based on discarded banana in Piura, Peru, with a production capacity of 15 L/day. The values of the profitability indicators for this project were US $ 28,709 for the NPV, 130% for the IRR and 1.04 years for PT. The initial investment for this project was US $ 11,122.
Direct fixed capital
Cost analysis and project economic assessment play an important role in the development of any project of the chemical processing industry. In order to decide, management must have information on capital investment required, since building a new plant of medium to high production scales is a major capital expenditure [43].
After the purchase of equipment, the plant would need piping, instrumentation, insulation, electrical installations, building, yard improvement, ancillary facilities and any other equipment not included in the list. For a field plant, these items would require more investment than for a plant attached to an existing facility capable of supplying various raw materials and utilities directly to the proposed production plant.
Fixed capital investment was estimated based on total equipment cost using various multipliers, some of which are equipment specific (e.g., installation cost, maintenance) while other are plant specific (e.g., piping, instrumentation, insulation, among others) [44]. Table 7 presents the different items considered in the estimation of direct fixed capital of the project.

Table 7: List of items involved in determining the Direct Fixed Capital of the project.
For the chocolate ice cream plant designed, total equipment cost was projected to be US $ 309,000, while installation, process piping and instrumentation costs were projected to be US $ 146,000, US $ 108,000, and US $ 62,000, respectively. Other important costs were for insulation, electrical and buildings in the amount of US $ 9,000, US $ 31,000, and US $ 139,000, respectively. Lastly, the yard improvement and auxiliary facilities costs amounted US $ 15,000 and US $ 124,000 respectively.
The total plant direct cost (TPDC) was US $ 943,000; the total plant indirect cost (TPIC) was US $ 567,000, which included US $ 236,000 for engineering and US $ 331,000 for construction. The total plant cost (TPC) (sum of TPDC and TPIC) reached a value of US $ 1,510,000. Sum of contractor’s fee (US $ 76,000) and contingency (US $ 151,000) was US $ 227,000. Finally, the direct fixed capital for the proposed plant was US $ 1,737 million.
The main cost item affecting the TPDC was equipment purchase cost, with 32.77% since it is the total cost of all the listed equipment included in the process flow diagram (US $ 158,600, see Table 4) plus the unlisted equipment purchase cost (US $ 150,400, value not shown), which accounts for the cost of other secondary equipment (i.e., pumps, tanks, heat exchangers, etc.) that are not considered explicitly in the main process flowsheet. Installation is the second most influential element, with 15.48%, because it refers to the in-place construction of the numerous equipment included in the grass-rooted/green-field ice cream production plant, both listed and unlisted, at the new plant site, including the cost of foundations, slabs, supports, and local equipment services. The third item with the largest influence was buildings (14.74%), since it is necessary a relatively high process area based on the footprint of the equipment and the space required around the equipment for safe and efficient operation and maintenance (process area), as well as the area required for other sections of the plant (laboratory, office, warehouses, change rooms, etc.). Finally, the auxiliary facilities constituted the fourth largest cost item (13.15%) since it includes the cost of process-oriented service facilities that are vital to the proper operation of the ice cream plant, such as steam and chilled water generation facilities. Since it is considered a grass-rooted/green-field, medium-scale plant, the costs for buildings, yard improvement and auxiliary facilities are considered comparatively high.
Annual operating costs
The ice cream facility was designed to produce around 808 containers of 10 L of chocolate ice cream per batch, while 140 batches per year will be implemented. This is equivalent to an annual production of 961,520 L of chocolate ice cream. Table 8 breaks down the different cost items involved in the project's annual operating cost, along with their percentage contribution.

Table 8: Cost items involved in the project’s annual operating cost, and their percentage influence.
The item that most contributes to the operating cost is raw materials, with US $ 367,000 (42.58%), primarily due to the relatively high consumption of the different raw materials that are used in the production process, essentially fluid cow milk (annual cost of US $ 107,369 see Table 9), skimmed milk powder (US $ 48,421), cream (US $ 48,716) and cocoa powder (US $ 63,548), as well as materials such as the empty containers with cover (US $ 54,059). This is typical for large-scale food processes [38].
The second most significant cost item was the utilities, with US $ 216,000 (25.06%), due to the high demand for electricity, steam, hot water and chilled water by various equipment items, especially the agitated tanks, pumps, pasteurizer, cooler and air injector equipment. Specifically, the ice cream production plant requires the availability of several utilities to carry out its key unit operations and processes, which incurs in the relatively high cost of this item and its significant contribution to the annual operating costs.
The facility-dependent cost constituted the third largest cost category, with US $ 182,000 (21.11%), which is due to the considerable maintenance and depreciation costs incurred by the production process. This is common for high-value products that are produced in single-product facilities. To reduce the impact of this cost, the food and chemical processing industries tend to use flexible, multi-product facilities where a number of products are manufactured in campaigns throughout the year [44].
In [15], raw materials were the fourth largest contributor to total operating costs, with 5.98%; while in [17], it signified the third item with around 23% of the total.
Materials cost
Table 9 shows a breakdown of the items included in the materials cost for the simulated chocolate ice cream production process.

Tabla 9: Cost items involved in the materials cost, and their percentage influence.
The item that has the largest contribution to the cost of materials is milk, with 29.30%, mainly due to the fact that it is the raw material with the highest consumption per batch (2,058 kg). In second place comes cocoa powder with 17.34%, primarily because it is the raw material with the highest unit cost of all (US $ 3,408/kg). In third place are the containers with 14.75%, which is explained by the relatively high number of containers consumed annually (96,152) and their unit cost (US $ 0.562), while cream comes in fourth place with 13.29 %, due to its relatively high annual consumption (97,432 L) and unit cost (US $ 0.500/L).
Among the five raw materials with the greatest influence on the materials cost, the milk, cream and sugar are produced in different processing plants located in the Cuban province where the proposed ice cream plant will be installed (Camagüey), while the cocoa powder and skimmed milk powder are imported raw materials. In the opinions of the authors, the production of cocoa powder and skimmed milk powder with food-grade quality in plants installed in Cuba will make it possible not to import these raw materials, which would help to reduce its current unit cost and, correspondingly, the unit cost of the chocolate ice cream to be produced in the proposed plant. In the case of the containers, whose annual cost constitutes the third with the largest influence on the materials cost, these are produced in a facility located in a Cuban province (i.e., they don’t constitute an imported material), so its unit cost is the lowest possible under the current economic conditions of Cuba.
Chemical composition of the chocolate ice cream obtained in the simulation
Table 10 shows the chemical composition of the chocolate ice cream stream obtained during the simulation of the proposed production plant in SuperPro Designer®.

Table 10: Chemical composition of the chocolate ice cream obtained in the simulation.
Analyzing the results shown in Table 10, it can be established that the percentage mass composition of the fats (small fats, 7.89%), water (61.32%), proteins (4.16%) and stabilizer (0.5%) are within the standard ranges reported by [7] for these components, which are 7-15% for fats, 60-72% for water, 4-5% for proteins and 0.5% for stabilizer, while lactose (2.35%) is below and sugar (sucrose, 17.98%) is above the ranges set by this author, which are 5-7% and 12-16% for lactose and sugar, respectively.
On the other hand, the mass compositions for water, sucrose and fats of the chocolate ice cream determined by the simulator are very similar to the values reported by [5], which are 64% for water, 18% for sugar and 8% for fats.
It can also be noted in Table 10 that the three main components of the ice cream are water, sugar (sucrose) and fats (small fats), comprising around 87% of the mass composition of the ice cream stream determined by the simulator, which is in accordance with the indicated by [7].
Compared to the values reported by the Food and Agriculture Organization (FAO) regarding the nutritional factors of ice cream, the mass concentration of both the proteins and fats present in the ice cream calculated by the simulator are above the values suggested by FAO, which are 20 mg/g and 67 mg/g for proteins and fats, respectively [45]. In this case, the proteins and fats (small fats) had values of 39.19 mg/g and 78.92 mg/g respectively in the ice cream composition determined by the simulator, which are 1.96 and 1.18 times above the values suggested by FAO. However, we consider that the percentage mass composition of the simulated chocolate ice cream stream adequately agrees to the values reported by the consulted literature [5] [7], effectively making it a healthy and nutritious food product for humans. These results validate the simulation model obtained in this work with respect to the material balance performed by the simulator, and the similarity of the mass composition of the components as compared with the values reported by the literature. Thus, this model can be used effectively to determine the productivity and throughput of a chocolate ice cream plant having the same equipment technology, but consuming different amounts of raw materials and thus implementing changed production capacities.
Sensitivity analysis
The investment of a chemical plant requires years for reasonable returns. Meanwhile, it poses a considerable risk throughout the operating life of the plant due to economically changing environment [41]. After a computer model for the entire process is developed, process simulators can be used to ask and readily answer “what if” questions and carry out sensitivity analyses with respect to important design and cost variables [44]. In this study, two sensitivity analyses were performed in order to evaluate the effect of key variables on the economic performance of the ice cream production plant.
Figure 4 presents the results of the first sensitivity analysis, showing the impact of the cow milk unit cost on the NPV for the project.

Figure 4: Results of the first sensitivity study.
As expected, an increase in the unit cost of cow milk decreases the value of NPV. It can be seen that a unit cost of cow's milk above 1.50 $/L leads to a negative NPV; that is, the proposed project becomes unprofitable. In this case, the cow milk unit cost has to increase four times for the proposed ice cream production plant to become insolvent.
Figure 5 shows the result of the second sensitivity study carried out, which involved the verification of how an increment of the interest rate influences the NPV indicator.
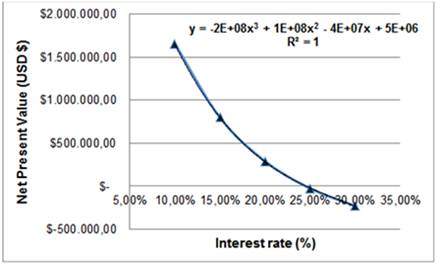
Figure 5: Results of the second sensitivity study.
The higher interest rate resulted in a lower overall NPV. This implied that the project became less attractive when the interest rate increased. However, as long as the NPV remains positive, the project is economically viable [36] [41]. According to Figure 5, from an interest rate value higher than 24.45%, the project becomes unprofitable. It is worth mentioning that the NPV became zero when the interest rate was 24.45%, which is also known as the IRR, thus verifying the feasibility and exactitude of the profitability indicators determined by the simulation of the proposed ice cream production process with SuperPro Designer®. In this case, the current interest rate has to be increased 2.22 times in order to make unprofitable this project.
Conclusions
The use of the SuperPro Designer® simulator allowed to satisfactorily simulate a chocolate ice cream production process with a production capacity of around 808 containers of 10 L of chocolate ice cream per batch (961,520 L/year), under the current economic conditions of Cuba, thus permitting to determine the main preliminary techno-economic parameters of this project. The economic evaluation provided estimations for the capital and operating costs, as well as the profitability indicators of the proposed project. A total capital investment of US $ 2,173,000 will be required to build the chocolate ice cream production plant, with an annual operating cost of US $ 862,000 and a unit production cost of US $ 9.07/container. The analysis of the operating costs indicated that the raw materials, utilities and facility-dependent costs dominated this cost parameter. The NPV, IRR and PT indicators had values of US $ 1,444,000, 24.45% and 4.45 years respectively, which qualifies the project as economically profitable and feasible under the current economic conditions of Cuba. The percentage mass composition of the chocolate ice cream stream determined by the simulation corresponds adequately to the values reported by the open literature, except for the values indicated by FAO. The proposed production process begins to be unprofitable from a value of the cow milk unit cost of US $ 1.50/L and a value of the interest rate of 24.45%. An innovative and unique simulation model was obtained related to the techno-economic evaluation of a technological proposal for the production of chocolate ice cream at industrial scale in Cuba using SuperPro Designer® simulator, where important parameters were determined for this project such as mass and energy balances, productivity, economic profitability and investing feasibility. Also, this is the first process simulation of an industrial-scale ice cream production plant using SuperPro Designer® simulator. The model obtained in this work can be further optimized to increase the productivity and/or improve the profitability of this production process. It is recommended to carry out additional techno-economic assessments of industrial-scale ice cream production plants, through simulation with SuperPro Designer®, considering other popular flavors such as strawberry, vanilla and butter pecan, in order to determine their economic profitability and feasibility.
Received: 14/12/2021
Accepted: 29/09/2022

