


Services on Demand
Journal

Article
 text in
  Spanish (pdf)
 Article in xml format
 Article references
 Send this article by e-mail
Indicators
-
 Cited by SciELO
Related links
-
 Similars in
SciELO
Similars in
SciELO
Share

 Permalink
Salud colectiva
Print version ISSN 1669-2381On-line version ISSN 1851-8265
Salud colect. vol.14 no.1 Lanús Mar. 2018
http://dx.doi.org/10.18294/sc.2018.1200
ARTICLES
Childhood cancer: incidence and spatial patterns in the city of Campinas, Brazil, 1996-2005
1
 http://orcid.org/0000-0002-5432-9560
2
http://orcid.org/0000-0003-4835-8944
3
http://orcid.org/0000-0002-2470-0795
1PhD in Collective Health. Professor, Universidade Federal da Fronteira Sul, Chapecó, Brazil. jane.friestino@uffs.edu.br
2PhD in Biostatistics, Professor, Epidemiology Research Unit, Instituto de Saúde Pública, Instituto de Ciências Biomédicas Abel Salazar, Universidade do Porto, Portugal. dvmendon@icbas.up.pt
3PhD in Biostatistics. Profesor, Epidemiology Research Unit, Instituto de Saúde Pública, Instituto de Ciências Biomédicas Abel Salazar, Universidade do Porto, Portugal. pnoliveira@icbas.up.pt
4PhD in Public Health. Invited Assistant Professor, Escola Superior de Saúde, Instituto Politécnico do Porto. Researcher, Instituto de Investigação e Inovação em Saúde (i3s), Instituto de Engenharia Biomédica, Universidade do Porto, Portugal. carlaoliver@gmail.com
5PhD in Preventive Medicine. Professor, Universidade Estadual de Campinas, Brazil. djalmore@unicamp.br
This article analyzes cancer incidence and spatial patterns in children and adolescents (0-19 years of age) residing in the city of Campinas in Southeastern Brazil who were diagnosed from 1996-2005. Cancers were classified according to the Third International Classification of Childhood Cancer (ICCC-3) Groups. The four most common groups were studied: leukemias, lymphomas, and central nervous system and soft tissue neoplasms. Age-standardized incidence rates were calculated using the world standard population. A spatial Bayesian hierarchical regression model (controlling for data heterogeneity and spatial autocorrelation) was fitted, assuming that the number of cancer cases follows a Poisson distribution. A total of 180 cases were diagnosed during the study period. Overall, the crude incidence rate was 54.2 per million and the age-standardized incidence rate was 56.5 per million. Although some regions present higher incidence rates, considering the spatial heterogeneity and the spatial autocorrelation, no statistically significant differences in the relative risks were observed.
KEY WORDS: Spatial Analysis; Neoplasms; Child Health; Adolescent Health; Medical Geography; Brazil
BACKGROUND
The Unified Health System (SUS), as an integral part of the Brazilian system of social protection, has among its objectives to identify health factors and determinants and to use indicators to describe the situations of health and wellbeing of the population.1
In this scenario, collective health in Brazil has undergone some restructuring since the health reform that occurred in the mid-1970s. Based on conceptions of social medicine, collective health is currently constituted as a scientific field that contributes to studies of the health-disease-care process in diverse population groups inserted into specific geographical, historical and social contexts.2
Present-day epidemiology, particularly social epidemiology, has moved beyond the explanatory models of the health-disease process of the 1970s. Epidemiology now includes in its research methods expertise from other areas of knowledge, and therefore contemplates important elements such as the complexity existing in the various cycles of human life, which brings together the space and time in which individuals are inserted.3,4
From the perspective of social epidemiology, health is considered a relevant component of the well-being of not only the individual but also of society, as an essential condition for the enjoyment of life and an inalienable right of people regardless of where they live. Shifts in the overall structure of society, climate change, the aging of the population, the growth of inequality, and access to health care are some of the issues that have motivated the awakening of a new awareness of the importance of the territory and geography in the analysis of health conditions, prompting this area of knowledge to gain relevance in the field of collective health.
According to Barcellos,5) the geography of health
...is a field of knowledge that must integrate specialists and professionals interested in studying health-disease-care processes in geographic space, so as to intervene.
Currently in the literature it is possible to find a large number of studies that analyze chronic and non-communicable diseases, in particular the occurrence of neoplasms.4
As they are considered multifactorial diseases, various factors influence the geographic distribution of neoplasms, especially social determinants, the environment and access to health services. An essential tool for the epidemiological surveillance of cancer incidence involves the use of population-based cancer registries (PBCR); such registries are fundamental sources for the development of epidemiological research and clinics, as well as for the planning and evaluation of actions to cancer control.
Given the importance of knowing the incidence of cancer in the population, since the 1980s the National Institute of Cancer [Instituto Nacional de Câncer] has promoted the establishment of cancer registries in Brazil, such that there are now 20 population-based cancer registries distributed in major cities of all regions of the country.6 The majority of research is geared towards the types of neoplasms with greatest incidence, perhaps because of the ease in obtaining the data or because of the large amount of information needed for contingency planning; studies of rare cases are therefore scarce in the literature.7
Campinas, a large Brazilian city located in the southwest of the country, has had a population-based cancer registry operating since 1990. Although population-based studies concerning childhood cancer incidence and survival are important to evaluate local health services, studies are rarely available for the region.
Childhood cancer (diagnosed between the ages of 0-19 years) includes a variety of malignancies, with incidence varying worldwide by age, gender, ethnicity and geography, a variation which could provide insights into cancer etiology.7,9 This type of cancer is considered rare when compared to cancer in adults, representing approximately 2.5-3% of all types of cancer in Latin America and the Caribbean.6,10
Despite this low incidence, the number of new cases in this age group represents a major public health impact due to the frequently high rates of mortality, with the severe consequences due to treatment and the neoplasms themselves aggravated by the suffering experienced by the family.11
In Brazil, 32.9% of the population is under 19 years of age12 and although cancer in this age group is rare, it is estimated that there were 11,530 cases among Brazilian children in 2012. According to a report using 14 of the Brazilian population-based cancer registries for all their years of coverage, the average incidence is 154.3 per million children.6
Cancer has specific behaviors in this age group, therefore the implementation of monitoring is measure for prevention as well as for knowledge production, providing greater visibility to the issue.
It is known that in Brazil there are inequities in access to health services for the treatment of cancer in children, and in this sense, the country has features similar to those found in other developing countries, in which the magnitude of cancer is still poorly known. This situation impedes the planning of health actions and the implementation of strategies for prevention and care in the whole population.13
Given the special features of childhood cancer, epidemiological studies are of great important. They analyze the distribution of cases in the community and construct indicators and weights to generate greater knowledge of the events, which are essential in identifying the affected population and the demands for care.14
Scott15 evaluated the use of geographic information systems (GIS) positively in the creation of a health information system about cancer. Even with the incomplete data that had been recorded in South Africa, the technique had the potential to add value to the information system, contributing knowledge regarding a demand which until then had not been considered.
Even in the presence of population-based cancer registries, the collection of information about childhood cancer is often unknown in many low-income and middle-income countries, where data on the incidence of cancer are not collected. Additional data sources might be required, and the resulting statistics must be subjected to meticulous quality control. Regarding the worldwide incidence of childhood cancer, only three publications from the years 1988, 1998, and, more recently, 2017 are available. The distances between these dates highlight the complexity existing in the records of cases of childhood cancer, as they are more sensitive to imprecision or missing information.7
A better understanding of the incidence and spatial patterns of childhood cancer in the local area may help in targeting health services and provide clues for planning in the healthcare system.7,16 Although geographic analysis can be innovative when it comes to information on cancer incidence, it is known that there is a gap in the scientific literature regarding this issue. Therefore, this study analyses spatial patterns of cancer incidence among children (0-14 years) and adolescents (15-19 years) who are residents of Campinas and were diagnosed in the 1996-2005 period. This study is part of a doctoral dissertation defended in 2015 entitled “Overview of cancer among children and adolescents in the perspective of Collective Health”.17
MATERIAL AND METHODS
A retrospective observational study of cancer among children and adolescents (0-19 years of age) in Campinas, São Paulo, Brazil, diagnosed in the period from 1996-2005 was conducted.
Campinas is an industrial city located in the state of São Paulo, Brazil, with approximately 1.1 million inhabitants. About 30% of the population living in Campinas is under the age of 19 years. During the study period there was an increase of 8.34% in the population under 19 years.12
In 2000, Campinas was divided by the Municipal Health Department into 47 health care unit coverage areas, which are the geographic units used in the spatial analysis. The population under 19 years in these areas ranged from 1,099 to 7,036, with a median of 3,429.
The main cancer care for children and adolescents occurs in the High Complexity Care Unit for Pediatric Oncology, and according to an assessment of the population-based cancer registry of Campinas, this unit has an 85% coverage of incident cases in the city for this age group.18
Although Campinas has a population-based cancer registry, no data were available for the time period considered in this research. Therefore, this study was conducted in the mentioned High Complexity Care Unit in Pediatric Oncology. This study used all data collection steps already validated for population-based cancer registries and the main procedure for gathering data was active notification of cases.
The present study was conducted in accordance with Resolution 196/96 of the Brazilian National Health Council and was approved by the Human Research Ethics Committee. The overarching study in which this article was based was approved by the Human Research Ethics Committee of the Boldrini Children’s Center (CEP-Boldrini) (CAAE 0566.0.000.144-11) No. 06/2011, on May 13, 2011.
Case definition
Data were retrieved for all children and adolescents residing in Campinas aged 0-19 years who were diagnosed between January 1, 1996 and December 31, 2005. Confirmed diagnosis of cancer was obtained from medical records, using the date of diagnosis of the first primary tumor.
To avoid the inclusion of cases not from the population at risk, a data check was performed manually, comparing the home address of cases with the covered geographical area.
Cancers were classified according to the International Classification for Childhood Cancer, third edition (ICCC-3).19 Benign tumors were excluded. By design, just the most common 4 groups were studied: Group I, Leukemias; Group II, Lymphomas and reticuloendothelial neoplasms; Group III, Central nervous system and miscellaneous intracranial and intraspinal neoplasms; and Group IX, Soft tissue and other extraosseous sarcomas.
Cancer Incidence
The person-years for the period under analysis were obtained from population estimates from the Brazilian Institute of Geography and Statistics [Instituto Brasileiro de Geografia e Estatística] (IBGE).12 Average annual crude and standardized incidence rates, calculated per 1,000,000 inhabitants, express the risk of new cases. The population denominators used for calculation of the incidence rates were based on the population census in 2000 and estimated projected numbers for the remaining years.12 Age-specific incidence rates per million inhabitants were calculated for children and adolescents in the corresponding age group, resident in the city of Campinas.12 Age-standardized incidence rates (ASIR) were calculated by the direct method, using the World standard population,20 in order to control for differences that may exist in the age and sex structure between regions and to compare the incidence rates between regions. In other words, considering that yijk represents the number of cancer cases (between 1996 and 2005) in health care unit area i (i=1,...,47), in sex j (j=1,2) and age group k (k=1,...,4 respectively for age groups 0-4, 5-9, 10-14 and 15-19 years-old) and Nijk the number of individuals at risk in area i, sex j and age group k, the ASIR were estimated by:

Where
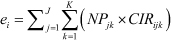
represents the number of expected cases for each region i, NPjk represents the number of individuals in the standard population of sex j and age group k, and CIRijk=yijk/ Nijk represents the crude incidence of region i, in sex j and age group k. The confidence interval was calculated based on the exact method based on the Poisson distribution (appropriate for small numbers).
Spatial analysis
The digital maps of administrative limits were produced by the IBGE. We used the health care unit areas, which correspond to the coverage area of health centers in the city and their respective population.
The conventional measure used in disease mapping is the standardized morbidity ratio (SMR) that refers to the incidence in this period. For each area i, the SMR is defined as the ratio of observed cases yi to expected cases ei. The ei were calculated based on the indirect standardization was used to control the effect of sex and age.21,22 The expected cases were calculated as follows: considering i the health care unit area index, j the sex index and k the age group index, then yijk represents the number of events of sex j and age group k in the area i, and Nijk the number of people at risk by sex j and age k in the area i.
The overall rate for the city by age group and sex was given by the following expression:

Then the expression:

represents the expected number of events in the area i, sex j and age group k. Therefore, the expected number of events in the area i, assuming constant risk within each age and sex class, was given by,

that is, the sum of expected values in the area over age and sex classes. Consequently, the SMR adjusted by age group and sex for each health care unit area i (i=1,...,47), assuming that the risk is constant in each area, is given by:

In order to control for data heterogeneity and spatial autocorrelation between areas, a spatial Bayesian hierarchical regression model was fitted. The parameters of interest were estimated by the following model:

where

The inclusion of random effects Øi introduces a latent effect into the model to capture the impact of unknown/unobserved confounding area-level factors. These spatially unstructured random effects can help to account for overdispersion (presence of greater variability in the data) in the distribution of childhood cancer incidence counts yi. However, this does not allow for explicit spatial dependence between yi. This dependence was included by adding a spatially structured random effect vi. To allow for spatial dependence, a Conditionally Auto-Regressive (CAR) model21,22,23) is assumed for vi, defined by:

where wij are the adjacency weights for the areas. In this study wij were taken as simple binary values: wij=1 if area i has common boundary with area j and wij=0 otherwise; σv was the hyperparameter that controls the strength of local spatial dependence.
Uninformative prior distributions were assumed for the model parameters. Parameter was given a Gaussian prior with 0 mean and large variance (1,000) whereas the inverse of  and
and  priors were assumed to be Gamma distributed (0.5; 0.0005).24
The relative risk (RR) and the 95% credible intervals were estimated using the mean and the 2.5% and 97.5% empirical quantiles, respectively, of the posterior samples from each parameter of interest. These samples are based on two Markov chains with the Monte Carlo method (MCMC) with 100,000 iterations each and a burn-in period of 10,000. All cut-off points used in the maps correspond to the quartiles of the measurements that we are presenting.
The analyses were performed using the following software: SPSS, Geoda, Winbugs (WinBUGS14, Cambridge, UK)25 and R version 2.14.1 (Project for Statistical Computing),26 using R2WinBUGS package to connect the last two tools. WinBUGS uses Gibbs sampling, a specific MCMC method, to produce samples from the posterior distribution of each parameter.
RESULTS
A total of 180 cases were diagnosed, 154 in children and 26 in adolescents. Table 1 shows the absolute frequency distribution of tumor cases by diagnostic groups as well as the incidence rates per million by age - stratified into two groups, 0-14 and 15-19 years - and diagnostic groups.
Table 1 Frequency, male to female ratio, and incidence rates per million inhabitants according to cancer diagnostic group and age group in people 0-19 years of age. Campinas, São Paulo, Brazil. 1996-2005.

Source: Own elaboration based on the High Complexity Care Unit in Pediatric Oncology and the Brazilian Institute of Geography and Statistics [Instituto Brasileiro de Geografia e Estatística] (IBGE). ASIR = Age-standardized incidence rates.
The most frequent neoplasms were: acute lymphoblastic leukemia (children: 37.7%; adolescents: 15.4%), acute non-lymphoblastic leukemia (children: 13%; adolescents: 23.1%), astrocytomas (children: 11%) and Hodgkin lymphomas (adolescents: 19.2%) (Table 1).
Among children, the most frequent tumors were in Group I, which accounted for 52% of the overall number of incident neoplasms, followed by Group III (22.7%), and Group II (18.1%). Among adolescents, the diagnostic Group II represented 42.2% of the diagnoses, followed by Group I (38.5%), and Group III (11.5%). Pronounced differences in the male/female ratio were observed for Group II.
Overall crude incidence rates (cases per million) was 54.2 [CI95% (46.2-62.1)]; 64.2 in children [CI95% (54.0-74.3)], and 28.2 in adolescents [CI95% (17.3-39.0)]. The overall age-standardized incidence rate (cases per million) in people 0-19 years was 56.5 [CI95% (48.1-64.9)], and ASIR per group were as follows: Group I, 28.8 [CI95% (22.7-34.8)]; Group II, 11.6 [CI95% (7.85-15.2)]; Group III, 11.9 [CI95% (8.08-5.7)] and Group IX, 4.3 [CI95% (1.94-6.74)] (Table 1).
The geographical pattern of incidence rates was analyzed and higher crude incidence rates were present in some of the southern and western health care unit areas. The age-standardized incidence rates of cancer among children and adolescents for the period, according to health care unit area, were also calculated. An accentuated geographic pattern was found, with the lowest incidence rates in the north and east of Campinas. Figure 1 shows the map of SMR. The highest SMR are concentrated in the southwest and southeast regions of the municipality.
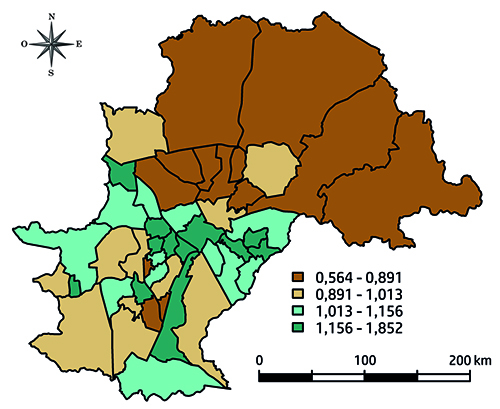
Source: Own elaboration based on the High Complexity Care Unit in Pediatric Oncology and the Brazilian Institute of Geography and Statistics [Instituto Brasileiro de Geografia e Estatística] (IBGE)
Figure 1 Standardized morbidity ratio (SMR) for cancer among people 0-19 years of age, by health care unit area. Campinas, São Paulo, Brazil, 1996-2005
Considering the model described above, there is an accentuated geographic pattern, with a lower distribution in the north area of city. The relative risks (RR) were not statistically significant among the health care unit areas. Figure 2 and Figure 3 show the modeled RR for childhood cancer and the 95% credible intervals. Although some health care unit areas to the south and west present higher crude incidence rates, no statistically significant differences in the RR were observed.

Source: Own elaboration based on the High Complexity Care Unit in Pediatric Oncology and the Brazilian Institute of Geography and Statistics [Instituto Brasileiro de Geografia e Estatística] (IBGE)
Figure 2 Estimated relative risk of cancer incidence among people 0-19 years of age according to health care unit area. Campinas, São Paulo, Brazil, 1996-2005
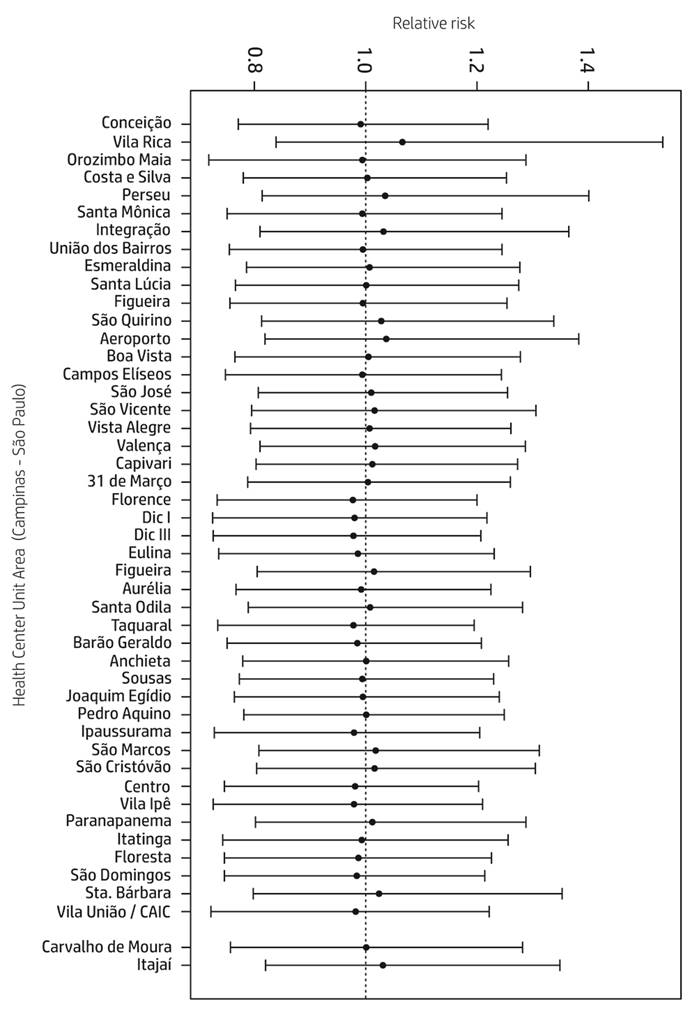
Source: Own elaboration based on the High Complexity Care Unit in Pediatric Oncology and the Brazilian Institute of Geography and Statistics [Instituto Brasileiro de Geografia e Estatística] (IBGE)
Figure 3 Estimated relative risk and 95% credible intervals of cancer incidence among people 0-19 years of age according to health care unit area. Campinas, São Paulo, Brazil, 1996-2005
DISCUSSION
This study analyses the childhood cancer in Campinas and uses spatial analysis to examine the incidence pattern and distribution in the city. The most frequent childhood cancer adjusted by age was Group I (Leukemia, 28.8 per million), followed by Group III (Central nervous system and miscellaneous intracranial and intraspinal neoplasm, 11.9 per million).
Considering that characteristics, frequency and cancer type distribution in children and adolescents are unique and different from those observed at any other age-group, it has been recommended that epidemiological studies of childhood cancer be performed separately from other age groups.8,27
In Campinas, similarly to results from previous reports using European registries, the most frequent childhood cancer is Group I, representing age-standardized incidence rates lower than those of the majority of European countries but similar to Portugal (28 per million), Poland (29.9 per million) and Romania (28.3 per million).28 It has been suggested that such rates among childhood cancers might reflect the socioeconomic development of the society, with the more affluent societies exhibiting higher rates.29
In this regard, we found that in Campinas the highest values of SMR are concentrated in the southwest and southeast regions of the municipality, corresponding to the major areas of social inequalities in this city; however, this may be related to unobserved variables, and future research is needed. The problem of childhood cancer cannot be evaluated separately from the level of development and health conditions of each region. Population growth, poverty, poor hygiene, lack of education, and a multitude health problems impede the development of pediatric oncology and the success of the management of childhood cancer in developing countries.29
In addition, the distribution of cases by sex, age and the four most common groups of disease are similar to those found in other Brazilian studies based on 14 Brazilian population-based cancer registries.6 Comparing the present data analysis with previous Brazilian publications on childhood cancer, tumors of the central nervous system were also the second common childhood tumor observed.6
Leukemias are the most common cancer in children worldwide and have the largest impact on total cancer incidence. Comparatively, the incidence that most resembled our study was that found in North Africa (28.2 per million).7 Acute lymphoblastic leukemia, Acute non-lymphoblastic leukemia, Astrocytomas, and Hodgkin lymphomas were the most frequent diagnoses in Campinas, both in children and adolescents, facts already reported in the literature.7,30
Regarding the records found for South America, only Group II incidence was similar to the findings in the present study (11.6 per million); for the other three groups studied, the incidence was higher in the other countries of South America.7
Compared to European countries, the largest differences in incidences were observed for Group III and Group IX. In European countries the standardized incidence rates for Group III (29.5 per million) and for Group IX (9.4 per million) are more than twice as great as those found in Campinas (Group II incidence, 11.9 per million and Group IX incidence, 4.3 per million). However, in relation to Group IX, the incidence resembles those found in South Africa and Native Americans in the US.7,28,31
These differences may be explained by the type of tumor (solid) affecting mainly adolescents, who could have been treated elsewhere or regarded as young adult cases and not referred to the High Complexity Care Unit in Pediatric Oncology.
Although incidence rates in the four diagnostic groups studied differ from the observations of the population-based cancer registries from developed countries, they are similar to those found in the literature for developing countries, including Brazil.7,32,33
A limitation of the study results from the data source, as records were obtained from only one childhood oncology service. Although the population-based cancer registry affirms that there was 85% coverage of the cases in city residents, it is possible that the profile of patients not included in the analysis differs from that seen in our results.
The creation of efficient monitoring systems for cancer, in particular for rare cases of childhood cancer, is necessary across healthcare networks. In addition, their creation would greatly potentiate the value of spatial analysis by permitting more precise results. Future steps should investigate the relationship between geography and childhood cancer incidence rates for a wider range of health measures and outcomes.16
In conclusion, our results are in agreement with previous reports from other cancer registries. The present application to cancer incidence in a Brazilian region produced evidence of similar distribution of cancer among children and adolescents. This study of the cancer incidence rates and the analysis of the SMR spatial patterns can be paramount in the definition of intervention programs in the region. Therefore, it can help in the development of health care programs for the reduction of morbidity and mortality in childhood cancer and, concomitantly, in the planning of interventions as well as in the structuration of the health care network.
ACKNOWLEDGEMENTS
We thank the Brazilian Coordenação de Aperfeiçoamento de Pessoal de Nivel Superior (CAPES) for the financial support (No. 99999.007495/2014-05) as well as the important contribution of researchers from the Universideade do Porto and the population-based cancer registry of Campinas.
REFERENCES
1. Brasil. Lei 8080, de 19 de setembro de 1990. Dispõe sobre as condições para a promoção, proteção e recuperação da saúde, a organização e o funcionamento dos serviços correspondentes e dá outras providências [Internet]. Diário Oficial da República Federativa do Brasil; 1990 [citado 2 May 2017]. Disponible en: Disponible en: https://tinyurl.com/d73vyv . [ Links ]
2. Nunes ED. Collective health paradigms: a brief reflection. Salud Colectiva. 2014;10(1):57-65. [ Links ]
3. Breilh J. Epidemiologia: economia, política e saúde. São Paulo: Unesp-Hucitec; 1991. [ Links ]
4. Guimarães RB. Geografia e saúde coletiva no Brasil. Saúde e Sociedade. 2016;25(4):869-879. [ Links ]
5. Barcellos C. A Geografia e o Contexto dos Problemas de Saúde. Rio de Janeiro: Abrasco; 2008. [ Links ]
6. De Camargo B, De Oliveira Santos M, Rebelo MS, De Souza Reis R, Ferman S, Noronha CP, Pombo-de-Oliveira MS. Cancer incidence among children and adolescents in Brazil: first report of 14 population-based cancer registries. International Journal of Cancer. 2010;126(3):715-720. [ Links ]
7. Steliarova-Foucher E, Colombet M, Ries LAG, Moreno F, Dolya A, Bray F, Hesseling P, Shin HY, Stiller CA, IICC-3 contributors. International incidence of childhood cancer, 2001-10: a population-based registry study. The Lancet Oncology. 2017;18(6):719-731. [ Links ]
8. Magrath I, Steliarova-Foucher E , Epelman S, Ribeiro RC, Harif M, Li CK, Kebudi R, Macfarlane SD, Howard SC. Paediatric cancer in low-income and middle-income countries. The Lancet Oncology. 2013;14(3):e104-e116. [ Links ]
9. Forman D, Bray F , Brewster DH, Gombe Mbalawa C, Kohler B, Piñeros M, Steliarova-Foucher E , Swaminathan R, Ferlay J, editors. Cancer incidence in five continents Vol-X [Internet]. Lyon: International Agency for Research on Cancer; 2014 [citado 12 oct 2016]. Disponible en: Disponible en: https://tinyurl.com/y8z9w5rk . [ Links ]
10. Parkin DM, Kramárová E, Draper GJ, Masuyer E, editors. International Incidence of Childhood Cancer. No.114. Lyon: IARC Scientific Publication; 1998. [ Links ]
11. Teixeira RP, Ramalho WS, Fernandes ICF, Salge AKM, Barbosa MA, Siqueira KM. A Família da criança com câncer: percepções de profissionais de enfermagem atuantes em oncologia pediátrica. Ciência, Cuidado e Saúde. 2012;11(4):784-791. [ Links ]
12. Instituto Brasileiro de Geografia e Estatística. Infográficos [Internet]. Brasil: IBGE; 2010 [citado 02 May 2017]. Disponible en: Disponible en: https://tinyurl.com/ybqtotu2 . [ Links ]
13. Grabois MF, Oliveira EXG, Carvalho MS. Childhood cancer and pediatric oncologic care in Brazil: access and equity. Cadernos de Saúde Pública. 2011;27:1711-1720. [ Links ]
14. Mutti CF, Paula CC, Souto MD. Assistência à Saúde da Criança com Câncer na Produção Científica Brasileira. Revista Brasileira de Cancerologia. 2010;1(56):71-83. [ Links ]
15. Scott D, Curtis B, Twumasi FO. Towards the creation of a health information system for cancer in KwaZulu-Natal, South Africa. Health & Place. 2002;8(4):237-249. [ Links ]
16. Bailony MR, Hararah MK, Salhab AR, Ghannam I, Abdeen Z, Ghannam J. Cancer registration and healthcare access in West Bank, Palestine: a GIS analysis of childhood cancer, 1998-2007. International Journal of Cancer. 2011;129(5):1180-1189. [ Links ]
17. Friestino JKO. Panorama do câncer em crianças e adolescentes sob a perspectiva da saúde coletiva. [Teses de Doutorado]. Campinas: Universidade Estadual de Campinas; 2015. [ Links ]
18. Oliveira-Friestino JK, Francisco PMB, Moreira Filho DC. Incidence profile of leukemias, lymphomas, central nervous system tumors and soft-tissue sarcomas in children and adolescents in a brazilian city. International Archives of Medicine. 2016;9(152):1-8. [ Links ]
19. Steliarova-Foucher E , Stiller C, Lacour B, Kaatsch P. International Classification of Childhood Cancer, Third Edition. Cancer. 2005;103(7):1457-1467. [ Links ]
20. Doll R, Payne P, Waterhouse JAH, editors. Cancer incidence in five continents. Geneva: Union Internationale Contre le Cancer; 1966. [ Links ]
21. Clayton D, Kaldor J. Empirical Bayes estimates of age-standardized relative risks for use in disease mapping. Biometrics. 1987;43(3):671-681. [ Links ]
22. Bailey TC. Spatial statistical methods in health. Cadernos de Saúde Pública. 2001;17:1083-1098. [ Links ]
23. Gelfand AE, Vounatsou P. Proper multivariate conditional autoregressive models for spatial data analysis. Biostatistics. 2003;4(1):11-25. [ Links ]
24. Oliveira CM, Economou T, Bailey T, Mendonca D, Pina MF. The interactions between municipal socioeconomic status and age on hip fracture risk. Osteoporosis International. 2015;26(2):489-498. [ Links ]
25. Lunn DJ, Thomas A, Best N, Spiegelhalter D. WinBUGS-a Bayesian modelling framework: concepts, structure, and extensibility. Statistics and Computing. 2000;10(4):325-337. [ Links ]
26. RC Team. R: a language and environment for statistical computing [Internet]. Austria: R Foundation for Statistical Computing; 2012 [citado 16 oct 2016]. Disponible en: Disponible en: https://www.r-project.org/ . [ Links ]
27. Carreira H, Antunes L, Castro C, Lunet N, Bento MJ. Cancer incidence and survival (1997-2006) among adolescents and young adults in the north of Portugal. Pediatric Hematology and Oncology. 2012;29(7):663-676. [ Links ]
28. International Agency for Research on Cancer. World Cancer Report 2014. Lyon: WHO; 2014. [ Links ]
29. Yaris N, Mandiracioglu A, Büyükpamukcuc M. Childhood cancer in developing countries. Pediatric Hematology and Oncology. 2004;21(3):237-253. [ Links ]
30. Steliarova-Foucher E, Stiller C, Kaatsch P, Berrino F, Coebergh JW, Lacour B, Parkin M. Geographical patterns and time trends of cancer incidence and survival among children and adolescents in Europe since the 1970s (the ACCIS project): an epidemiological study. Lancet. 2004;364(9451):2097-2105. [ Links ]
31. Stiller CA, Desandes E, Danon SE, Izarzugaza I, Ratiu A, Vassileva-Valerianova Z, Steliarova-Foucher E. Cancer incidence and survival in European adolescents (1978-1997). European Journal of Cancer. 2006;42(13):2006-2018. [ Links ]
32. Braga PE, Latorre MRDO, Curado MP. Childhood cancer: a comparative analysis of incidence, mortality, and survival in Goiania (Brazil) and other countries. Cadernos de Saúde Pública. 2002;18(1):33-44. [ Links ]
33. Balmant NV, Reis RDS, Oliveira JFP, Ferman S, Santos MDO, Camargo BD. Cancer incidence among adolescents and young adults (15 to 29 years) in Brazil. Pediatric Hematology and Oncology. 2016;8(3):e88-96. [ Links ]
Received: October 31, 2016; Revised: May 26, 2017; Accepted: August 28, 2017
 Este es un artículo publicado en acceso abierto bajo una licencia Creative Commons
