


Servicios Personalizados
Revista

Articulo
 texto en
  Inglés (pdf)
 Articulo en XML
 Referencias del artículo
 Enviar articulo por email
Indicadores
-
 Citado por SciELO
Links relacionados
-
 Similares en
SciELO
Similares en
SciELO
Compartir

 Permalink
Salud colectiva
versión impresa ISSN 1669-2381versión On-line ISSN 1851-8265
Salud colect. vol.15 Lanús 2019
http://dx.doi.org/10.18294/sc.2019.1712
Articles
Youth homicide in Mexico and its impact in male life expectancy: geographical variations and associated factors

1PhD in Health Sciences. Senior Full-Time Research Professor, Centro Universitario de Ciencias de la Salud , Universidad de Guadalajara, Mexico. ggonzal@cencar.udg.mx
2PhD in Health Sciences. Senior- Full Time Research Professor, Centro Universitario de Ciencias de la Salud , Universidad de Guadalajara, Mexico. mgvega.lopez@gmail.com
This study analyzes the impact of youth homicide (between 15 and 29 years of age) on male life expectancy in Mexico and its 32 states in the periods 2004-2006 and 2014-2016, and identifies the factors that best explain the variations in the years of male life expectancy lost (YMLEL) due to youth homicide at the state level in 2014-2016. Based on official data, male temporary life expectancy (MTLE) between 0 to 85 years of age and years of male life expectancy lost, in total and due to youth homicide, were calculated in each three-year period. Through a linear regression analysis, factors associated with the variations of the years of male life expectancy lost due to youth homicide among states were identified. The male temporary life expectancy decreased between the three-year periods in the country and in 25 states; years of male life expectancy lost due to youth homicide increased in 31 states, in eight of them with a figure higher than 0.5 years in the 2014-2016 period. Factors such as the presence of drug trafficking, illegal firearms and the perception of insecurity explain the variations in the years of male life expectancy lost due to youth homicide within the Mexican states in the 2014-2016 period.
KEY WORDS: Homicide; Adolescent; Young Adult; Life Expectancy; Violence; Mexico
INTRODUCTION
Violence is, at present, one of the greatest concerns of Latin American citizens. As a result of the deterioration of security, the United Nations Development Programme (UNDP) has stated that “the weak flank of the region is violence, crime and insecurity,”1 a sensible assertion given the high rates of homicides that have characterized the region in recent years. In this context, Mexico is no exception, as violence in this country has reached sufficiently high levels - in magnitude, intensity and cruelty - to make insecurity a central issue in the public debate at the national level.2
Young Mexicans - especially men - play a key role in this crime escalation, as there are conditions in Mexico that increase their risk of becoming victims of criminal acts or even perpetrators of those crimes: these conditions are either of a structural nature - for example, the persistent social inequality3 - or are related to the social context - the family setting (domestic violence), the school (harassment, bullying) or the community (gangs, drug dealing, characteristics of the neighborhood where they live) - rendering young people extremely vulnerable to violence.4 Several studies have documented the increase in homicidal violence in the young Mexican population in this century; thus, homicides have become the leading cause of death among young Mexican men in recent years.4,5,6
A homicide is indeed an extreme case of interpersonal violence, which highlights the issues that exist both in the different social sectors and in the specific relationships in the private sphere.7,8 When homicides or attempted homicides involve young people, their social consequences are greater, as the early age of the victims greatly contribute to the increase in the “global burden” of premature death, injuries and disability suffered by society as a whole9 and, in particular, to the loss of years of life expectancy, the latter being one of the most widely used indicators to measure the state of health and wellbeing of a population
Unlike female life expectancy, male life expectancy in Mexico has practically stagnated of late at the national level and has even decreased in some states. Although some studies have documented the burden of violent deaths at young ages, none of them have assessed the impact of youth homicide on the changes experienced by male life expectancy in the last decade and the differences existing at the state level.10,11,12,13
Based on the construction of the indicator of years of male life expectancy lost (YMLEL) due to youth homicides, the aim of the present study is to analyze the impact of homicides of young people aged between 15 and 29 years on male life expectancy at the national level and by state in the periods 2004-2006 and 2014-2016, and to identify the socioeconomic factors that best explain the variations found in this indicator at the state level in the 2014-2016 three-year period.
MATERIALS AND METHODS
This is an observational and descriptive study, based on secondary sources of information, although it may also be considered - based on the analysis at the state level - an ecological study. Both the information on mortality and the population data for the studied years were obtained from the official databases (Dynamic Cubes) of the General Directorate of Health Information of the Ministry of Health , whose reference sources, in the case of the population, are the estimates and projections of the National Population Council ; the only exception is the data on 2016 deaths, which were obtained from the database of the National Institute of Geography and Statistics , given that the information was not yet available at the General Directorate of Health Information at the time of the study.14,15,16 It should be noted that this fact does not cause any problem of comparability with the source used for previous years, as, in all cases, the official figures are collated by both institutions and therefore are the same.
In particular, the homicides were classified according to the International Classification of Diseases, 10th Revision (ICD-10): X85-Y09, Y87.1.17 Moreover, it should be noted that in this study the terms “federal entity” and “state” are used interchangeably when referring to the political-administrative division of Mexico.
In accordance with criteria of the Pan American Health Organization (PAHO), the mortality records that have a death coverage of more than 90% or a proportion of ill-defined causes of less than 10% may be considered high quality.18 In this sense, the information on mortality in Mexico in the last decades may be considered adequate; therefore, it was decided that the reported official mortality data were going to be used in this research work. Due to the existence of deaths of unspecified age (a percentage lower than 1% of the total number of deaths in each three-year period studied, and in the case of homicides, a percentage of 5% in the 2014-2016 period and 2% in the 2004-2006 period),14 this situation was corrected by proportionally redistributing the deaths of unspecified age, in general and by homicide, according to the relative weight of each age group. This is a procedure that is commonly used in mortality studies, which does not change the data trend and is based on the principles of expansion of simple random sampling.19
Given the fact that the concept of youth may have different definitions and limits as regards age, for the purposes of this study, the youth population was considered to be that between 15 and 29 years of age, in accordance with the criteria used by the European Union,4 international organisms such as the Economic Commission for Latin America (ECLA) (CEPAL) ,and the Ibero-American Youth Organization20 and, particularly, the National Institute of Statistics and Geography (INEGI) of Mexico,21 which makes it possible to maintain comparability with different statistics projects for the study population at the international level.
Although initially the total male homicide rates were calculated for the 15 to 19, 20 to 24 and 25 to 29 year age groups and for the 1989-1991, 1994-1996, 1999-2001, 2004-2006, 2009-2011 and 2014-2016 three-year periods, the study basically focused on the 2004-2006 and 2014-2016 periods, due to the possibility of comparing the most recent situation in Mexico with the one existing ten years ago, when youth homicide rates reached their lowest level, in addition to being able to work with data referring to a single revision of the International Classification of Diseases (ICD-10).
With the existing data on deaths and population, abridged tables for male mortality were constructed for Mexico and its 32 states in the mentioned three-year periods, using EPIDAT v3.1 software.22 The aim of constructing three-year mortality tables was to reduce possible random variations in mortality rates that could distort the trend of their behavior.
Based on the mortality tables and according to the method proposed by Arriaga, both the male temporary life expectancy (MTLE) between 0 and 85 years of age as well as the years of male life expectancy lost (YMLEL) between these two ages (in general, by homicides and by age group in each three-year period) were calculated. The number of YMLEL was calculated by multiplying the proportion of individuals that die between the ages x and x + n in the stationary population of the mortality table, by the difference between the average number of years that they could have lived from the age of x if they had not died and the average number of years actually lived between x and x + n by the population that dies in that age group.23,24 Both indicators were calculated using the EPIDAT v3.1 software. Arriaga’s method has been used by several authors and is described in detail in the literature.10,12,13,23,24
In this sense, the YMLEL represent the difference between the maximum possible number of years that can be lived between two ages (85 years in this case) and the MTLE, which is the average years actually lived by the male population between those ages23; that is, the YMLEL are the years not lived. The sum of these years not lived, by age groups and cause, made it possible to obtain the total YMLEL, as well as those attributable to homicides for each state and, particularly, the YMLEL that correspond to the 15-29-year-old group (in general and by homicides). The YMLEL due to homicide thus become a robust indicator of the level of male youth homicides in the 2014-2016 three-year period.
In this study the YMLEL were calculated assuming null mortality between 0 and 85 years. This assumption facilitates the interpretation of the indicator: the total of YMLEL between “0” and “85” years is equal to the difference between the maximum number of years that can be lived between both ages if mortality is eliminated (in this case, 85 years) and the MTLE between ages “0” and “85” years (that is, the average number of years that are actually lived).25
Moreover, multiple linear regression analysis (weighted least squares regression) was conducted using the method known as stepwise regression to identify the socioeconomic factors that could best explain the variations of the YMLEL by homicides in the 15 to 29-year age group among the states in the 2014-2016 triennium. This procedure, used by different authors in the health field,26,27 takes the variable that shows the highest correlation with the dependent variable and includes it in the predictive model, gradually incorporating new variables into the equation, to the extent that that they can produce a statistically significant change in the regression. The probability of the F test (0.05 entry; 0.10 removal) was the criterium chosen to select the variables that were definitively included in the equation.
The variables selected for the analysis reflect the socioeconomic conditions of each state around the dates on which the study is focused: the percentage of the population aged 18 years or more that feels insecure in their environment (2015)28; the percentage of terminal inefficiency in secondary education (2016)29; the percentage of young people aged 15-24 years that do not study or have a permanent job (2016)29; the percentage of population living in poverty (2016); and the Gini coefficient as an indicator of income inequality (2016).30 Furthermore, the variables “hectares cultivated with marijuana and opiates destroyed by the army (per 100,000 inhabitants),” “firearms confiscated by the army, per 100.000 inhabitants”29 and “impunity index,” the first two variables calculated for the biennium 2014-2015, and the latter for 2012 (latest available data)31) were included as “proxies” of the magnitude of the activities related to drug trafficking, the availability of firearms and the functioning of the judicial system, respectively. In particular, the impunity index was calculated by subtracting from 1 the result of dividing the number of criminals convicted of murder by the number of homicides recorded in each studied period and then multiplying it by 100.
The regression was weighted by the population aged 15-29 years existing in each state in 2015. Student’s t test was used to determine if the calculated regression coefficients were significantly different from zero and the Durbin-Watson statistic was applied to assess the autocorrelation of the variables in the model. Likewise, the possible multicollinearity was assessed using the condition index. The SPSS v23 software was used for processing the information and the statistical data analysis.
The research protocol “Violence, youth and firearms in Mexico,” on which this article is based, was approved by the Center for Health, Population and Human Development Studies of the University of Guadalajara and registered under code SyP-2017-004. The project is in line with the ethical guidelines set out in the General Health Law Regulation related to health research in Mexico, as it was considered “risk-free research” that analyzes secondary data, using techniques and methods of documentary research - with protected data - that do not affect any individual.
RESULTS
Figure 1 shows that between 1990 and 2005 there is a marked downward trend in male homicide rates, both in general and in the 15-29-year age group. However, from the 2004-2006 three-year period onwards, this trend moves upwards, and although the highest rates are found in the 2009-2011 period, those observed in the 2014-2016 period - in general and in the analyzed age groups - are higher than the ones reported in the first years of the 1990s.
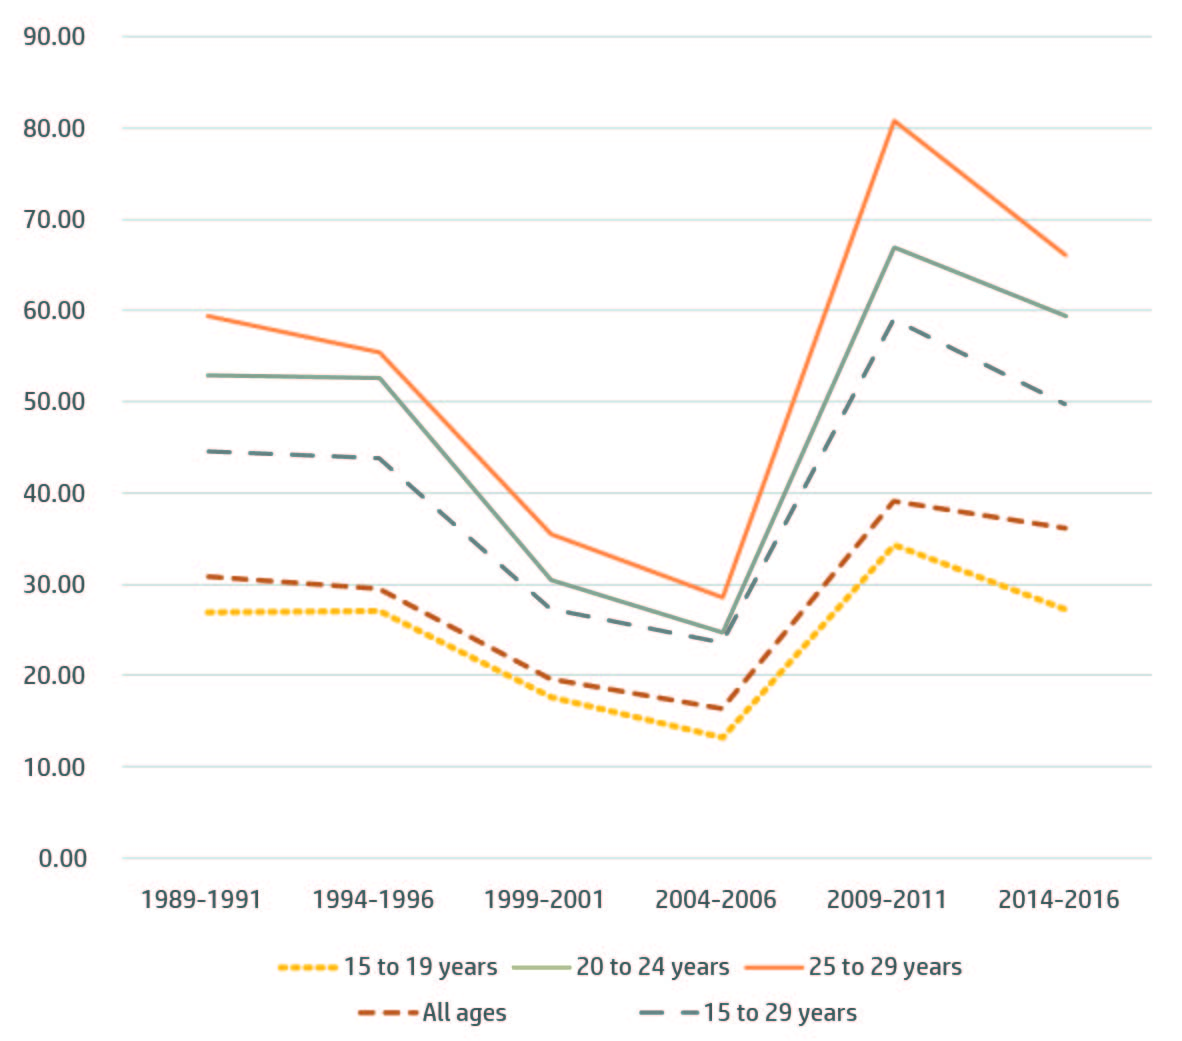
Source: Own elaboration based on the database (Dynamic Cubes) of the General Directorate of Health Information of the Ministry of Health14 and the National Institute of Geography and Statistics.15
Figure 1 - Triennial rates of male mortality due to homicide, per 100,000 inhabitants, all ages and by the age groups under study. Mexico, 1989-1991 to 2014-2016.
The highest rates throughout the studied period are observed in the 25-29-year-old group, reaching values higher than 65 homicides per 100,000 inhabitants in the last two triennia, figures that are twice the rates observed in the general population. The rates of the 20-24-year-old group follow in second place, while the rates of the 15-19-year-old group, though lower than the national average, reach their highest value in the analyzed period in the 2014-2016 triennium.
Furthermore, the rates of the 15-19-year-old group as a whole have remained clearly above the national average rate. All the rates of the 2014-2019 triennium are twice the rates recorded in the 2004-2006 period, with the 20-24-year-old group showing the greatest increase.
Table 1 shows that, both at the national level and in 25 Mexican states, the MTLE between 0 and 85 years decreased between the two studied triennia. In nine states, the decrease in MTLE was greater than one year, and the cases of Guerrero and Colima stand out for losing 3.7 and 2.4 years, respectively, between 2004-2006 and 2014-2016. In five states, the MTLE was lower than 70 years, with Chihuahua being the state with the lowest MTLE (68.6 years).
Table 1 Male temporary life expectancy (MTLE), years of male life expectancy lost (YMLEL) and years of male life expectancy lost due to homicide (YMLEL due to H) between 0 and 85 years, at the national level and by state. Mexico, 2004-2006 and 2014-2016.
| States | MTLE | Difference | YMLEL | YMLEL due to H | |||
|---|---|---|---|---|---|---|---|
| 2004-2006 | 2014-2016 | MTLE | 2004-2006 | 2014-2016 | 2004-2006 | 2014-2016 | |
| Mexico | 71.51 | 71.16 | -0.35 | 13.49 | 13.84 | 0.55 | 1.03 |
| Aguascalientes | 72.56 | 72.45 | -0.12 | 12.44 | 12.55 | 0.12 | 0.22 |
| Baja California | 68.94 | 69.65 | 0.71 | 16.06 | 15.35 | 0.82 | 1.34 |
| Baja California Sur | 71.10 | 71.92 | 0.82 | 13.90 | 13.08 | 0.30 | 1.17 |
| Campeche | 72.88 | 71.78 | -1.10 | 12.12 | 13.22 | 0.28 | 0.46 |
| Coahuila | 71.74 | 71.00 | -0.74 | 13.26 | 14.00 | 0.27 | 0.64 |
| Colima | 72.22 | 69.85 | -2.37 | 12.78 | 15.15 | 0.45 | 2.45 |
| Chiapas | 71.78 | 70.99 | -0.80 | 13.22 | 14.01 | 0.49 | 0.59 |
| Chihuahua | 68.92 | 68.62 | -0.30 | 16.08 | 16.38 | 0.97 | 2.64 |
| Durango | 71.87 | 71.60 | -0.27 | 13.13 | 13.40 | 0.74 | 0.93 |
| Guanajuato | 72.42 | 71.13 | -1.29 | 12.58 | 13.87 | 0.24 | 1.05 |
| Guerrero | 73.65 | 69.92 | -3.73 | 11.35 | 15.08 | 1.35 | 3.91 |
| Hidalgo | 72.38 | 72.70 | 0.31 | 12.62 | 12.30 | 0.19 | 0.41 |
| Jalisco | 71.65 | 71.10 | -0.55 | 13.35 | 13.90 | 0.37 | 0.87 |
| Mexico City | 71.13 | 70.27 | -0.87 | 13.87 | 14.73 | 0.47 | 0.72 |
| Mexico State | 70.90 | 72.24 | 1.34 | 14.10 | 12.76 | 0.76 | 0.93 |
| Michoacán | 71.73 | 71.54 | -0.18 | 13.27 | 13.46 | 1.13 | 1.44 |
| Morelos | 72.53 | 71.15 | -1.38 | 12.47 | 13.85 | 0.50 | 1.55 |
| Nayarit | 72.52 | 72.80 | 0.28 | 12.48 | 12.20 | 0.74 | 0.72 |
| Nuevo León | 72.44 | 72.36 | -0.08 | 12.56 | 12.64 | 0.16 | 0.60 |
| Oaxaca | 71.63 | 71.45 | -0.18 | 13.37 | 13.55 | 0.95 | 1.16 |
| Puebla | 70.25 | 70.61 | 0.36 | 14.75 | 14.39 | 0.38 | 0.60 |
| Querétaro | 71.78 | 71.70 | -0.09 | 13.22 | 13.30 | 0.24 | 0.35 |
| Quintana Roo | 72.45 | 71.87 | -0.58 | 12.55 | 13.13 | 0.40 | 0.49 |
| San Luis Potosí | 73.06 | 72.77 | -0.29 | 11.94 | 12.23 | 0.37 | 0.61 |
| Sinaloa | 73.06 | 71.45 | -1.61 | 11.94 | 13.55 | 0.90 | 2.42 |
| Sonora | 70.47 | 70.35 | -0.12 | 14.53 | 14.65 | 0.57 | 1.15 |
| Tabasco | 71.33 | 69.85 | -1.48 | 13.67 | 15.15 | 0.32 | 0.79 |
| Tamaulipas | 71.71 | 71.17 | -0.55 | 13.29 | 13.83 | 0.56 | 1.18 |
| Tlaxcala | 72.30 | 72.52 | 0.21 | 12.70 | 12.48 | 0.23 | 0.39 |
| Veracruz | 71.27 | 70.44 | -0.83 | 13.73 | 14.56 | 0.28 | 0.74 |
| Yucatán | 72.82 | 71.86 | -0.96 | 12.18 | 13.14 | 0.11 | 0.14 |
| Zacatecas | 72.84 | 71.73 | -1.11 | 12.16 | 13.27 | 0.36 | 1.41 |
Source: Own elaboration based on the database (Dynamic Cubes) of the General Directorate of Health Information of the Ministry of Health14 and the National Institute of Geography and Statistics.15 MTLE = Male temporary life expectancy; YMLEL due to H = Years of male life expectancy lost due to homicide;YMLEL= Years of male life expectancy lost.
In agreement with the above, at the national level and in 25 Mexican states, the YMLEL between both triennia increased. In particular, the YMLEL due to homicide increased both at the national level and in 31 states, in 16 of which the figures in the 2014-2016 period more than doubled those calculated for the 2004-2006 triennium. In 14 of the 25 states that decreased their MTLE, the YMLEL due to homicide in the period 2014-2016 more than doubled those calculated for the 2004-2006 triennium. The state of Colima stands out, as the number of YMLEL due to homicide increased fivefold in 2014-2016 compared to 2004-2006.
Although between 15 and 29 years of age the YMLEL increased at the national level and in most states (but four), the increase in the YMLEL due to homicides in this age group was much more marked: only in one state (Nayarit) the figures for the 2014-2016 period did not exceed those calculated for the 2004-2006 triennium. In 16 states, the increase in YMLEL due to homicides between 15 and 29 years of age between the two triennia at least doubled that observed for the YMLEL for the 15 to 29-year-old group in general (Table 2).
Table 2 Years of male life expectancy lost (YMLEL) of the 15 to 29-year-old group and years of male life expectancy lost due to homicide (YMLEL due to H) of the 15 to 29-year-old group at the national level and by state. Mexico, 2004-2006 and 2014-2016.
| States | YMLEL | YMLEL | Ratio | YMLEL due to H | YMLEL due to H | Ratio |
|---|---|---|---|---|---|---|
| 2004-2006 | 2014-2016 | 2014-2016/ | 2004-2006 | 2014-2016 | 2014-2016/ | |
| 2004-2006 | 2004-2006 | |||||
| Mexico | 1.28 | 1.52 | 1.18 | 0.20 | 0.41 | 2.10 |
| Aguascalientes | 1.06 | 1.34 | 1.27 | 0.03 | 0.10 | 3.98 |
| Baja California | 1.52 | 1.50 | 0.99 | 0.32 | 0.46 | 1.46 |
| Baja California Sur | 1.16 | 1.47 | 1.27 | 0.10 | 0.49 | 4.69 |
| Campeche | 1.18 | 1.32 | 1.12 | 0.08 | 0.13 | 1.61 |
| Coahuila | 0.98 | 1.26 | 1.28 | 0.11 | 0.29 | 2.56 |
| Colima | 1.14 | 2.08 | 1.82 | 0.08 | 0.94 | 11.81 |
| Chiapas | 1.62 | 1.42 | 0.88 | 0.18 | 0.19 | 1.04 |
| Chihuahua | 1.85 | 2.33 | 1.26 | 0.42 | 1.16 | 2.76 |
| Durango | 1.23 | 1.43 | 1.16 | 0.28 | 0.37 | 1.32 |
| Guanajuato | 1.14 | 1.72 | 1.52 | 0.10 | 0.43 | 4.17 |
| Guerrero | 1.32 | 2.49 | 1.89 | 0.39 | 1.57 | 4.08 |
| Hidalgo | 1.13 | 1.14 | 1.01 | 0.06 | 0.13 | 2.30 |
| Jalisco | 1.28 | 1.55 | 1.21 | 0.13 | 0.35 | 2.70 |
| Mexico City | 1.07 | 1.40 | 1.31 | 0.22 | 0.31 | 1.44 |
| Mexico State | 1.24 | 1.30 | 1.05 | 0.28 | 0.38 | 1.36 |
| Michoacán | 1.66 | 1.76 | 1.06 | 0.36 | 0.54 | 1.50 |
| Morelos | 1.21 | 1.63 | 1.35 | 0.16 | 0.55 | 3.44 |
| Nayarit | 1.49 | 1.29 | 0.87 | 0.26 | 0.23 | 0.90 |
| Nuevo León | 0.85 | 1.10 | 1.29 | 0.05 | 0.27 | 5.05 |
| Oaxaca | 1.47 | 1.43 | 0.97 | 0.27 | 0.34 | 1.25 |
| Puebla | 1.19 | 1.31 | 1.10 | 0.11 | 0.20 | 1.78 |
| Querétaro | 1.24 | 1.25 | 1.00 | 0.09 | 0.14 | 1.53 |
| Quintana Roo | 1.23 | 1.27 | 1.03 | 0.15 | 0.19 | 1.24 |
| San Luis Potosí | 1.22 | 1.30 | 1.06 | 0.14 | 0.27 | 1.94 |
| Sinaloa | 1.22 | 2.13 | 1.74 | 0.32 | 1.08 | 3.33 |
| Sonora | 1.28 | 1.49 | 1.17 | 0.23 | 0.41 | 1.78 |
| Tabasco | 1.64 | 1.88 | 1.15 | 0.11 | 0.30 | 2.76 |
| Tamaulipas | 1.24 | 1.56 | 1.26 | 0.24 | 0.56 | 2.39 |
| Tlaxcala | 1.10 | 1.16 | 1.05 | 0.07 | 0.10 | 1.57 |
| Veracruz | 1.28 | 1.64 | 1.27 | 0.08 | 0.31 | 3.66 |
| Yucatán | 0.96 | 1.01 | 1.05 | 0.04 | 0.05 | 1.20 |
| Zacatecas | 1.36 | 1.93 | 1.41 | 0.11 | 0.68 | 5.96 |
Source: Own elaboration based on the database (Dynamic Cubes) of the General Directorate of Health Information of the Ministry of Health14 and the National Institute of Geography and Statistics.15 YMELB due to H = Years of male life expectancy lost due to homicide; YMLEL = Years of male life expectancy lost.
It should be noted that while at the national level the increase of the YMLEL for the 15-19-year-old group between both triennia was 18%, the YMLEL due to homicides in this same age group doubled in this period. The cases of the states of Guerrero, Chihuahua and Sinaloa are remarkable, with more than one YMLEL due to youth homicide in the 2014-2019 triennium as well as the case of Colima, where the number of YMLEL due to homicides in this age group was in 2014-2019 almost 11 times higher than the value for the 2004-2006 period. In this sense, in eight states the YMLEL due to youth homicide exceeded half a year (0.5), a value that was not reached by any Mexican state in the 2004-2006 triennium.
At the national level, this means that male homicides in the 15-29-year-old group accounted for - in the 2014-2016 triennium - 3% of the total number of YMLEL in Mexico, 40% of the total number of YMLEL due to homicides and slightly over a quarter of the total number of YMLEL in the 15-29-year-old group, all these figures being higher than those calculated for the 2004-2006 triennium (Table 3).
Table 3 Percentage represented by the years of male life expectancy lost due to homicide in the 15-29-year-old group (YMLEL due to H 15 to 29) in the total years of male life expectancy lost (YMLEL), the total years of male life expectancy lost due to homicide (YMLEL due to H) and the total number of years of male life expectancy lost in the 15 to 29-year-old group (YMLEL 15 to 29), at national level and by state. Mexico, 2004-2006 y 2014-2016.
| States | YMLEL | YMLEL | YMLELBH | YMLEL due to H | YMLEL due to H | YMLEL due to H |
|---|---|---|---|---|---|---|
| 2004-2006 | 2014-2016 | 2004-2006 | 2014-2016 | 15 to 29 | 15 to 29 | |
| (%) | (%) | (%) | (%) | 2004-2006 | 2014-2016 | |
| (%) | (%) | |||||
| Mexico | 1.46 | 2.99 | 35.98 | 40.03 | 15.32 | 27.30 |
| Aguascalientes | 0.21 | 0.82 | 21.03 | 46.49 | 2.43 | 7.64 |
| Baja California | 1.97 | 3.01 | 38.63 | 34.50 | 20.82 | 30.70 |
| Baja California Sur | 0.74 | 3.71 | 34.10 | 41.33 | 8.96 | 33.00 |
| Campeche | 0.67 | 0.99 | 28.75 | 28.45 | 6.88 | 9.96 |
| Coahuila | 0.86 | 2.09 | 42.73 | 46.03 | 11.65 | 23.22 |
| Colima | 0.63 | 6.24 | 17.88 | 38.52 | 7.00 | 45.44 |
| Chiapas | 1.34 | 1.31 | 35.81 | 30.93 | 10.95 | 12.95 |
| Chihuahua | 2.62 | 7.10 | 43.30 | 44.10 | 22.75 | 49.86 |
| Durango | 2.12 | 2.75 | 37.66 | 39.63 | 22.59 | 25.79 |
| Guanajuato | 0.81 | 3.07 | 42.21 | 40.50 | 8.95 | 24.66 |
| Guerrero | 3.40 | 10.44 | 28.51 | 40.24 | 29.31 | 63.30 |
| Hidalgo | 0.45 | 1.07 | 30.16 | 31.75 | 5.04 | 11.47 |
| Jalisco | 0.96 | 2.49 | 34.31 | 39.81 | 10.04 | 22.40 |
| Mexico City | 1.56 | 2.11 | 45.74 | 43.46 | 20.19 | 22.17 |
| Mexico State | 1.98 | 2.97 | 36.83 | 40.71 | 22.44 | 29.01 |
| Michoacán | 2.70 | 4.00 | 31.68 | 37.41 | 21.52 | 30.53 |
| Morelos | 1.29 | 4.00 | 32.36 | 35.80 | 13.29 | 33.99 |
| Nayarit | 2.05 | 1.90 | 34.76 | 32.25 | 17.12 | 17.86 |
| Nuevo León | 0.42 | 2.13 | 32.98 | 45.19 | 6.25 | 24.49 |
| Oaxaca | 2.06 | 2.53 | 28.90 | 29.46 | 18.72 | 24.01 |
| Puebla | 0.77 | 1.40 | 29.62 | 33.32 | 9.48 | 15.39 |
| Querétaro | 0.67 | 1.02 | 37.31 | 38.31 | 7.12 | 10.87 |
| Quintana Roo | 1.19 | 1.41 | 37.32 | 37.45 | 12.13 | 14.54 |
| San Luis Potosí | 1.16 | 2.20 | 37.63 | 44.10 | 11.35 | 20.67 |
| Sinaloa | 2.71 | 7.95 | 36.08 | 44.55 | 26.46 | 50.64 |
| Sonora | 1.61 | 2.83 | 41.03 | 36.03 | 18.22 | 27.77 |
| Tabasco | 0.78 | 1.95 | 33.34 | 37.71 | 6.54 | 15.73 |
| Tamaulipas | 1.77 | 4.07 | 42.36 | 47.58 | 18.95 | 36.09 |
| Tlaxcala | 0.52 | 0.83 | 28.89 | 26.90 | 6.02 | 8.97 |
| Veracruz | 0.61 | 2.09 | 29.30 | 41.20 | 6.49 | 18.64 |
| Yucatán | 0.32 | 0.36 | 34.24 | 32.50 | 4.08 | 4.67 |
| Zacatecas | 0.93 | 5.11 | 31.58 | 47.94 | 8.33 | 35.14 |
Source: Own elaboration based on the database (Dynamic Cubes) of the General Directorate of Health Information of the Ministry of Health14 and the National Institute of Geography and Statistics.15 YMEL due to H = Years of male life expectancy lost due to homicide; YMLEL = Years of male life expectancy lost.
With the exception of Nayarit, in the rest of the states the YMLEL due to homicide in the 15-29-year-old group increased their proportional weight in the total YMLEL in 2014-2016 compared to 2004-2006. The cases of Guerrero (where more than 10% of the total number of YMLEL in the last triennium were caused by male homicides between 15 and 29 years old), Sinaloa and Chihuahua (more than 7%) and Colima (more than 6%) stood out.
Moreover, in 14 Mexican states, the YMLEL due to homicide between 15 and 29 years in 2014-2016 accounted for more than 40% of the total of YMLEL due to homicide (for 6 states in 2004-2006). Furthermore, an increase between both studied triennia was observed in the relative weight of the YMLEL due to homicide in the 15-29-year-old group with respect to the YMLEL for that age group: in Guerrero, for example, in 2014-2016 homicides accounted for around two thirds of all YMLEL in the 15-29-year-old group (compared to 29% in 2004-2006), in Sinaloa and Chihuahua they accounted for practically half of the figure (23% and 26% respectively in 2004-2006) and for 45% in Colima (7% in 2004-2006).
However, it should be noted that there are states in which the number of YMLEL due to homicide in the 15-29 year age group for both triennia was relatively low and, therefore, the proportional weight, both in the total number of YMLEL and in the 15-29-year-old group was low: those were the cases in Yucatán, Aguascalientes and Tlaxcala, in which the figures for YMLEL in the 15-29-year-old group have been equal or lower than 0.10 for both triennia and, therefore, they accounted for less than 1% of the total number of YMLEL, and less than 10% of the total YMLEL between 15 and 29 years of age in each of the states.
After the multiple linear regression analysis (Table 4), a model was obtained, showing the social factors - of those analyzed in this study - that best explain the variability by state of the number of YMLEL due to homicide in the 15-29-year-old group in the 2014-2016 triennium. In accordance with the standardized regression coefficient, the results show that the variable “hectares of cultivated marijuana and opiates destroyed by the army” is the most important factor to explain the interstate variations of the YMLEL due to homicide in this triennium. Moreover, the variables “percentage of population 18 years of age and older that feels insecure in their environment” and “firearms confiscated by the army” were also included in the model, which - according to the adjusted coefficient of determination (adjusted R2) - explains 73% of the variation in the dependent variable (YMLEL due to H in the 15 to 29-year-old group).
Table 4 Association between selected socioeconomic variables and years of male life expectancy lost due to homicide in the 15-29-year-old group, by state. Mexico, 2014-2016.
| Socioeconomic variables | Standardized regression coefficient | t | p-value |
|---|---|---|---|
| Variables in the equation | |||
| Confiscated firearms (per 100,000 inhabitants) | 0.193 | 2.04 | 0.046 |
| Destroyed hectares of marijuana and opiates (per 100,000 inhabitants) | 0.751 | 7.90 | 0.000 |
| Perception of insecurity (%) | 0.223 | 2.33 | 0.027 |
| Excluded variables in the equation | |||
| Young people aged 15-24 years that neither study nor have a permanent job (%) | 0.101 | 1.06 | 0.297 |
| Impunity index (%) | 0.040 | 0.38 | 0.706 |
| Population living in poverty (%) | -0.018 | -0.19 | 0.852 |
| Gini coefficient | 0.055 | 0.57 | 0.571 |
| Terminal inefficiency in secondary education (%) | 0.062 | 0.65 | 0.520 |
Source: Own elaboration based on the database (Dynamic Cubes) of the General Directorate of Health Information of the Ministry of Health14 and the National Institute of Geography and Statistics.15 Analysis of variance: degrees of freedom=3; F test=29.20; p=0.000.Durbin-Watson test: 2.04.Condition index: 13.07.R2 (adjusted coefficient of determination): 0.732.R2 (coefficient of determination): 0.758.R (coefficient of correlation): 0.871.
By contrast, the remaining variables analyzed are not relevant to explain the differences observed in the YMEL due to homicide among the different states of Mexico, as evidenced by their coefficients and their statistical significance.
The constructed model is statistically significant; it neither presents autocorrelation, according to the values of the Durbin-Watson test (around 2), nor high collinearity, according to the condition index (less than 20).
DISCUSSION
Between 1990 and 2016, 428,012 homicides were registered in Mexico, 380,262 of which were male homicides (89%); 153,420 of the male victims (that is, 40% of the total number of male homicides) were between 15 and 29 years old; 20,180 of these homicides took place between 2014 and 2016.14,15 These figures hardly reflect the magnitude of the homicidal violence in Mexico and of the social, demographic and sanitary impact of these lives that were cut short at such an early age.
According to PAHO,32 around the year 2015, the male homicide rate in Mexico (30 per 100,000 inhabitants according to PAHO, 36.2 in the 2014-2016 triennium according to the present study) was similar to the average rate of the region (31.7 per 100,000 inhabitants). Although lower than the rates in El Salvador, Colombia, Venezuela and Brazil, the rate in Mexico was 15 times higher than that of Canada (2.0), almost quadrupled those in Chile (7.6) and Cuba (8.2), almost tripled those in the USA (9.6), Argentina (11.6) and Nicaragua (11.3), and was remarkably higher than the rates in Costa Rica (18.8) and Uruguay (13.3).
PAHO recognizes youth homicide as the leading cause of death among young people in the Americas33 and the highest rates in the region are found in the 20-24- and 25-29-year-old groups. A similar situation is observed with the male youth homicide because, although the homicide rate in the 15-24-year-old group in Mexico in the period 2008-2012 (25 per 100,000 inhabitants) was below those observed in Colombia and Brazil, it was definitely higher than that reported by Argentina around 2008.4,5
In the 2014-2016 triennium, the male homicide rate in Mexico in the 15-29-year-old group was 49.8 per 100,000 inhabitants, the highest figure reported in the last 25 years, which makes it possible to understand why homicides are currently - and since 2008 - the leading cause of death of young people in that age group.14
However, the high rates of youth homicide reported in recent years contrast with the notorious decrease observed in that rate in the first 15 years of the period analyzed. There are reasons put forward by several authors2,3,6,34 that can help understand both the decline and rise in the rate from the middle of the first decade of the current century onwards.
In general terms, the decline observed seems to be related to specific structural improvements, such as the gradual growth of the gross domestic product per capita, a slight decrease in poverty levels and low unemployment rates; however, it is also associated with a reduction in the intensity of the confrontations between organized crime cartels since the establishment of the so-called “federation” (an alliance between several drug-trafficking organizations, under the leadership of the Sinaloa cartel) from the end of the 1990s to 2004 - among other aspects.35
Nevertheless, a flare-up of violence and the increase in homicides, especially male youth homicides, do not only respond to the deterioration of these structural conditions - which, in fact, has actually occurred, as is the case of the increase in the percentage of individuals living in poverty from 2008 onwards30) or the reduction of the gross domestic product per capita - but also to the effect of situational factors, such as the empowerment of the criminal groups engaged in drug-trafficking and other illicit activities, in collusion with authorities at different government levels2,36; the intensification of the confrontation that the drug-trafficking organizations maintain over the control of territories, due to the difficulties to access the US drug market37; the war against organized crime undertaken by the Mexican government in 2007 (with the deployment of the army in a large part of Mexico); the high levels of impunity and corruption existing in Mexican security and judicial systems36,37,38; and the increasing number of firearms in civilian hands, which are mostly introduced illegally through the US border.39
Moreover, there are contexts that specifically contribute to the growth of violence among the young population. One is the lack of jobs or labor precarization, with wages among the lowest in the continent. Another is the lack of sufficient study opportunities in public universities and the low educational quality in the previous levels of education, as well as the fact that the current generation of adolescents and youth is the most numerous in the history of Mexico, giving rise to a remarkable number of young people aged 15-29 years who are unemployed or unenrolled in education or training.40 Along with the marked inequality existing in Mexico and the deterioration of the urban space, where many young people coexist with highly violent behaviors on a daily basis,41 these elements provide fertile ground for young people to commit or become victims of criminal acts, to join a gang or be recruited by the organized crime as professional hitmen, informers or drug traffickers.42,43
Since the widespread increase in violence in the past decade, several authors have documented the relationship existing between violent deaths and life expectancy and, in particular, many of them have emphasized the importance of homicides - mostly occurring at young ages - in slowing down the increase in life expectancy, or even in stagnating or reducing male life expectancy in Mexico.44 Thus, a comparison between Brazil and Mexico highlighted the fact that the YMLEL due to homicide between the ages of 15 and 29 years increased between 2002-2004 and 2012-2014 - especially in Mexico, although the figure in Brazil was still considerable higher - and accounted for almost 50% of the total number of YMLEL in those ages in Brazil and 30% in Mexico, thus, having a negative impact on the life expectancy of both countries.10 Another study confirms the negative impact of male homicides in the 15-29-year-old group on the change in life expectancy in Mexico between 2000 and 2013.12. Furthermore, a previous research work comparing Colombia and Mexico also demonstrates how the 15-29-year-old group was responsible for 70% of the YMLEL due to homicide in Colombia in 2011.45
In line with the above, the results of the present investigation show, first, that in the last decade the levels of male homicide in the 15-29-year-old-group increased not only in Mexico, but also in all the Mexican states (except for Nayarit) - even in those states where the lowest rates have traditionally been observed - and that this growth was indeed remarkable in half of them, in which the YMLEL due to homicide for this age group in 2014-2016 at least doubled the estimate for 2004-2006.
Moreover, the role played by youth homicide is herein highlighted in the changes observed in the MTLE: in all the states where the MTLE was reduced, the YMLEL due to homicide increased substantially in the 15-29 year group; especially in those states where the MTLE was further reduced - Guerrero Colima, Sinaloa, Zacatecas - or that have lower MTLE, such as Chihuahua -the increases in YMLEL due to homicide in the 15-29-year-old group were greater.
The fact that in eight states the number of YMLEL due to homicide in the 15-29-year-old group in the 2014-2016 triennium is greater than 0.5 (that is, half a year of life lost) - when in 2004-2006 the highest figure was 0.42 for Chihuahua - shows the importance of youth homicidal violence in life expectancy and the magnitude of its growth in the last decade, in addition to the weight acquired in the total number of YMLEL in this age group.
Thus, the impact of youth homicide on male life expectancy is clear: the high rates of homicide at young ages imply that the large number of victims that die between 15 and 29 years of age do not live the years that they could actually live if they died of natural causes, in accordance with currently existing life expectancy levels, unlike what happens with deaths from chronic diseases that are concentrated at older ages.
As previously mentioned, in almost all the states in Mexico the YMEL due to male youth homicide have increased; however, the levels are dissimilar. The results suggest that in those Mexican states in which the army destroys more cultivated hectares of marijuana and opiates, where the population perceives greater insecurity and where the army confiscates a larger number of firearms, the figure of YMLEL due to homicides in the 15-29-year-old group tends to be higher and vice versa.
Thus, the analysis of interstate variations in the 2014-2016 triennium seems to confirm some of the arguments put forward above, particularly the relevance of organized crime (and especially the presence of drug cartels) along with the high availability of firearms - even of high-caliber weapons - to explain the high figures reached by the YMLEL due to homicide indicator in the 15-29-year-old group in states such as Chihuahua, Guerrero, Sinaloa, Colima, Zacatecas or Tamaulipas. Being frontier territories, Chihuahua or Tamaulipas facilitate illegal firearm trafficking from the USA and their indiscriminate use by the criminal groups settled in those states or relatively nearby states such as Sinaloa and Zacatecas. These groups often recruit young people to conduct their illegal activities or become role models of how to be rich and powerful.2
While states such as Chihuahua, Guerrero, Sinaloa and Michoacán remained among the states that recorded the highest rates of youth homicides in both triennia, the remarkable growth of YMLEL due to youth homicide in Colima, Zacatecas, Nuevo Leon or Guanajuato seems to reflect a reconfiguration of the criminal activity and a rearrangement of the drug cartels, as a response to the discursive strategies of the government that legitimize the persecution of drug trafficking using the armed forces, which also modifies the forms of territorial appropriation by the criminal groups.46
In turn, the perception of existing insecurity - especially in public spaces - is largely a reflection of the atmosphere of terror and impunity that reigns in Mexico, with federal, state and municipal authorities that are unable to guarantee security to their citizens, which has led to a banalization of ordinary violence - which has increased drastically, along with police abuses - and, therefore, to a change in the daily behavior of the population.2,28 In Guerrero, Chihuahua, Michoacán, Zacatecas and Tamaulipas - all of them states with more than 0.5 YMLEL due to youth homicide - the perception of insecurity is clearly higher that the national average.28
On the contrary, the cases of the states of Yucatán, Aguascalientes or Tlaxcala, where there is a lower number of YMLEL due to youth homicide, highlight the fact that in those places where the presence of organized crime and drug cartels is less evident, and the perception of insecurity is lower, the impact of male homicide in the 15 to 29-year-old group on male life expectancy is obviously smaller.
Although the present study may have some limitations, such as the possible under-reporting of the existing mortality in the most marginalized regions of Mexico - which could affect the construction of mortality tables in some states and therefore, their comparison - or the possible errors in the collection and classification of deaths as homicides, there is no evidence to infer that the results obtained for each triennium and the analysis based on those results may be significantly distorted, given that there has been a generalized improvement in Mexican death records in recent years.47 In any case, this would mean that the impact of youth homicide on life expectancy could be underestimated. The fact mentioned above regarding the satisfactory feedback on the mortality records in Mexico by the PAHO18 supports the reliability of the findings obtained.
Moreover, the use of the null mortality hypothesis - among three possible options - for the calculation of the YMLEL does not alter the interpretation of results and is recommended by the literature26 as it facilitates the interpretation of the results and explains the overall changes in MTLE.
In addition to the foregoing, the well-known “ecological fallacy” should be added, as the observed association between aggregate variables is not necessarily replicated at the individual level. In this case, however, the interest was focused on elaborating an explanatory context of the differences found in the behavior of youth homicide in the Mexican states rather than on identifying individual attributes associated with being a homicide victim between 15 to 29 years of age.
Despite the possible limitations mentioned above, on the one hand, the results of this study allow us to assert with reasonable certainty that the homicidal violence affecting men between the ages of 15 and 29 years has increased remarkably in Mexico in the last decade in Mexico and, in practice, in all its states. On the other hand, they show the impact of homicides at young ages on male life expectancy in Mexico and in most its states. It is evident that male life expectancy could grow conspicuously if male homicides at young ages were substantially reduced.
It is obvious that the health system cannot tackle such an important matter as that of youth homicide on its own. Public health - unlike the judicial system, which is aimed at apprehending and punishing those breaking the law - must collaborate more actively in determining the magnitude of the problem, its scope and characteristics, as well as in identifying the factors that favor youth violence and what could possibly be done to modify them. Undertaken from an uncommon perspective, this study provides elements to understand the sociosanitary dimension of youth homicide - particularly that affecting men - and the need for an interdisciplinary approach if we really want to have a young population with a lower risk of dying prematurely as victims of violence.
Therefore, the programs aimed at reducing youth violence - and thus the homicide rates at these ages - must be considered in the context of a comprehensive policy that takes into account the various dimensions of violence,48 because if there is not an adequate strategy to satisfy basic needs and address issues such as poverty, social inequality and unemployment, along with the need to reduce the existing levels of impunity and corruption, to implement actions to reduce the number of illegal firearms that circulate in the country and to reassess the existing policies to reduce the trafficking of illegal drugs and restrict their production, distribution and consumption among young people, the number of male youth deaths will hardly be reduced due to this cause.49 Moreover, it is necessary to question the predominant values in society related to masculinity, that is, those ideas that are passed on from generation to generation through the process of socialization and that imply a way of life that involves men more frequently than women in violent, risky and extreme behaviors that expose them to a higher probability of death due to youth violence.50
REFERENCIAS BIBLIOGRÁFICAS
1. Programa de las Naciones Unidas para el Desarrollo. Informe Regional de Desarrollo Humano 2013-2014; Seguridad ciudadana con rostro humano: Diagnóstico y propuestas para América Latina [Internet]. Panamá: PNUD; 2013 [citado 20 nov 2017]. Disponible en: https://tinyurl.com/h3z594b . [ Links ]
2. Bataillon G. Narcotráfico y corrupción: las formas de la violencia en México en el siglo XXI. Nueva Sociedad. 2015;(255):54-68. [ Links ]
3. González-Pérez GJ, Vega-López MG, Muñoz de la Torre A. Juventud, homicidio y esperanza de vida en México. En: Gutiérrez F, (coord.). Conducta violenta: Impacto biopsicosocial. Guadalajara: Editorial Universitaria; 2016. p. 41-62. [ Links ]
4. Alvarado A. Mortalidad juvenil en México. En: Alvarado A, Concha-Eastman A, Spinelli H, Peres MFT. Vidas Truncadas: el exceso de homicidios en la juventud de América Latina, 1990-2010. México DF: El Colegio de México; 2015. p. 171-212. [ Links ]
5. Alvarado A. La violencia juvenil en América Latina. Estudios Sociológicos. 2013;31(91):229-258. [ Links ]
6. González-Pérez GJ, Vega-López MG, Cabrera-Pivaral CE, Vega-López A, Muñoz de la Torre A. Mortalidad por homicidios en México: tendencias, variaciones socio-geográficas y factores asociados. Ciência & Saúde Coletiva. 2012;17(11):3195-3208. [ Links ]
7. Short Jr J. Poverty, ethnicity and violent crime. New York: Routledge; 1997. [ Links ]
8. Souza ER. Homicídios: metáfora de uma nação autofágica. [Teses de Doutorado]. Rio de Janeiro: Escola Nacional de Saúde Pública; 1995. [ Links ]
9. Haagsma JA, Graetz N, Bolliger I, Naghavi M, Higashi H, Mullany EC, et al. The global burden of injury: incidence, mortality, disability-adjusted life years and time trends from the Global Burden of Disease study 2013. Injury Prevention. 2016;22(1):3-189. doi: 10.1136/injuryprev-2015-041616. [ Links ]
10. González-Pérez GJ, Vega-Lopez MG, Ramos de Souza E, Wernersbach Pinto L. Mortalidad por violencias y su impacto en la esperanza de vida: una comparación entre México y Brasil. Ciência & Saúde Coletiva. 2017;22(9):2797-2809. [ Links ]
11. Aburto JM, Beltrán-Sánchez H, García-Guerrero VM, Canudas-Romo V. Homicides in Mexico reversed life expectancy gains for men and slowed them for women, 2000-10. Health Affairs. 2016;35(1):88-95. [ Links ]
12. Dávila Cervantes CA, Pardo Montaño AM. Análisis de la tendencia e impacto de la mortalidad por causas externas: México, 2000-2013. Salud Colectiva. 2016;12(2):251-264. doi: 10.18294/sc.2016.743. [ Links ]
13. González-Pérez GJ, Vega-López MG, Cabrera-Pivaral CE. Impacto de la violencia homicida en la esperanza de vida masculina de México. Revista Panamericana de Salud Pública. 2012;32(5):335-342. [ Links ]
14. Base de datos de defunciones 1979-2015 [Internet]. México DF: Dirección General de Información en Salud; 2015 [citado 10 oct 2017]. Disponible en: https://tinyurl.com/y8fkvjkg . [ Links ]
15. Mortalidad; Conjunto de datos: Defunciones por homicidios 2016 [Internet]. Aguascalientes: Instituto Nacional de Estadística y Geografía; 2016 [citado 19 nov 2017]. Disponible en: https://tinyurl.com/y9452acn . [ Links ]
16. Consejo Nacional de Población. Estimaciones (1990-2010). En: Proyecciones de la población 2010-2050 [Internet]. México DF: CONAPO; 2014 [citado 13 oct 2017]. Disponible en: https://tinyurl.com/ycchkabf . [ Links ]
17. Organización Mundial de la Salud. Clasificación estadística internacional de enfermedades y problemas relacionados con la salud [Internet]. Vol. 1. Washington: OPS; 1995 [citado 13 oct 2017]. Disponible en: https://tinyurl.com/ycjmbv4u . [ Links ]
18. Organización Panamericana de la Salud. Situación de salud en las Américas: Indicadores básicos 2015. Washington: OPS; 2015. [ Links ]
19. Särndal C, Swensson B, Wretman J. Basic ideas in estimation from probability samples. En: Särndal C, Swensson B, Wretman J, (eds.). Model Assisted Survey Sampling. New York: Springer; 1997. p. 24-58. [ Links ]
20. Comisión Económica para América Latina. La juventud en Iberoamérica: Tendencias y urgencias [Internet]. Santiago de Chile: CEPAL; 2004. [citado 13 oct 2017]. Disponible en: https://tinyurl.com/y9wr9h3w . [ Links ]
21. Instituto Nacional de Estadística y Geografía. Estadísticas a propósito del día internacional de la juventud (15 a 29 años). Aguascalientes: INEGI; 2016. [ Links ]
22. Xunta de Galicia. Epidat [Internet]. Versión 4.2. La Coruña: Xunta de Galicia, OPS; 2006 [citado 13 oct 2017]. Disponible en: https://tinyurl.com/yb25kx8j . [ Links ]
23. Arriaga EE. Los años de vida perdidos: su utilización para medir el nivel y el cambio de la mortalidad. Notas de Población. 1996;24(63):7-38. [ Links ]
24. Arriaga EE. Measuring and explaining the change in life expectancies. Demography. 1984;21(1):83-96. [ Links ]
25. Bocco M. La relación entre los años de vida perdidos y la esperanza de vida: aplicaciones para el análisis de la mortalidad. Notas de Población. 1996;24(63):39-60. [ Links ]
26. Bradshaw J, Edwards H, Lawton D, Staden F, Weale J, Weekes A. Area variations in infant mortality 1975-1977. Journal of Epidemiology and Community Health. 1982;36:11-16. [ Links ]
27. Murnan J, Dake JA, Price JH. Association of selected risk factors with variation in child and adolescent firearm mortality by state. The Journal of School Health. 2004;74(8):335-340. [ Links ]
28. Instituto Nacional de Estadística y Geografía. Encuesta nacional de victimización y percepción sobre seguridad pública (ENVIPE) 2015 [Internet]. Aguascalientes: INEGI; c2015 [citado 13 oct 2017]. Disponible en: https://tinyurl.com/ycddtj92 . [ Links ]
29. Instituto Nacional de Estadística y Geografía. Anuario estadístico y geográfico por entidad federativa 2016 [Internet]. Aguascalientes: INEGI; 2016 [citado 13 oct 2017]. Disponible en: https://tinyurl.com/y82xgnc4 . [ Links ]
30. Consejo Nacional de Evaluación de la Política de Desarrollo Social. Anexo estadístico de pobreza en México [Internet]. México DF: CONEVAL; c2016 [citado 17 nov 2017]. Disponible en: https://tinyurl.com/ydhjzodp . [ Links ]
31. Instituto Nacional de Estadística y Geografía. Anuario estadístico y geográfico por entidad federativa 2013 [Internet]. Aguascalientes: INEGI; 2014 [citado 17 nov 2017]. Disponible en: https://tinyurl.com/ycf6zcao . [ Links ]
32. Etienne CF, (dir.). Situación de salud en las Américas: Indicadores básicos 2017 [Internet]. Washington DC: OPS; 2017 [citado 17 nov 2017]. Disponible en: https://tinyurl.com/y7nv2u7t . [ Links ]
33. Organización Panamericana de la Salud. Homicidio en jóvenes en las Américas [Internet]. Washington DC: OPS; 2017 [citado 27 nov 2017]. Disponible en: https://tinyurl.com/y7b8c7h3 . [ Links ]
34. Escalante Gonzalbo F. Homicidios 2008-2009: La muerte tiene permiso. Nexos. 2011;397:36-49. [ Links ]
35. Montalvo TL. Una guerra por el dominio del país: la rivalidad entre organizaciones criminales. Narcodata [Internet]; c2015 [citado 18 ago 2016]. Disponible en: https://tinyurl.com/yb7mreoo . [ Links ]
36. González Veiguela L. El crecimiento del “narco” no es posible sin la complicidad de las autoridades. Esglobal [Internet]; 26 ene 2010 [citado 10 nov 2015]. Disponible en: https://tinyurl.com/y8rfwros . [ Links ]
37. González Veiguela L. Los cárteles más fuertes de México. Esglobal [Internet]; 28 jun 2018 [citado 10 nov 2015]. Disponible en: https://tinyurl.com/y832nr2x . [ Links ]
38. Astorga L. Seguridad, traficantes y militares: El poder y la sombra; Tiempo de Memoria. México DF: Tusquets; 2007. [ Links ]
39. Goodman C, Marizco M. U.S. Firearms trafficking to Mexico: new data and insights illuminate key trends and challenges 2010 [Internet]. Washington DC: Woodrow Wilson Center; 2010 [citado 12 sep 2016]. Disponible en: https://tinyurl.com/yaono5ya . [ Links ]
40 . Organización para la Cooperación y el Desarrollo Económicos. Panorama de la Educación 2014: Indicadores de la OCDE. Organización para la Cooperación y el Desarrollo Económicos [Internet]; c2014 [citado 15 oct 2017]. Disponible en: https://tinyurl.com/yc2qathy . [ Links ]
41. Orraca Corona M. Desigualdades, juventudes y violencia. En: Herrera Lasso Mijares L, (coord.). Fenomenología de la violencia: Una perspectiva desde México. México DF: Siglo XXI Editores; 2017. [ Links ]
42. Thornberry T, Krohn M, Lizotte A, Smith C, Tobin K. Gangs and delinquency in developmental perspective. Cambridge: Cambridge University Press; 2003. [ Links ]
43. Villaveces A, Cummings P, Espitia VE, Koepsell TD, McKnight B, Kellermann AL. Effect of a ban on carrying firearms on homicide rates in 2 Colombian cities. JAMA. 2000;283(9):1205-1209. [ Links ]
44. Pérez Gómez LE. Esperanza de vida en México: De cómo los indicadores pueden señalar catástrofes. Perseo. 2013;(10). https://tinyurl.com/ybjfx3wh. [ Links ]
45. Dávila-Cervantes CA, Pardo-Montaño AM. Magnitud y tendencia de la mortalidad por homicidios en Colombia y México, 2000-2011. Revista Panamericana de Salud Pública. 2014;36(1):10-16. [ Links ]
46. Fuerte-Celis MP, Pérez-Lujan E. ¡La violencia cambia!: Securitización y configuración territorial del crimen organizado en México, 2007-2011. Journal of Latin American Geography. 2017;16 (3):59-81. [ Links ]
47. Lozano-Ascencio R. ¿Es posible seguir mejorando los registros de las defunciones en México? Gaceta Médica de México. 2008;144(6):525-533. [ Links ]
48. Zunino MG, Souza ER. La mortalidad por armas de fuego en Argentina entre 1990 y 2008. Cadernos de Saúde Pública. 2012;28(4):665-677. [ Links ]
49. Gamlin J. Violence and homicide in Mexico: A global health issue. The Lancet. 2015;385:605-606. [ Links ]
50. Souza ER. Masculinidade e violência no Brasil: contribuições para a reflexão no campo da saúde. Ciência & Saúde Coletiva. 2005;10(1):59-70. doi: 10.1590/S1413-81232005000100012. [ Links ]
Received: January 23, 2018; Revised: November 08, 2018; Accepted: November 12, 2018
 Este es un artículo publicado en acceso abierto bajo una licencia Creative Commons
