


Services on Demand
Journal

Article
 English (pdf)
 Article in xml format
 Article references
 Send this article by e-mail
Indicators
-
 Cited by SciELO
Related links
-
 Similars in
SciELO
Similars in
SciELO
Share

 Permalink
Revista americana de medicina respiratoria
On-line version ISSN 1852-236X
Rev. am. med. respir. vol.17 no.1 CABA Mar. 2017
ORIGINAL ARTICLE
GOLD 2011 A-D CHART under the microscope. Responding to COPD physiopathogeny with implications in disease management
Authors: Uribe Echevarría Loli1, García González Jorge1, Nevado Alberto1, Álvarez Ruth2, Maldonado Cristina3
1Pneomonology Department. Sanatorio Allende - Nueva Córdoba
2Centro de deshabituación Tabáquica Nuevo Hospital San Roque - Córdoba
3Centro de Microscopia Electrónica. FCM-UNC
Correspondence: Loli Uribe Echevarría uribe@cmefcm.uncor.edu
Received: 05.20.2016
Accepted: 11.18.2016
Abstract
The purpose of this study was to analyze sputum cellular phenotype in patients with a diagnosis of COPD classified according to the A-D chart.
We included patients of both genders, aged ≥ 60 years, who were former smokers of at least 10 packets/year, with a diagnosis of COPD under stable conditions. They were classified according to the 2011 GOLD criteria into clinical categories A, B, C, D and their bronchial inflammatory pattern was analyzed using sputum cytology.
Eighty-five patients with a diagnosis of COPD were divided into category A (19), B (29), C (19) and D (18); the age of the latter was significantly higher than the rest of the patients. The predominant cellular pattern in sputum was eosinophilic (43), neutrophilic (17), mixed (9) and paucigranulocytic (16). The distribution of the predominant cellular pattern in connection with each COPD clinical group was statistically significant p ≤ 0.001. The neutrophilic cellular phenotype was predominant in group A; the eosinophilic and mixed phenotypes in groups B and C, and in group D, even though eosinophils were present, the predominant pattern was neutrophilic.
We concluded that this study identified inflammatory cellular patterns that distinguish each group in the COPD A-D chart, which can contribute to explain their heterogeneous nature, customize treatment and, most of all, identify patients at risk of disease onset and perpetuation at an early stage.
Introduction
Chronic Obstructive Pulmonary Disease (COPD) is a complex and heterogeneous condition, and the severity of airflow limitation measured by spirometry does not reflect the full complexity of the disease1; for instance, there are patients with few symptoms and very symptomatic patients, patients with exacerbations and those who do not suffer from frequent exacerbations. In consequence, the 2011 GOLD guidelines2 suggest assessing patients with COPD by their degree of airflow obstruction, and including clinical variables such as level of dyspnea and annual frequency of exacerbations. Based on the results of this assessment, four groups (or categories) of patients can be identified, which are divided into A-B-C and D.
Groups A and B are defined depending on the risk (predicted FEV1 ≥ 50% and no more than one exacerbation per year); therefore, patients have to fulfill these two requirements to be classified into one of these two groups. Groups C and D allow many possible combinations. For instance, a patient can be classified into group C due to his reduced amount of symptoms (by definition) and, either a predicted FEV1 ≤50%, two or more exacerbations / year or more than one hospitalization per year (according to GOLD 2013)3, or both, the same happens with the patients in group D. However, this does not entirely reflect the different dimensions of COPD, even with this combined assessment design. Given the heterogeneity of COPD, it is essential to approach disease management in a personalized manner and recur to reliable biomarkers to identify the best treatment option for the most suitable patient4.
For this reason, after acknowledging COPD –an inflammatory disease– as a physiopathogenic substrate, it was proposed to analyze the cellular phenotype of induced sputum in patients classified according to the 2011 GOLD A-D chart.
Materials and Methods
This is an observational, prospective and cross-sectional study. In order to elaborate the objective proposed, patients from the Pneumonology Department of Sanatorio Allende (Nueva Córdoba) and of Centro de Deshabituación Tabáquica del Nuevo Hospital San Roque de Córdoba were included. It was approved by Sanatorio Allende’s Ethics Committee and the patients voluntarily agreed to sign a written informed consent form. Patients included had COPD criteria according to the 2011 GOLD guidelines2; we included patients of both genders, aged ≥ 60 years, who were former smokers of at least 10 packets/year. Patients should not be current smokers and should have quit smoking at least 6 weeks before they were included in the protocol to avoid erroneous results in the induced sputum percentage of inflammatory cells, particularly neutrophils. They should not have had COPD exacerbations, defined as acute episodes characterized by the aggravation of the patient’s respiratory symptoms exceeding the regular daily variations and requiring a change in medication2. They should not have been treated with systemic steroids or inhaled them during the six weeks prior admission, the latter with the exception of those with COPD and frequent exacerbations due to ethical reasons. They should not have infectious diseases at that moment or during the six weeks prior enrolment; in addition, they should not have had bronchial asthma during their childhood and/ or adolescence, cardiovascular diseases (heart failure) other than ischemic diseases, neoplasias and collagen diseases. Intake of known pneumotoxic drugs was prohibited, as well as individuals at pulmonary risk due to workplace exposure; patients with any chronic respiratory disease other than COPD, gastroesophageal reflux, obesity (BMI ≥ 30), mental or physical disabilities that could hinder collaboration in the study were excluded.
Study Design
During their first visit, all patients who met the inclusion criteria were submitted to a thorough medical record questionnaire. Variables documented were age, gender, spirometric parameters according to ATS/ERS guidelines5 collected with the Cosmed Quark Spiro Series System 3700 (Cosmed SRL Italy 2015®) spirometer with daily standardization as per technical specifications; packets/year smoking rate. Depending on their symptom variables, FEV1, MRC dyspnea scale and history of exacerbations, they were classified into A-B-C and D COPD, as appropriate2.
During their second visit after enrollment, an induced sputum sample was collected whether the classification of the clinical severity of COPD was identified or not, so as not to influence the results.
Collection and processing of induced sputum (IS)
Samples of IS were collected following the usual protocol described above6. Patients had their Peak Expiratory Flow (PEF) measured and they were administered 200 mg of salbutamol for inhalation in aerosol form using a MDI. After 15 minutes, their PEF was measured again and they were nebulized with saline solution in increasing concentrations of 3%, 4% and 5%, using an ultrasonic Ultraneb 2000 De Villbis nebulizer. Their PEF was measured after each nebulization. If their PEF dropped <10%, we continued increasing the concentrations. If their PEF dropped between 10% and 20%, the concentration of hypertonic saline was not increased, but the inhalation time with the same concentration was prolonged. This technique was interrupted when patients showed symptoms of respiratory discomfort and when their PEF dropped by 20% or more compared to its baseline value.
We selected the viscous material from the sputum collected, separating the saliva. We added 4 mL of dithiothreitol (DTT) per mg of sputum, shook it for 15 seconds and then placed it for 10 minutes in a double boiler to 37°C. After filtering it using a 48 μm-thickness gauze, a PBS volume (Phosphate Buffer saline) equal to the volume of DTT was added. Cellular viability was determined using trypan blue solution, and we proceeded with the protocol when it exceeded 50%. The cells obtained were counted in the Neubauer chamber, spun down and resuspended in PBS at a concentration of 1 × 10⁶ cells/mL. The suspension was used to prepare slide trays (Cytospin) using cytocentrifugation (Giumelli) at 450 rpm for 4 minutes.
To identify the IS cells, cytospins were dyed with May Grünwald-Giemsa and a differential counting was performed, including neutrophils, macrophages, lymphocytes and bronchial epithelial cells. The percentage was calculated based on a minimum of 200 non-bronchial squamous cells. The cellular phenotype was classified depending on the predominant cell percentage in the cytospin differential counting. Cellular patterns were classified into: eosinophilic (E) (≥ 3% of eosinophils); neutrophilic (N) (≥ 65% of neutrophils); mixed (M) (eosinophilic ≥ 3% of eosinophils + neutrophilic ≥ 65%) and paucigranulocytic (P) (non-eosinophilic <3% non-neutrophilic <65%)7.
Statistical analysis
The size of the sample could not be less than 15 in each group. It was calculated to achieve 80% power with an alpha error of 0.05, to detect a 15% difference in the absolute eosinophil percentage count within the different subgroups of patients. Results are presented as mean ± standard deviation for the numerical variables and as absolute frequencies for the categorical variables. The differences between groups were analyzed using the Kruskal- Wallis test for the variables with normal distribution. After the Kruskal-Wallis test, we performed multiple comparisons using T-statistic based on the ranges. A contingency table was used for the categorical variables. For the statistical analysis, we used Infostat statistical software (Facultad de Ciencias Agropecuarias- Universidad Nacional de Córdoba). A p value < 0.05 was considered statistically significant.
Results
Eighty-five patients who met the screening criteria were analyzed, and they were classified into COPD A (19), B (29), C (19) and D (18) using spirometric and clinical variables. The demographic characteristics of the patients are summarized in table 1. It should be noted that the age of patients in clinical group D was significantly higher than the rest of the patients. According to the predominant sputum cellular pattern, we obtained E (43), N (17), M (9) and P (16), graph 1. When the cellular phenotype of sputum was compared with the clinical stage of COPD, the distribution was statistically significant, identifying clinical profiles with a distinctive cellular type, graph 2. Likewise, each patient identified with a color circle based on his/her cellular phenotype was placed in the COPD A-D chart, graph 3. Interestingly, there was a predominant cellular pattern distribution in each group, such as neutrophilic in group A; eosinophilic and mixed in groups B and C, and in group D, even though eosinophils were present, the predominant pattern was neutrophilic.
Table 1. Characteristics of the patients

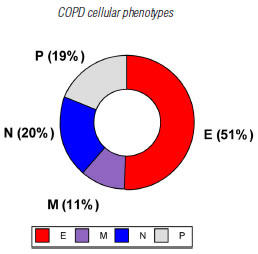
Graph 1. Cellular phenotypes in sputum samples from patients with COPD. E: eosinophilic (≥ 3% eosinophils), N: neutrophilic (≥65% neutrophils), M: mixed (eosinophilic and neutrophilic), P: Paucigranulocytic (neither eosinophilic nor neutrophilic).
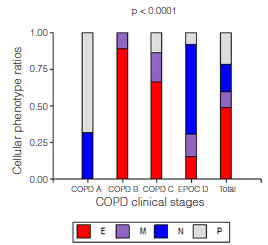
Graph 2. Cellular phenotype ratio distribution according to different COPD clinical studies (2011 GOLD Classification). We concluded that the ratios in the groups were not equal; there was an association between cellular phenotype and clinical classification p <0.0001. COPD A included cellular phenotypes N and P; COPD B, cellular phenotypes E and M; COPD C, cellular phenotypes E, M and P; and COPD D included every cellular phenotype in different proportions.
Cellular phenotype: E: eosinophilic (≥ 3%), N: neutrophilic (≥65%), M: mixed (eosinophilic and neutrophilic), P: Paucigranulocytic (neither eosinophilic nor neutrophilic).

Graph 3. Cellular phenotype distribution according to the GOLD 11 clinical classification of COPD.
Each circle represents a patient and each color his/her cellular phenotype. Eosinophilic, Neutrophilic, Mixed, Paucigranulocytic.
Discussion
We analyzed the inflammatory metric characteristics to interpret the complexity of COPD more specifically than with the unidimensional analysis of FEV1 and even with the combination of clinical variables, such as dyspnea and frequency of exacerbations. The results of this study evidenced there are predominant inflammatory cellular phenotypes in each COPD group, which could be a potentially significant step towards a more personalized disease approach.
These current results allow to interpret some clinical characteristics more clearly, as well as the temporal stability and long-term results of the four groups of patients analyzed in previous cohort studies1. Taking into account the groups with a lower risk of exacerbations, such as groups A and B, with the singularity that they have a similar FEV1; still, group B has symptoms and a tendency of the disease to progress in severity unlike patients in group A, who are not very symptomatic and tend to stay in the same group over the years. The eosinophilic cellular predominance observed in group B could explain these differences, given that the cytotoxic effects of eosinophils are well-known, as well as the clinical symptoms caused by the autoaggression against the cells of the bronchial epithelium8,9. These findings would also explain why groups B and C had greater variations during the follow-up period10, emphasizing the need to identify the inflammatory pattern at an early stage of the disease and to consider a suitable treatment option.
Patients with COPD from groups B and D were evaluated using the ECLIPSE study10, and they were the patients with the highest comorbidity tendency due to persistent systemic inflammation. It is possible that in the case of patients from group B, who only receive long-acting bronchodilators as treatment based on the (GOLD) guidelines, the systemic inflammatory effects caused by eosinophils are neglected, and in group D, the combination of the typical inflammatory mediators from eosinophils and neutrophils, along with a more prolonged chronology of the disease, determines an increased vulnerability to comorbidities observed in these groups.
It is interesting to analyze groups C and D, and it is considered inaccurate to classify them just by the history of exacerbations during the previous year. In this study, patients from both groups continued with the recommended conventional treatment for ethical reasons; however, even so, only a minority from group C could restore their inflammatory state to normal (paucigranulocytic); these patients could be viewed as those with a progress in severity over time, but who managed to attain stability with few symptoms. The rest from group C, in whom eosinophils still persisted, perhaps due to an inadequate dose of inhaled steroids (the doses suggested for COPD are different from those suggested for asthma) or an inadequate response to steroids, were those who not only progressed in severity over time, but who also had a progressive increase in the number of exacerbations per year11. In the case of patients from group D, in a similar way, there were those with frequent exacerbations, perhaps those who persisted with eosinophils in their bronchial cytology, and the most severe ones regarding airflow limitation, which coincided with an increased progression of the disease over the years, along with the deleterious effects of neutrophils. Our work team is conducting investigations about eosinophils and neutrophils associated with the biology, cellular death and consequences of these undeniable protagonists of COPD. It is possible that, as a hypothesis, eosinophils are involved in triggering the disease and in the progression of the severity of symptoms, generating chemotaxis of neutrophils, perpetuating and aggravating the disease even more during the last stages.
Cohort studies evidenced that most of the patients assigned to groups A and D continued to belong to the same groups without modifications in disease severity. It is possible that in the case of group A, which has the cellular predominance of a neutrophilic or paucigranulocytic bronchitis, it involves an inflammatory pattern caused by chronic exposure to cigarette smoke without the predisposing factor to trigger eosinophilic inflammation which, as it has been mentioned before, would be responsible for the symptoms and progression of the disease. In the case of group D, we considered age as an influential factor, as it is evidenced by the demographic characteristics of our patients and perhaps the final stages of the disease.
Bartoli et al.12 have recently identified and published a Letter Researc with cellular inflammatory phenotypes based on 2011 GOLD criteria immediately after we completed our results, but before we published them. Both of the designs are similar, although their results do not concur with ours, perhaps due to the demographic differences of both study populations and, particularly, because they used different percentage cut-off points for eosinophils and neutrophils to define eosinophilic and neutrophilic cellular phenotypes based on suitable international criteria7,13.
When analyzing the strengths, even though this is not the first study that identified cellular phenotypes in sputum based on the 2011 GOLD COPD A-D groups; it is the first one that acknowledged eosinophils as protagonist cells in the physiopathogeny that triggers the symptoms and progress of the disease.
As weakness, we consider that it would have been more relevant to analyze groups C and D without anti-inflammatory therapy, to assess the inflammatory pattern in its natural state. This detail has already been contemplated and endorsed as an ethical recommendation for future research projects conducted by our work team. It should be noted that, even though it is not a weakness of the design of this project, nonetheless, the results generate new investigation questions and work hypotheses that suggest patients at an early age should be included.
We concluded that this study identified inflammatory cellular patterns that distinguish each group of the COPD A-D chart, which can contribute to evaluate the physiopathogeny associated with the heterogeneity of the disease, customize treatment and, most of all, assess the inflammatory cellular phenotype of patients who are smokers and at risk of disease onset and perpetuation at an early stage. In that respect, we recommend the use of bronchial cytology of induced sputum samples as a reliable diagnostic method that is accessible for any pneumonology specialty center.
Once again, we emphasize the need and usefulness of non-invasive and reliable diagnostic tools, such as sputum cytology, as well as guideline recommendations, to optimize personalized management of COPD.
Conflict of Interest: The authors declare that there is no conflict of interest associated with this publication.
1. Alvar Agusti, Suzanne Hurd, Paul Jones, Leonardo M. Fabbri, Fernando Martínez, Claus Vogelmeier, Jørgen Vestbo and Robert Rodriguez-Roisin. FAQs about the GOLD 2011 assessment proposal of COPD: a comparative analysis of four different cohorts. Eur Respir J 2013; 42: 1391-1401 [ Links ]
2. Global Initiative for Chronic Obstructive Lung Disease (GOLD). Global strategy for the diagnosis, management and prevention of chronic pulmonary disease, 2011. http://www.goldcopd.org/Guidelines/guidelines-resources.html [ Links ]
3. Global Initiative for Chronic Obstructive Lung Disease. Global strategy for the diagnosis,management, and prevention of chronic obstructive pulmonary disease. www.goldcopd.org/uploads/users/files/GOLD_Report_2013_Feb20.pdf Date last updated: February 20, 2013. [ Links ]
4. Roberto Benzo, Kristin Vickers, Paul J. Novotny, Sharon Tucker, Johanna Hoult, Pamela Neuenfeldt, John Connett, Kate Lorig, and Charlene McEvoy “Health Coaching and Chronic Obstructive Pulmonary Disease Rehospitalization. A Randomized Study”, American Journal of Respiratory and Critical Care Medicine, Vol. 194, No. 6 (2016), pp. 672-680.
5. Miller MR, Crapo R, Hankinson J, et al. General considerations for lung function testing. Eur Respir J 2005; 26: 153-161. [ Links ]
6. Uribe Echevarría EM, Maldonado C, Uribe Echevarría A, Aoki A, Neutrophil predominance in asthmatic induced sputum. Therapeutic implication and the role of Clara cells 16-kD protein. Medicina (Buenos Aires) 2011; 71: 343-349 [ Links ]
7. Dasgupta A, Neighbour H, Nair P. Targeted therapy of bronchitis in obstructive airway diseases Pharmacol Ther. 2013;140(3): 213-222 [ Links ]
8. Czarnetzki BM, Pawelzik B The role of eosinophils in inflammatory reactions. Fortschr Med. 1983 5;101(47-48): 2167-2174 [ Links ]
9. Shimizu S1, Kouzaki H, Ogawa T, Takezawa K, Tojima I, Shimizu T. Eosinophil-epithelial cell interactions stimulate the production of MUC5AC mucin and profibrotic cytokines involved in airway tissue remodeling. Am J Rhinol Allergy. 2014 Mar-Apr;28(2): 103-109 [ Links ]
10. Agusti A, Edwards L, Celli B, et al. Characteristics, stability and outcomes of the GOLD 2011 COPD groups in the ECLIPSE cohort. Eur Respir J 2013; 42: 637-647 [ Links ]
11. Pauwelsa R, Calverleyb P, Buistc AS, Rennardd S, Fukuchie Y, Stahlf,g E, Löfdahlf CG. COPD exacerbations: the importance of a standard definition. Respiratory Medicine 2004 98, 99-107 [ Links ]
12. Bartoli ML, Costa F, Malagrinò L, et al. Sputum inflammatory cells in COPD patients classified according to GOLD 2011 guidelines. Eur Respir J. 2016;47(3): 978-80 [ Links ]
13. Nair P. Update on clinical inflammometry for the management of airway diseases. Can Respir J. Mar-Apr 2013;20(2): 117-120. [ Links ]

