


 Inglés (pdf)
 Articulo en XML
 Referencias del artículo
 Enviar articulo por email
 Citado por SciELO
  Similares en
SciELO
Similares en
SciELO 
 Permalink
I. Introduction
Thepresence in the atmosphere of a vertical electric field, or Potential Gradient (PG), is a result of the global atmospheric electric circuit (GAEC) an insulating atmosphere separateing two good electrical conductors: the Earth’s surface and the iono sphere. Electric generators in the atmosphere, such as thunderstorm clouds and electrified shower/rain clouds, transfer positive charge to the ionosphere in disturbed weather conditions. The current circuit closes through fair weather (FW) conditions far from the electric generators (1) where current flows to the ground. In a short report revisiting the basic concept of the GAEC (2), observations suggest that the simplified Earthionosphere spherical capacitor model is a flawed. “Earthatmosphere capacitance” was identified as an alternative quantity, based on a negative charge on the Earth and a compensating positive charge in the lower atmosphere. The “Earth-atmosphere potential” may be set approximately equal to the ionospheric potential because the latter undergoes minimal changes above roughly 20 km.
A large number of studies were made during the 19th century concerning atmospheric electricity. The voyages of a geomagnetic research vessel carried out by the Carnegie Institution of Washington between 1909 and 1929 has certainly been among the most relevant (3). In this study, hourly measurements of PG were made around the world’s FW oceans. The results showed that the average daily variation of PG on days with FW conditions did not depend on the geographical position of the ship and indicated a clear daily FWPG variation. The global diurnal climatological FW-PG variation is still known today as the Carnegie Curve following their pioneering work. The Carnegie curve shows a clear maximum at around 19 UTC (of approximately 130 Vm−1) and a minimum at around 03 UTC. As detailed in Harrison et al. (2004) (3), Whipple and Scrase found, in 1936, a positive correlation between the Carnegie curve and the diurnal variation of the global thunderstorm area, supporting the current GAEC model where charge separation in thunderstorms sustains large scale current flow around the planet (4).
The interconnection of the GAEC across the globe reaffirms the importance of PG studies. The Carnegie curve is generally in correspondence with the diurnal variation of the ionospheric potential. For this reason, studying the local curves, i.e., the average surface FWPG daily variation at different geographic locations, can provide valuable insight into the regional interconnections within the GAEC.
Harrison et al. (2004) (5) showed a good agreement between the FWPG daily variations measured at both the Carnegie research vessel and the Eskdalemuir (Scotland) station on selected days between 1928 and 1929. Similarly, the daily averaged FWPG variations obtained at Lerwick (Scotland) with data between 1968 and 1973 compared well to the Carnegie curve, showing temporal consistency in diurnal variation over the 20thcentury (3, 5). These surface PG observations have shown that the Carnegie curve has remained virtually unchanged during the 20th century.
The diurnal variations in FWPG are influenced by the GAEC, but PG is also modified by local meteorological conditions. Several studies have shown that it is affected by altitude, latitude, temperature, pollution, wind, and humidity, among other variables (6,7). Local processes associated with the change in electrical conductivity of the air generate variations in PG. Changes in air conductivity are usually associated with changes in aerosol concentration (8, 9). Variation in boundary layer height, surface wind or ion production rate are some of the causes that affect aerosol concentration ). In heavily polluted locations, for example, PG was used as a proxy for air pollution (11, 12). The effect of smog has not only generated variations on the diurnal scale, but also on other time scales, as studied in the work of Silva et al. (2016), (13) where a weekly cycle is observed. Differences in the daily amplitude of PG have also been detected between coastal and continental stations, as observed in Lucas (14).
Bennett and Harrison (2007) (6) have observed that when an air mass undergoes a transformation, the variation in aerosol concentration generates changes in PG. Likewise, Piper and Bennett (2012) (15) found that the sum of the processes of morning temperature inversions, where air parcels do not rise due to lack of convection, along with sufficiently intense load generation, results in negative PG values. In these cases, PG variability is due to turbulence associated with nearby obstacles.
In the presence of an eclipse, the change in solar radiation can cause changes in a multiplicity of meteorological variables; for example, a drop in nearsurface temperature alters atmospheric stability and hence turbulence (16), being thus associated with a decrease in the height of the mixing layer and the height of the cloud base (17,18). These changes can lead to variations in the PG, as observed in the work of Manohar et al. (1995) (16). Based on data from the total solar eclipse of 16 February 1980, they found that the decrease in turbulence was accompanied by an increase in the electrical conductivity of the air and a decrease in PG. In the March 2015 partial solar eclipse studied by Bennett et al. (2016) (19), the reduction in turbulence was not sufficient to influence PG observations. As a result of the time of year (spring) and time of day (early morning) of this eclipse, no significant changes on boundary layer turbulence, and hence atmospheric electricity, were expected. A total solar eclipse was studied by Tacza et al. (2016) (20) by analysing the observed changes in the lower ionosphere and its relation to the surface PG observations. The results showed a strong similarity between the time variability of both the increase in the PG during the eclipse and the phase of the Very Low Frequency (VLF) signal associated with variations in the low ionosphere (20). This study has suggested two independent manifestations of the effects of the total solar eclipse because, in principle, ionospheric electrical conductivity changes have no effect on the electric field on the Earth’s surface, but in this case a causal relationship between the two could not be excluded.
On December 14, 2020, a total solar eclipse was visible with 100% obscuration in Northern Patagonia, Argentina. This event occurred during the midday hours in Argentina, during the passage of a summer cold front. In order to study this eclipse, a field campaign under the name of “Solar Eclipse 2020 Project” was carried out and meteorological instruments were installed in the city of Valcheta, in the province of Rio Negro, where the eclipse reached 100% obscuration. This measurement campaign complements the observations from instruments installed permanently in other areas of Argentina: at the Instituto de Investigaciones Cient´ıficas y T´ecnicas para la Defensa (CITEDEF) in the province of Buenos Aires and at the Complejo Astron´omico El Leoncito (CASLEO) in the province of San Juan. The “Solar Eclipse 2020 Project” provided a unique opportunity to analyse the impact of this eclipse on PG observations taken simultaneously at different observation sites.
The aim of the present work is to analyse the response of PG in three sites of the country: Valcheta (100% darkening), Buenos Aires (73%) and El Leoncito (71%) during the total solar eclipse of December 14, 2020, and to evaluate if the correlation of this variable with other meteorological measurements in situ can be observed.
II. Data and methodology
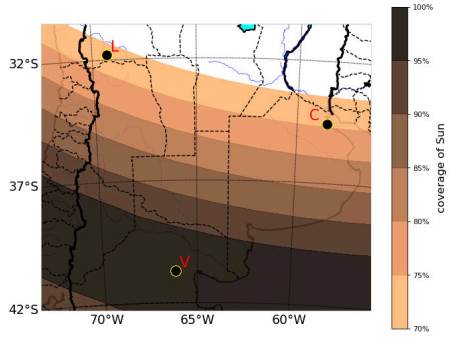
The total solar eclipse of 14 December 2020 over Argentina occurred during the Argentine summer, close to the annual maximum of incoming solar radiation intensity. Its path over central and southern Argentina is illustrated in Fig. . The positions of each station are marked with a full black circle: Valcheta (V), CITEDEF (C) and CASLEO (L). In Valcheta the average temperature in December is 20°C. In CITEDEF the average value is 22°C during the last month of the year, while the average value in CASLEO is 24°C.
The PG sensor installed in Valcheta (40’37”S, 66’52”W, 565 masl) is a Campbell Scientific CS110. The measurement range of the sensor is ±21000 Vm−1 with a temporal resolution of 5 s. The PG values were registered every 5 seconds. As part of the campaign, the National Meteorological Service (SMN) also installed a Campbell Scientific model CR310 automatic weather station. The same PG sensor is installed at a height of 2 m above the ground at CITEDEF (34’ 19.62” S, 58’ 22.40” W, 20 masl), in the province of Buenos Aires.
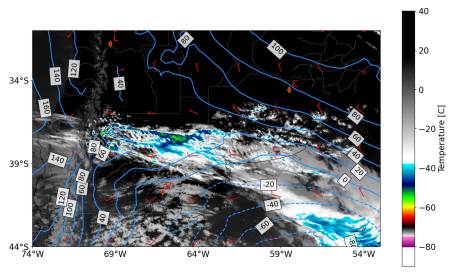
Figure 2: Image acquired from GOES 16 on 14 December 2020 at 16 UTC. The image corresponds to channel 10.33mum. The locations of CASLEO (L), CIT-EDEF(C) and Valcheta(V) are shown. The 1000 hPa isohypses are shown in light blue lines and the wind vectors (ms−1) at the same level extracted from the ERA 5 reanalysis model for 16 UTC on the day of the eclipse are shown in white.
The measurement range and resolution of the PG sensor are the same as the instrumentation at Valcheta. PG has been measured continuously at this institution from 2017 to the present, in conjunction with data from a Campbell Scientific automatic weather station. For this work, PG measurements within the CASLEO site (31’S, 69’W, 17’35”W, 2480 masl) belonging to the Global Coordination of Atmospheric Electricity Measurements (GloCAEM) project are also available. The PG data recorded in CASLEO come from a Boltek EFM-100 meter. The measurement range of the sensor is ±20000 Vm−1 with a temporal resolution of 1 s. Meteorological data to complement the analysis of the eclipse at this location were provided by CASLEO. The automatic meteorological station is located nearby at 31° 47’ 54”S, 69° 17’ 44”W at 2552 masl.
During the total solar eclipse, the region of maximum obscuration in the northern Patagonian region was being affected by the passage of a cold front which was promoting substantial coldair advection (21). The wind during the whole day had an average of approximately 10 ms−1s. It is also important to note that according to the World Wide Lightning Location Network (WWLLN) there was no electrical activity associated with the system during its passage through the station. Near CITEDEF and CASLEO the situation was prefrontal. Figure shows a GOES 16 image of the ABI 10.33 µm channel showing the position of the cloudiness with respect to the measurement stations at 16 UTC. The 1000 hPa isohypses and the wind in ms−1 are also shown, which allow us to associate the frontal surface region with the cloudiness.
To meet the aims of this study, the next section analyses the evolution of irradiance, relative humidity, temperature, PG and wind at the 3 locations (Valcheta, CITEDEF and CASLEO) on the day of interest. The evolution of PG during the day of the eclipse is also compared with the daily mean FW-PG curve, only available for CITEDEF and CASLEO. At CITEDEF the daily mean FW-PG curve was calculated by Velazquez (2021) following a meteorological classification of days with relative humidity lower than or equal to 95%, a correlation coefficient between the real and theoretical irradiance curve greater than or equal to 0.99 (i.e., a high correlation of the observed irradiance and the theoretical solar irradiance curve indicates days with little or no cloud cover) and average hourly winds between 1 ms−1 and 8 ms−1) (22). At CASLEO, the FW-PG curve was provided by J. Tacza as calculated following an observational approach (23). For FW conditions, this approach considers two requirements: days having a daily variation approximately similar to the Carnegie curve, meaning the PG values higher between 12-24 UTC compared to values between 00-12 UTC, and days with PG values in the range 0-200 V/m (based on the histogram of PG values recorded) assuming that the number of days in FW conditions is greater than the number of days in disturbed weather (23). Note that the criteria for choosing FW days is different.
In order to analyse a possible response of the PG to a change in turbulence, the relationship between PG and temperature was studied by means of a scatterplot. The existence of a relationship was quantified by the covariance value between the two series. The significance of this relationship was calculated by means of Pearson’s correlation coefficient. The same analysis was performed between PG and wind. These analyses have been performed in 3 time windows: 3 hours before the beginning of the eclipse, during the eclipse where a change in radiation is observed, and 3 hours after the end of the eclipse.
To this end, several different astronomical parameters for this total solar eclipse were computed using the freelyavailable “pyephem” module running on Python made publicly available by Graeme Coates at the Chromosphere website1. These parameters include the time of start, maximum and end of obscuration at each station, and maximum percentage of obscuration over the Southern Hemisphere as a function of latitude/longitude.
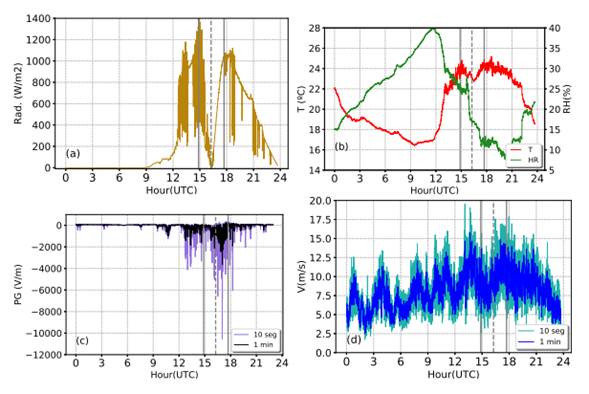
Figure 3 Measurements at Valcheta during the total solar eclipse of 14 December 2020: (a) solar irradiance every 10 seconds, (b) temperature (red) and relative humidity (green) every 10 seconds, (c) PG every 10 seconds (light violet) and the 1 minute average (black), and (d) wind speed every 10 seconds and the 1 minute average (blue and light blue respectively). The vertical grey lines indicate the start, maximum (dashed) and end times of the eclipse for the site.
III Results
The total solar eclipse of interest (see Fig. 1) was visible at the Valcheta station with a total occultation at 13:16 LT (16:16 UTC); at CITEDEF the maximum coverage was 73% reaching its maximum 18 minutes after Valcheta (i.e., 16:34 UTC), and at CASLEO the maximum coverage reached 71%, with the maximum approximately 10 minutes earlier than at Valcheta (i.e., 16:06 UTC). Measurements of irradiance, temperature, wind, PG, relative humidity and pressure during the whole day of 14 December at Valcheta are shown in Fig. 3. The vertical dashed line marks the maximum occultation. Associated with the frontal position, the presence of cloudiness was important during the beginning of the eclipse as observed between 15 UTC and 15.30 UTC in the irradiance measurement. A clear reduction of irradiance is observed 30 minutes before the maximum of the eclipse with a much smaller interference by cloud cover. From the maximum of the eclipse onwards, an even smaller interference by cloud cover is observed in the irradiance curve. There is a temperature reduction of approximately 1° C from 16 UTC to the minimum temperature associated with the eclipse, reached at 16.30 UTC. Relative humidity remains almost constant between 16 and 17 UTC. On the other hand, there is no clear evidence of a drastic change in the wind due to the eclipse because of the large synoptic wind. The absence of large changes in wind speed does not allow the detection of indirect changes in the behaviour of the atmospheric boundary layer. A drop of just over 1 ms−1 is observed in the average intensity before the temperature minimum.
The PG measurements show both large and very variable values, which could mask a possible response to the changes caused by the eclipse. Compared to the Carnegie curve and the daily mean FWPG local curves calculated in different geographic locations by previous studies (i.e. (24)), in Valcheta much larger values of PG and a much noisier pattern is observed, more related to Disturbed Conditions (DW) than to FW (i.e. (22)), with absolute values that reach values of the order of kVm−1, and with a negative sign.
In order to interpret the Valcheta PG measurements, it is essential to analyse the local environmental conditions. Valcheta is located in an arid area where, due to the lack of vegetation (semiarid region), strong winds can lead to dust suspension in the atmosphere. The wind throughout the day had a southerly component with a speed around 10 ms−1. Although these are not extreme values, the participants of the measurement campaign did report the presence of soil particles suspended in the atmosphere. The values of PG are comparable to those measured during disturbed weather conditions such as thunderstorms. These measurements motivate the analysis of the impact of atmospheric suspended dust on PG. This topic will be discussed in more detail below. In order to evaluate the relationship between PG and a change in turbulence because of reduction in
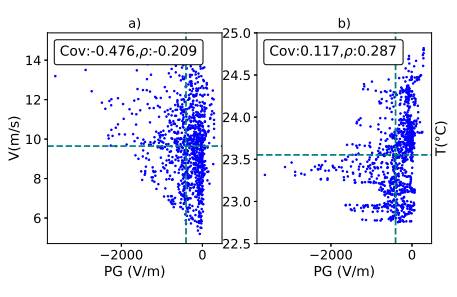
Figure 4 Scatter plots in Valcheta during the time of the eclipse: (a) PG versus wind intensity (every 1 minute), (b) PG versus temperature (every 1 minute). At the top left corner of each panel, the covariance (cov) and correlation coefficient rho() values are presented for each set. The vertical dotted lines correspond to the mean values of the series under analysis.
the incoming solar radiation, a scatter plot between PG and wind speed is presented in Fig. a for the data between the dotted lines in Fig. (i.e. under the effects of the eclipse). Similarly, Fig. b shows a scatter plot between temperature and PG under the effects of the eclipse only. The 3 series analysed (wind speed, temperature and PG) are averaged every 1 minute. In each panel of Fig. , the covariance and the correlation coefficient calculated for these data series in Valcheta are presented. As shown in Fig. a, the covariance is negative, such that PG and wind would have an inversely proportional relationship. The opposite occurs in Fig. b, showing a positive covariance. When trying to quantify these relationships, the calculated correlation coefficients show no significant correlation. This is clearly observed if the scatter plot is analysed, as there is no pattern in the behaviour of the data. The same was observed in the analysis of the 3 hours before and after the eclipse.
In contrast to Valcheta, the irradiance measured over CITEDEF shows a much smaller interference by cloud cover. Figure in fact shows negligible cloud cover at this location, which allows a clearer observation of the whole event. Measurements of irradiance, temperature, wind, PG, relative humidity and pressure during the eclipse at CITEDEF are shown in Fig. . It can be seen that the fall of radiation starts about 1 hour before the max imum occultation. As in Valcheta, there was a temperature drop of about 1°C from 16 UTC as a result of the eclipse, reaching the lowest temperature around 16.45 UTC. Relative humidity remained almost constant between 16.15 UTC and 17 UTC accompanying the temperature drop. On the other hand, the wind does not show a clear response to the temperature decrease. Interestingly, the order of magnitude of the wind was similar to that recorded at Valcheta during the whole event, but the behaviour of PG is very different.
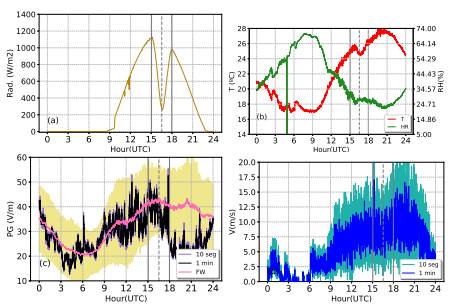
Figure 5 Measurements at CITEDEF during the total solar eclipse of 14 December 2020: (a) solar irradiance every 10 seconds, (b) temperature (red) and relative humidity (green) every 10 seconds, (c) PG every 10 seconds (light violet), the 1 minute average (black) and the FW-PG daily mean curve as calculated at CIT-EDEF (from (22), pink line) with ±σ (standard deviation) in yellow shading, and (d) wind speed every 10 seconds and the 1 minute average (blue and light blue respectively). The vertical grey lines indicate the start, maximum (dashed) and end times of the eclipse for the site.
Throughout the day, it is observed that PG shows a general correspondence with the daily FW-PG curve (pink line, as calculated in (22)) both in magnitude and variation, as evaluated at the site up to the time of the eclipse. The PG measurements during the eclipse do show a departure from the daily mean FW-PG. A few minutes before the time of maximum occultation, the PG decreases compared to the mean FW-PG curve. After the end of the eclipse, PG continues to decrease, reaching a minimum at 20 UTC that does not correspond with the behaviour of the FW-PG curve. It is important to note, however, that the day of the eclipse does not classify in the FW category according to the methodology used in (22) because the hourly mean wind intensity is sometimes less than the minimum critical value (1 ms−1).
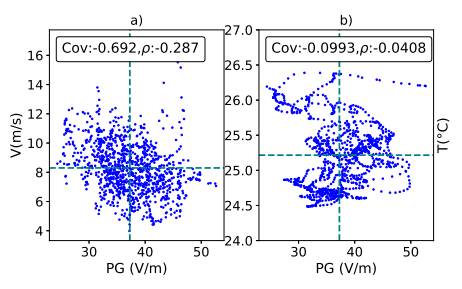
Figure 6 Scatter plots in CITEDEF: (a) PG versus wind intensity (1 minute averages), (b) PG versus temperature (1 minute averages). At the top left corner of each panel, the covariance (cov) and correlation coefficient (rho) values are presented for each set. The vertical dotted lines correspond to the mean values of the series under analysis.
Figure a presents the scatter plot between PG and the wind speed 1 minute averages during the time of the eclipse (i.e. only data between the dotted lines in Fig. at CITEDEF) and Figure b similarly shows the PG-temperature 1 minute averages scatter plot. In each panel, the covariance and the correlation coefficient calculated for these data series are presented. It can be seen in both panels that the covariance is negative, so the variables would have an inversely proportional relationship. As in the case of Valcheta, when quantifying this relationship again, no significant correlation is observed in any of the cases. In the analysis carried out 3 hours before and after the eclipse, no significant correlation was observed, either. Therefore, it was not possible to correlate the fall of PG after the eclipse with boundary layer processes following this methodology. However, this methodology is not conclusive, as the comparison of the PG curve on the day of the event shows an interesting deviation from the daily mean PG-FW.
At CASLEO, a similar situation to CITEDEF was observed: the sky had negligible cloud cover within a prefrontal regime, as shown in Fig. . The measurements of irradiance, temperature,
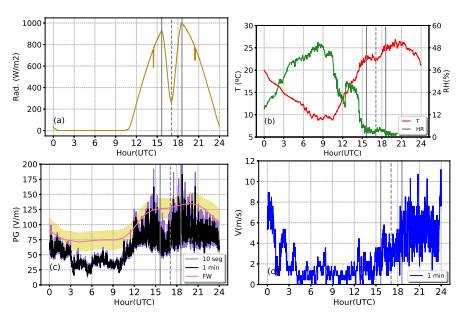
Figure 7 Measurements at CASLEO during the total solar eclipse of 14 December 2020: (a) solar irradiance every 1 minute, (b) temperature (red) and relative humidity (green) every 1 minute, (c) PG every 10 seconds (light violet), the 1 minute average (black) and the FW-PG daily mean curve as calculated at CASLEO (data from Tacza Jose, thank you for providing us with the FW curve data, pink line)with ±σ (standard deviation) in yellow shading, and (d) wind speed every 1 minute (blue). The vertical grey lines indicate the start, maximum (dashed) and end times of the eclipse for the site.
wind, PG, relative humidity and pressure during the eclipse at CASLEO are shown in Fig. . The absence of cloud cover (e.g. see Fig. a) could indicate clouds are not affecting PG. The wind at this location was one third of the value at Valcheta and CITEDEF at the time of the eclipse, and showed a much smaller relative humidity (approximately 3.5%). The fall of radiation starts about 1 hour before maximum occultation, as was the case at CIT-EDEF. As for the temperature, a minimum temperature (decrease of 1.5°C) is observed about 15 minutes after the minimum radiation and subsequent gradual recovery. Relative humidity at this station has values of approximately 3.5%, with a relative maximum during the temperature minimum. Wind at this station has the lowest average value of the three sites analysed, with a value of 2.5 ms−1. It also does not show a clear response of the wind to the change in incoming radiation. The PG variable, however, shows large variations, especially before and after maximum occultation, of the order of 100 Vm−1. A comparison with the local FW-PG curve presented by Tacza et al. (2021) (pink line, (23)) in Fig. c shows that the curve during the day of the eclipse is smaller in magnitude than the daily mean FW-PG curve and that a significant decrease is observed in PG during the eclipse, similar to that observed at CITEDEF. As discussed in Section II, the methodology used to calculate the FW-PG curve is not the same in CASLEO and CITEDEF, so it is worth clarifying this point. The daily mean FWPG curve is less comparable to the PG measured at the day of the eclipse at CASLEO than that at CITEDEF, because at CASLEO the classification scheme is not linked directly to meteorological variables. This could be the reason for the bias observed at CASLEO between the PG at the day of the eclipse and the FWPG curve. Nevertheless, both curves were plotted in order to keep in mind the behaviour of the PG on FW days and to evaluate the anomalies during the eclipse. Its behaviour during the time of the eclipse may indicate that as a result of the eclipse, the electrical conductivity of the air, and hence PG, is being influenced. The effect seems to be causing a decrease in PG, just as at CITEDEF. Additionally, note that according to the meteorological classification scheme proposed in (22), the day of the eclipse at CASLEO does not classify as a FW day since the hourly mean wind intensity is lower than 1 ms−1, as is similar to CITEDEF. Low hourly mean wind intensities have been shown to generate significantly large aerosol concentrations close to the sensor. However, this occurs also in the early morning at approximately 4 and 11 UTC, and the observed afternoon PG behaviour could be attributed to the eclipse.
In Fig. the scatter plots are presented for CASLEO, as done for the other measurement stations. Fig. a shows the PG-wind scatter plot during the time of the eclipse (i.e. between the dotted lines in Fig. ) for 1 minute averages. Similarly, Fig. b shows the PG-temperature scatter plot for 1 minute averages. In each panel, the covariance and the correlation coefficient calculated for these data series are presented. It can be seen in both scatter plots that the covariance is negative, so the variables would have an inversely proportional relationship, as analysed in CITEDEF. As in the previous cases, no significant correlation is observed in any of the cases with small correlation coefficients. The analyses of the 3 hours before and after did not show significant correlations. Both CASLEO and CITEDEF showed a drop in PG during the eclipse, as seen in comparison with the local daily mean FW-PG curves. These decreases in PG could not be correlated with the methodology used.
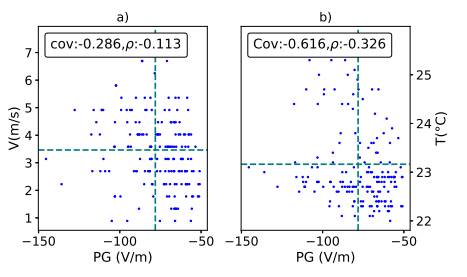
Figure 8 Scatter plots in CASLEO: (a) PG versus wind intensity (1 minute averages), (b) PG versus temperature (1 minute averages). At the top left corner of each panel, the covariance (cov) and correlation coefficient (rho) values are presented for each set. The vertical dotted lines correspond to the mean values of the series under analysis.
Worthy of note is the similarity in temperature, relative humidity and wind data at both Valcheta and CITEDEF during the period studied, along with the large differences that are observed in PG. One difference between the two measurement sites that could not be quantified was the amount of atmospheric dust suspended by the wind in Valcheta. As mentioned above, Valcheta is located in an arid region and has a high percentage of bare soil, unlike CITEDEF. The concentration of dust in the air on a clear sky day can also affect the PG measurements by affecting the current at low levels. In different studies carried out in semidesert regions it could be observed that the PG during the presence of dust vortices was able to generate variations of the order of Vm−1 up to the order of kVm−1 (25, 26). Esposito (2016) (27) discusses a linear relationship between the concentration of suspended dust and PG values, which can reach values of - 20 KV/m. This order of magnitude is the same as that observed during the passage of a storm in disturbed weather conditions, for example. In a large dust storm due to the passage of a cold front, Yair et al. (2016) (28) observed mostly positive PG values, but dust storms with negative PG values have also been reported (4, 13, 27). In general, the highest PG values are in dust storms, followed by dust devils and windblown sand currents (29).
In Velazquez (2021) (22), it was observed that there is a weekly scale impact on the mean value of PG on FW days at the CITEDEF station associated with the significant vehicle traffic on weekdays on the avenue adjacent to CITEDEF. The difference in the mean value between weekdays and weekends was significant, but both values were of the same order of magnitude as on FW days, meaning the effect of aerosols due to vehicles in CIT-EDEF has a lower impact than dust in Valcheta.
IV. Conclusion
The present study analyses the response of PG in three different sites of Argentina during the total solar eclipse of December 14, 2020: Valcheta (100% darkening), Buenos Aires (73%) and El Leoncito (71%). Measurements at Valcheta during the eclipse showed PG values several orders of magnitude higher and of opposite sign to the global daily mean FW-PG curve and the local FW-PG curves calculated at CITEDEF (940 km away) and CASLEO (1200 km away). The PG values at Valcheta were shown to be more closely related to disturbed weather conditions than FW, as was expected since Valcheta is closer to a frontal zone with occasional cloud coverage and reports of atmospheric suspended dust. On the contrary, at the other two locations studied, CITEDEF and CASLEO, further north and more distant from the frontal zone, the observed PG values on the day of the eclipse showed a higher consistency with the local daily mean FW-PG curves. In fact, Piscitelli and Saurral (2021) observed intense winds and overcast skies in the regions with a +95% obscuration (i.e. regions close to Valcheta) associated with the extratropical cyclone, in contrast to regions far from the umbra (i.e., CITEDEF and CASLEO) that were affected by light winds and clear skies during the same eclipse analysed in this paper (21). Their work shows that it was in regions far from the umbra that changes in the atmospheric boundary layer as a result of a sudden reduction in the incoming solar radiation were more clearly visible. Their findings are closely linked to the analysis of the PG observations analysed in this study, as in the simplest of cases, a reduction in temperature is expected to generate a reduction in the turbulent transfer of ions and charged aerosol, and hence affect the nearsurface PG. A solar eclipse is a schematic example of a variation in incoming solar radiation which alters the regional meteorological conditions by altering the stability of the nearsurface atmosphere and, therefore, production of turbulence. Regarding the meteorological variables examined in the present study, however, no effects on the PG were observed that can be unequivocally attributed to this event based solely on boundary layer dynamics. The prevailing synoptic situation altered the response that the boundary layer could have given to a drop in radiation in an anticyclonic situation. However, the evolution of PG during the day of the eclipse at CITEDEF and CASLEO compared with the daily mean FW-PG local curves shows that, far from the umbra, a decrease in PG is observed during the eclipse at both stations. These variations of PG did not respond in the same way as during the 2010 eclipse studied at CASLEO by Tacza et al. (2016) where the results show an increase of electric field during the eclipse period (20). These differences show the importance of improving our understanding of the GAEC and how PG responds to ionospheric changes as well as to meteorological changes in the troposphere and its boundary layer. As discussed in Bennett et al. (2016) (19), in addition to the indirect effects of boundary layer turbulence on atmospheric electrical properties, solar eclipses were suggested to increase cosmicray intensity at low latitudes, therefore increasing atmospheric ionization, through a reduction in Earthbound solar wind from obstruction by the moon (30). What is interesting to note is that, at both Valcheta and CITEDEF, after the time of maximum occultation, the wind intensity is of the order of 10 ms−1, and while the irradiance curves are not affected by cloudiness and the temperature and relative humidity patterns do not show significant differences, the orders of magnitude of PG measurements are very different. This could be associated with the reported atmospheric dust suspended in Valcheta, unlike at CITEDEF. The most recent studies show that the aeolian electric field (electric field processes associated with the erosion, transportation, and deposition of sediment by the wind) produced by dust storms or dust devils is very unsteady and depends on many factors, including wind speed, particle diameter, temperature, and also humidity (e.g. (27, 31, 32)). The charging of particles during the wind erosion processes, and the resulting generation of aeolian electrical fields in semidesert regions such as Valcheta, should be the subject of future studies. The installation of the PG instruments at Valcheta were motivated by the solar eclipse, and it is important to note that these types of field campaigns are challenging because the measurements are usually made in adverse locations and during very short periods of time. This study shows that PG can respond differently in areas with similar meteorological conditions (wind, relative humidity, temperature) and motivates the study of the effects on PG due to the presence of atmospheric suspended dust, as well as further longterm campaigns to better understand the processes associated with dust in the atmospheric electrical framework. Additionally, the behaviour of PG has so far received little attention in the region, but it has been shown to be a promising variable to monitor phenomena of different scales such as aerosols and storms.
(CONICET) and the National Universities of La Plata, C´ordoba and San Juan, and finally, Graeme Coates for making available the Python script to compute the astronomical parameters of the eclipse.

