


Servicios Personalizados
Revista

Articulo
 Inglés (pdf)
 Articulo en XML
 Referencias del artículo
 Enviar articulo por email
Indicadores
-
 Citado por SciELO
Links relacionados
-
 Similares en
SciELO
Similares en
SciELO
Compartir

 Permalink
Acta Odontológica Latinoamericana
versión On-line ISSN 1852-4834
Acta odontol. latinoam. vol.25 no.1 Buenos Aires abr. 2012
ARTÍCULOS ORIGINALES
Shrinkage stress and degree of conversion of a dental composite submitted to different photoactivation protocols
Karla M.C. Oliveira1, Ailla C.R.A. Lancellotti1, Renzo A. Ccahuana-Vásquez2, Simonides Consani1
1 Department of Dental Materials; Piracicaba Dental School - State University of Campinas, SP, Brazil.
2 Comprehensive Dentistry; University of Texas Health Science Center at San Antonio - San Antonio, TX, USA.
CORRESPONDENCE Dra. Karla Mychellyne Costa Oliveira Address: Av. Limeira, 901. Department of Dental Materials Piracicaba Dental School, University of Campinas UNICAMP. Piracicaba, SP. CEP: 13414-903. Phone: +55(19) 2106-5345 e-mail: karlamychellyne@yahoo.com.br
ABSTRACT
The aim of this study was to evaluate the polymerization stress and degree of conversion of a composite submitted to different photoactivation protocols. The composite Filtek Z350 was placed in the central perforation of a photoelastic disc and polymerized using a LED-based curing unit (BluePhase II - IvoclarVivadent) with energy density of 12, 24 or 36 J/cm2 using the following photopolymerization protocols: continuous high intensity (HI: 1200 mW/cm2 during 10, 20 or 30s), continuous low intensity (LI: 650 mW/cm2 during 18, 36 or 54s) and soft-start (SS: 150 mW/cm2 during 5 s + 1200 mW/cm2 during 9, 19 or 29s) (n=5). Photoelastic analysis was used to evaluate polymerization shrinkage stress and FTIR was performed to determine the degree of conversion of the composite. ANOVA 3-way procedure was used to determine the significance of the main effects and their interactions followed by two-way ANOVA for each time was performed (p<0.05). Shrinkage stress increased with higher values of energy. No statistically significant differences on polymerization shrinkage stress were found between high and low intensity activation modes. Softstart method generated stresses that were statistically lower than continuous modes except when 12 J/cm2 was applied. Similar degree of conversion was observed for photoactivation modes used, except for soft-start mode with 12, 24 and 36 J/cm2 that showed lowest levels of conversion. Energy density and activation mode influenced polymerization shrinkage stress, but no benefit on degree of conversion was observed.
Key words: Composite resins; Dental stress analysis; Polymerization.
RESUMO
Tensão de contração e grau de conversão de resina composta submetida a diferentes protocolos de fotoativação
O objetivo neste estudo foi avaliar a tensão de contração de polimerização e o grau de conversão de uma resina composta submetida a vários protocolos de fotoativação. O compósito Filtek Z350 foi inserido na perfuração central de um disco de resina fotoelástica e polimerizado usando uma unidade de fotoativação LED (BluePhase II - IvoclarVivadent) com as doses de energia de 12, 24 or 36 J/cm2 usando os seguintes protocolos de polimerização: contínuo de alta intensidade (HI: 1200 mW/cm2 durante 10, 20 ou 30s), contínuo de baixa intensidade (LI: 650 mW/cm2 durante 18, 36 ou54s) e "soft-start" (SS: 150 mW/cm2 durante 5 s + 1200 mW/cm2 durante 9, 19 ou 29s) (n=5). Análise fotoelástica e Espectroscopia Infravermelha Transformada de Fourier (FTIR) foram usados para avaliar a tensão de contração de polimerização e grau de conversão do compósito respectivamente. O teste ANOVA três fatores foi usado para determinar os principais efeitos e interações das variáveis e seguidamente, ANOVA 2 fatores para ver a diferença entre os grupos (p<0.05). A tensão de contração aumentou com valores maiores de energia. Não foram observadas diferenças estatisticamente significantes para a tensão de contração entre os modos de alta e baixa intensidade. O modo "soft-start" gerou menor tensão que os modos contínuos, exceto quando 12 J/cm2 foi aplicado. Similar grau de conversão foi observado para os modos de fotoativação usados, com exceção do modo "soft-start" com 12, 24 e 36 J/cm2 que mostraram níveis menores de conversão. A dose de energia e modo de ativação influenciam a tensão de contração de polimerização, porém nenhum benefício no grau de conversão foi observado.
Palavras chave: Resinas compostas; Análise de tensão; Polimerização.
INTRODUCTION
The use of resin composites has significantly increased in restorative dentistry due to the importance of their aesthetic, mechanical and physical properties. However, polymerization shrinkage is still an inevitable problem. It is the consequence of the conversion of Van Der Walls bonds into shorter covalent C-C bonds1. When the composite is adhered to the cavity walls, this shrinkage creates stresses that lead to problems on the interface of restoration2. Polymerization shrinkage stress is directly related to the degree and rate of conversion3. In addition, the clinical performance of composites depends on degree of conversion of the monomers in the material. Monomers conversion never achieve 100% and monomers which have not reacted remain within the polymer network, damaging the mechanical qualities of the restoration and are potentially toxic to surrounding tissues4. Better mechanical properties, chemical stability and longevity of the composite are associated to higher degrees of conversion5.
The rate of polymerization reaction control may increase the resin flow index, allowing stress release caused by polymerization shrinkage6. Different activation modes can influence the polymerization shrinkage stress and final properties of composites3, 7-10. Photoactivation techniques have been introduced with the aim of reducing the stress created during the polymerization process. In soft-start technique the activation begins with low intensity followed by a high intensity irradiation.11 One hypothesis for the use of this technique is that the initial low irradiance could allow easier stress relaxation since the material takes longer to reach rigidity. 8,12 However, the literature still discusses if these techniques can reduce the stress without compromising the monomers final conversion and their clinical benefits have not been proved10, 13, 14. Photoelastic analysis allows visualization of birefringent axis in photoelastic materials that coincides with main stress axis in the material15. The fringes created have precise mathematic bases that allow the evaluation of stresses and strains in the material16.
Faced with these findings, the aim of this study was to evaluate the polymerization shrinkage stress and degree of conversion of a resin composite material submitted to different photoactivation protocols, involving different activation modes and energy densities.
MATERIAL AND METHODS
The composite Filtek Z350 (3M-ESPE, St. Paul, MN, USA) was the resinous material elected for this study and the adhesive system SingleBond 2 (3MESPE, St. Paul, MN, USA) was used to improve the union of the composite to the photoelastic resin. The light source tested was the LED BluePhase II (IvoclarVivadent - Schaan, Liechtenstein) which presents three LED light sources and one that emits ultraviolet radiation.
Samples Preparation
Discs with 20 mm in diameter and 2 mm in thick, with a 6 mm diameter central orifice were made with Araldite GY 279/ Aradur 2963 resin (Araltec Chemical Products - SP, Brazil). Inner preparation surfaces of photoelastic resin discs were roughened by wear with a drill to improve the adhesion between photoelastic resin and composite. Discs were stored at 37°C for 24 hours to allow stress relief in the photoelastic resin. Before specimen preparation, the discs were placed in the photoelastic device to verify residual stress and if detected, they were stored in an oven at 37°C for more 24 hours until stress was completely released. The end surface of the light source was measured with a digital caliper (Mitutoyo, Japan) for area measurement (cm2). The power (mW) of the light was measured with Ophir 10A-V2-SH (Ophir Optronics, Har – Hotzvim, P.O.B. 45021, Jerusalem 91450, Israel). Then, the irradiance (mW/cm2) of light source was obtained and the density energy or power density was standardized through different exposition times. The energy density (J/cm2) is obtained from the irradiance multiplied by the time (seconds) and divided by 1000.
Araldite disc inner surfaces were treated with the adhesive system (SingleBond 2, 3M-ESPE, St. Paul, MN, USA) following the manufacturer's instructions. A bulk increment of composite was placed in the central orifice of photoelastic disc and polymerized using the LED-based curing unit (BluePhase II - IvoclarVivadent) using three different curing modes and three energy densities. Five specimens were prepared for each group (n=5) using the following photo-polymerization protocols: continuous high intensity (HI: 1200 mW/cm2 during 10, 20 or 30 s), continuous low intensity (LI: 650 mW/cm2 during 18, 36 or 54 s) and soft-start (SS: 150 mW/cm2 during 5 s + 1200 mW/cm2 during 9, 19, 29 s). The power density was standardized in 12, 24 or 36 J/cm2.
Optical Calibration
To obtain the photoelastic constant (Kó) of Araldite resin optical calibration was performed17. Briefly, a beam of photoelastic resin was loaded using the four- points bending method; this method produces stress patterns under pure bending, generating horizontal isochromatic fringes from a neutral axis on the center of the beam. According to the plot of 3Pa vs. h2N the mean coefficient value was Kó = 11271 N/m. Where P is the load applied to the beam (N), a is the length between beam supports (m), h is the beam cross-section height (m) and N the fringe order.
Photoelastic Analysis
Photoelastic images were recorded with a 2.1 megapixel digital camera (FD MAVICA, SONY, model MVC-FD97, Japan) immediately after light activation and 24 hours post-polymerization in a plane photoelastic device with the exact filter angulations (90 degrees) to obtain constant colored fringes. Fringes formed on photoelastic resin were qualitatively analyzed based on the stress optic law. Black and white images were taken to obtain constant light and dark fields on images. These images were used to analyze stresses quantitatively based on certain fundamental physical principles. To obtain shrinkage stress values (ó0) from the isochromaticdiameter rings the equation used was: ó0 = (Nx Dx 2 Kó)/(Di 2 2d), where: Nx is the isochromatic ring order; Dx 2 the isochromatic ring diameter (mm); Di 2 the disc preparation diameter (mm); Kó the photoelastic constant (N/mm) and d the Araldite disc thickness (mm). Polymerization shrinkage stress data (MPa) were calculated based on the location and diameter of the first order isochromatic ring obtained from Araldite discs, on monochromatic images. Three measurements of photoelastic fringe were made in standard directions (vertical, horizontal and diagonal) of each specimen image using the ImageJ software (National Institutes of Health - NIH, Maryland - USA). The mean fringe diameter was obtained and used in the above-mentioned photoelastic equation to calculate stress values of each specimen.
Degree of Conversion Measurements
Degree of conversion (DC) was measured by Fourier Transformation Infrared - FTIR (Prestige21; Shimadzu, Columbia, ML, USA). Using a metallic mold 4.5 mm diameter and 1 mm thick specimens were prepared with each of the photoactivation protocols. The uncured and cured samples of the composite were placed above a horizontal zinc crystal. Measurements were made immediately and 24 hours after photoactivation (n=5). Absorption spectra were recorded in a transmission mode using 16 scans at a resolution of 4 cm-1. The ratio of maximum absorption was determined using the baseline method considering the peaks of 1638 cm-1 for aliphatic and 1608 cm-1 for aromatic chains. The degree of conversion was calculated from the equivalent aliphatic/aromatic molar ratio from polymerized (P) and unpolymerized (U) samples using the formula:
DC (%) = (1-P/U) x 100.
Statistical Analysis
The normal distribution and equality of variance assumptions were checked in the variables. In the first step, polymerization shrinkage stress and degree of conversion data were analyzed by three-way ANOVA considering 3 power densities , 3 activation modes and 2 times to determine the significance of main effects and their interactions. In a second step, separate analysis for each time was performed by means of two-way ANOVA. The level of significance was set for P<0.05.
RESULTS
Fig. 1 shows most representative photoelastic fringes formed by dental composite polymerization shrinkage stress: minimum stress (1A), medium stress (1B) and maximum stress (1C) observed among the groups tested. The images showed that polymerization shrinkage stress increased with higher values of power density. Slight differences could be noticed between high and low intensity modes of activation. Soft-start method generated less stress considering all of the tested power densities. Considering polymerization shrinkage stress, threeway ANOVA revealed significant effect (p<0.05) of all factors. Only the photoactivation mode*energy density interaction was statistically significant (p<0.05).
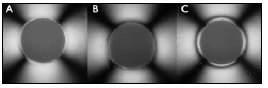
Fig. 1: Representative photoelastic fringes formed by dental composite polymerization shrinkage stress: minimum stress (1A), medium stress (1B) and maximum stress (1C) observed among the groups tested.
The distribution and median of polymerization shrinkage stress values immediately and after 24 hours are shown in Fig. 2. Statistical tests showed that the polymerization shrinkage stress was similar when 12 and 24 J/cm2 were applied on composite immediately after the photo-activation. The 36 J/cm2 power density created the highest stress values in both times evaluated. When 12 J/cm2 was used, there were no statistical differences between the three activation modes immediately after polymerization, but after 24 hours soft-start and low intensity modes showed values of stress lower than those found with the high intensity mode. Immediately after photoactivation, the composites that received 24 J/cm2 presented statistical significant differences on stress values between low intensity and soft-start modes with the lowest values for the latter. After 24 hours, the stress was comparable for all activation modes. Softstart mode had the lowest stress values when 36 J/cm2 of energy was applied on the photo-activation. In 24 hours, the stress created by high intensity mode was higher than for low intensity and soft-start modes.

Fig. 2: Charts box plot of polymerization shrinkage stress immediately and 24 hours after different power density and photoactivation modes. *Different capital letters compare different energy density. Different lowercase letters compare different curing modes (p<0.05).
Table 1 shows mean and standard deviation values (SD) for polymerization shrinkage stress immediately after photoactivation and after 24 hours for all activation modes tested. No statistical differences between times were observed for continuous high intensity mode and high energy density groups. Fig. 3 shows the distribution and median of composite degree of conversion immediately and 24 hours after photoactivation. No statistical differences were found among the three energy dose tested (p>0.05). Soft-start photoactivation mode showed lowest values of conversion for all energy doses tested (p<0.05) and no significant differences were found between high and low continuous activation modes.
Table 1: Mean (standard deviation) for polymerization shrinkage stress values immediately after photoactivation and after 24 hours for all activation modes tested (MPa).
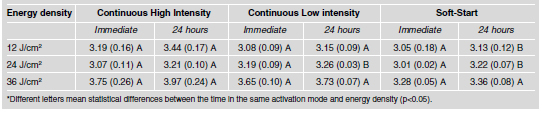

Fig. 3: Charts box plot of degree of conversion immediately and 24 hours after different power density and photoactivation modes. * Different capital letters compare different energy density. Different lowercase letters compare different curing modes (p<0.05).
DISCUSSION
As a consequence of the methacrylate matrix polymerization, the composite material undergoes a fast temperature and shrinkage increase18. Curing contraction is a complex process involving many interdependent factors: the number of covalent bonds formed3, the nature of the initial monomers, the ratio, size, and type of fillers19; the concentration of photoinitiators20, and the light energy supplied5, 21, 22. Polymerization shrinkage can create destructive stresses when the material is bonded to cavity walls12. Degree of conversion measurements helped to better understand and explain polymerization shrinkage stress results.
Polymerization stresses of light-curing polymerbased material are influenced by the amount of energy delivered to the material during irradiation23. The control of polymerization rates seems to allow the flow of resin composite during curing and consequently minimize polymerization shrinkage stress24. This can be done by polymerization at low power density followed by final cure at high power density12. Besides, when a reduction of the shrinkage rate of the composite is obtained, the effect is a reduction of stress developed into the restorative material locally25. Our results showed that soft-start curing mode showed lower stress rates of composite tested when high light energies densities (24 and 36 J/cm2) were applied. It has been claimed that slower polymerization causes an improved flow of molecules in the material, decreasing the polymerization shrinkage stress in a restoration8. In addition, at a constant energy density, pulse-delay curing reduced the bonding strength of resin composite to dentin compared to continuous curing26. Although, light modulation at the beginning of the photoactivation provides low shrinkage stress, low rates of degree of conversion were also observed. This is in accordance with other study 13 that also reported reduction on hardness of composites after ethanol storage13, 27.
Considering polymerization shrinkage stress, softstart curing technique did not show differences from continuous techniques tested when 12 J/cm2 was applied. During the polymerization process, thermal variation can be observed into the composite, and the temperature developed may increase stresses into the material if no time is allowed to dissipate thermal energy28. The low amount of energy may have created less alteration in the composite temperature and consequently stress differences between the curing techniques could not be noticed. Moreover, according to Dewaele et al.29, comparisons of the continuous and the stepped mode of photo-activation are ambiguous. Those authors attribute this to the fact that, in the step-cure mode, power density of the first step has effects on degree of conversion and on density of cross-linking in the opposite direction. When high power density is used, two phenomena can occur: higher concentrations of radicals that rapidly react with each other are produced, thus yielding premature termination and resulting in lower degree of conversion; or a multitude of growth centers are created, increasing the tendency to form a branched polymer (higher crosslink density). On the other side, a lower power density in the first step proportionally yields higher efficiency of the radicals initiated and this results in a delayed termination of polymerization and in higher degree of conversion. But lower power density would lead to relatively few growth centers, and a relatively linear polymer will be formed. Also, soft curing polymerization can result in reduced shrinkage stress levels and keep the degree of conversion and mechanical properties constant7.
At a constant energy density, high and low intensity continuous modes showed similar degree of conversion and polymerization stress by photoelastic analysis. The LED unit used in this study provided power energy of 650 mW/cm2 when low intensity mode was used, which the literature considers medium-high power intensity23, 30, 31 and this amount of energy was sufficient to satisfactory polymerize the composites and achieve similar levels of conversion of the group that receive the high (1200 mW/cm2) light energy; this is in accordance with Dewaele et al.29. Since polymerization shrinkage stress is directly related to degree of conversion3, this could be an explanation for the comparable stresses found.
The energy density is not only related to the degree of conversion, but also with the elastic modulus and the glass transition temperature (Tg); the higher energy density applied to the material, the higher are elastic modulus and Tg29. The visco-elastic properties, such as polymerization shrinkage, polymerization reaction rate and modulus of elasticity are very important in the pattern of shrinkage stress32. The results of this study showed that polymerization with 36 J/cm2 energy presented higher stress than with 12 and 24 J/cm2. Despite the same composite was used for all curing modes in this study, the higher energy density can make the material achieve a higher degree of conversion and Tg values29, and consequently could lead to higher stress levels. In addition, new generations of the LED units emit high-power blue light, which may cause higher temperature rise due to the light irradiation33. To achieve 36 J/cm2 the exposure time of the light source was increased and this may have caused greater increase in temperature than in the samples that received less exposition time and energy. Given the amount and the thickness of resin to be cured, temperature and shrinkage rate during the light curing polymerization can raise when the power output is increased depending on the quality of the emitted light spectra28. This could explain the higher stresses observed when 36 J/cm2 energy was applied to start the composite cure. The use of high energy densities results in an unfavorable relationship between degree of conversion and contraction stress34. In this study, no difference on degree of conversion was observed among the different energy densities applied; probably a satisfactory conversion of the composite was achieved with 12 J/cm2. Also, as polymerization reaction occurs, the conversion rate decreases drastically as the material stiffness increases and restrict the mobility of monomers or growing polymer chains to continue the reaction making it difficult to increase conversion significantly, even using high energy densities35.
There was no difference in polymerization shrinkage stress when composite was photo-activated with 12 and 24 J/cm2. Both power energies seem to be appropriate to polymerize and create comparable conversion of the composite, and consequently no differences on polymerization shrinkage stress was found. The composite can be successfully polymerized at reduced light intensity, while the final conversion value remains high28. Despite that, after 24 hours for the high intensity continuous activation, when 12 J/cm2 of energy was applied the stress was higher than the other modes; although this could not be observed with 24 J/cm2 of energy density. It is known that degree of conversion of composites is directly related to polymerization shrinkage stress created on the wall that composite is bonded.3 In addition, thermal stress can reduce the effectiveness of dentin adhesives36. Probably the energy provided to composite when 24 J/cm2 was applied created high stresses after 24 hours that were able to disrupt the bond between composite and photoelastic discs walls but the evaluation of integrity of this interface was not a goal on this study. Within 24 hours, differences between the curing modes were observed when 36 J/cm2 of energy density was applied. Continuous high intensity mode created higher stresses than continuous low intensity mode, and soft-start mode showed lower stress rates. One explanation can be that huge thermal contraction force is evident using high power curing unit and shows a steep stress contraction as the light is switched off 34 and this may become more evident after 24 hours. Also, the polymerization contraction is only totally completed after 24 hours of composite activation37, and this can help to explain the differences between polymerization modes were more evident after 24 hours. According to Li et al.38, polymerization shrinkage followed by Young's modulus of the composite are the most important factors in the development of residual stresses. Also, decreasing the viscosity and polymerization rate could reduce the residual stresses in the top section of the restoration, but not those in deeper locations.
Considering the same energy and activation mode, polymerization shrinkage stress of the composite increased after 24 hours only for the continuous low intensity (24 J/cm2) and soft-start curing modes (12 and 24 J/cm2). Properties of light-cured composite are strongly dependent on both the energy dose and the duration of the dark reaction process25. Nevertheless the stress created during the other curing modes did not show statistical differences between stress values immediately and at 24 hours. The degree of conversion achieved by the composites cured with high power and energy density minutes after the activation did not significantly change within 24 hours and no changes in stress levels could be noticed. Also, no differences on degree of conversion were observed with the time, this can be explained because the monomer conversion achieves a maximum value and after that point no significant changes can be observed34, 35.
CONCLUSION
Within the limitations of this study, it can be concluded that polymerization shrinkage stress is significantly influenced by energy density increase. Soft-start curing mode can create lower stress levels if the energy density of 24 and 36 J/cm2 were applied. Stress levels of the composite tested are similar minutes after activation and within 24 hours when the higher power energy and irradiance were applied. No benefits on degree of conversion were observed by increasing the energy density.
1. Atai M, Watts DC, Atai Z. Shrinkage strain-rates of dental resin-monomer and composite systems. Biomaterials 2005; 26:5015-5020. [ Links ]
2. Davidson CL. Handling the polymerization stresses - Restorative Dentistry in resin-based restorative materials. Dental News 2000;7:9-13. [ Links ]
3. Braga RR, Ferracane JL. Contraction stress related to degree of conversion and reaction kinetics. J Dent Res 2002;81:114-118. [ Links ]
4. Arikawa H, Kanie T, Fujii K, Ban S; Takahashi H. Light-attenuating effect of dentin on the polymerization of light-activated restorative resins. Dent Mater J 2004;23:467-473. [ Links ]
5. da Silva EM, Almeida GS, Poskus LT, Guimarães JG. Relationship between the degree of conversion, solubility and salivary sorption of a hybrid and nanofilled resin composite: influence of the light-activation mode. J Appl Oral Sci 2008;16:161-166. [ Links ]
6. Tarle Z, Meniga A, Ristic M, Sutalo J, Pichler G, Davidson CL. The effect of photopolymerization method on the quality of composite resin samples. J Oral Rehabil 1998; 25:436-442. [ Links ]
7. Ilie N, Kunzelmann KH, Visvanathan A, Hickel R. Curing behavior of a nanocomposite as function of polymerization procedure. Dent Mater J 2005;24:469-477. [ Links ]
8. Lim BS, Ferracane JL, Sakaguchi RL, Condon JR. Reduction of polymerization contraction stress for dental composites by two-step light-activation. Dent Mater 2002; 18:436-444. [ Links ]
9. Lu H, Stansbury JW, Bowman CN. Impact of curing protocol on conversion and shrinkage stress. J Dent Res 2005; 84:822-826. [ Links ]
10. Visvanathan A, Ilie N, Hickel R, Kunzelmann KH. The influence of curing times and light curing methods on the polymerization shrinkage stress of a shrinkage-optimized composite with hybrid-type prepolymer fillers. Dent Mater 2007;23:777-784. [ Links ]
11. Stansbury JW. Curing dental resins and composites by photopolymerization. J Esthet Dent 2000; 12:300-308. [ Links ]
12. Braga RR, Ballester RY, Ferracane JL. Factors involved in the development of polymerization shrinkage stress in resin-composites: A systematic review. Dent Mater 2005; 21:962-970. [ Links ]
13. Asmussen E, Peutzfeldt A. Two-step curing: influence on conversion and softening of a dental polymer. Dent Mater 2003;19:466-470. [ Links ]
14. Soh MS, Yap AU. Influence of curing modes on crosslink density in polymer structures. J Dent 2004;32:321-326. [ Links ]
15. Ernst CP, Meyer GR, Klöcker K, Willershausen B. Determination of polymerization shrinkage stress by means of a photoelastic investigation. Dent Mater 2004;20:313-321. [ Links ]
16. Ainola L, Aben H. Principal formulas of integrated photoelasticity in terms of characteristic parameters. J Opt Soc Am A Opt Image Sci Vis 2005;22:1181-1186. [ Links ]
17. Vazquez-Rodríguez JM, Herrera-Franco PJ, Gonzalez-Chi PI. Micromechanical analysis of thermoplastic– thermoset interphase. Macromol Symp 2004;216:117-130.
18. De Santis R, Gloria A, Prisco D, Amendola E, Puppulin L, Pezzotti G, et al. Fast curing of restorative materials through the soft light energy release. Dent Mater 2010; 26:891-900. [ Links ]
19. Gonçalves F, Kawano Y, Braga RR. Contraction stress related to composite inorganic content. Dent Mater 2010; 26:704-709. [ Links ]
20. Pfeifer CS, Ferracane JL, Sakaguchi RL, Braga RR. Photoinitiator content in restorative composites: influence on degree of conversion, reaction kinetics, volumetric shrinkage and polymerization stress. Am J Dent 2009;22:206-210. [ Links ]
21. Labella R, Lambrechts P, Van Meerbeek B, Vanherle G. Polymerization shrinkage and elasticity of flowable composites and filled adhesives. Dent Mater 1999;15:128-137. [ Links ]
22. Mortier E, Simon Y, Dahoun A, Gerdolle D. Influence of curing mode with a LED unit on polymerization contraction kinetics and degree of conversion of dental resin-based materials. J Dent Child 2009;76:149-155. [ Links ]
23. Takamizawa T, Yamamoto A, Inoue N, Tsujimoto A, Oto T, Irokawa A, et al. Influence of light intensity on contraction stress of flowable resins. J Oral Sci 2008; 50:37-43. [ Links ]
24. Charton C, Colon P, Pla F. Shrinkage stress in light-cured composite resins: Influence of material and photoactivation mode. Dent Mater 2007;23:911-920. [ Links ]
25. De Santis R, Gloria A, Sano H, Amendola E, Prisco D, Mangani F, et al. Effect of light curing and dark reaction phases on the thermomechanical properties of a Bis-GMA based dental restorative material. J Appl Biomater Biomech 2009;7:132-140. [ Links ]
26. Benetti AR,. Asmussen E, Peutzfeldt A. Influence of curing rate of resin Composite on the bond strength to dentin. Oper Dent 2007;32:144-8. [ Links ]
27. Brandt WC, de Moraes RR, Correr-Sobrinho L, Sinhoreti MA, Consani S. Effect of different photo-activation methods on push out force, hardness and cross-link density of resin composite restorations. Dent Mater 2008;24:846-850. [ Links ]
28. Tarle Z, Knezevic A, Demoli N, Meniga A, Sutaloa J, Unterbrink G, et al. Comparison of composite curing parameters: èffects of light source and curing Mode on conversion, temperature rise and polymerization shrinkage. Oper Dent 2006;31:219-226. [ Links ]
29. Dewaele M, Asmussen E, Peutzfeldt A, Munksgaard EC, Benetti AR, Finné G, et al. Influence of curing protocol on selected properties of light-curing polymers: Degree of conversion, volume contraction, elastic modulus, and glass transition temperature. Dent Mater 2009; 25:1576-1584. [ Links ]
30. Maghaireh G, Bouschlicher MR, Qian F, Armstrong SR. The effect of energy application sequence on the microtensile bond strength of different C-factor cavity preparations. Oper Dent 2007;32:124-132. [ Links ]
31. Oto T, Yasuda G, Tsubota K, Kurokawa H, Miyazaki M, Platt JA. Influence of power density on polymerization behavior and bond strengths of dual-cured resin direct core foundation systems. Oper Dent 2009;34:192-199. [ Links ]
32. Sakaguchi RL, Wiltbank BD, Murchison CF. Contraction force rate of polymer composites is linearly correlated with irradiance. Dent Mater 2004;20:402-407. [ Links ]
33. Atai M, Motevasselian F. Temperature rise and degree of photopolymerization conversion of nanocomposites and conventional dental composites. Clin Oral Investig 2009; 13:309-316. [ Links ]
34. Calheiros F, Braga RR, Kawano Y, Ballester RY. Relationship between contraction stress and degree of conversion in restorative composites. Dent Mater 2004;20:939-946. [ Links ]
35. Halvorson RH, Erickson RL, Davidson CL. Energy dependent polymerization of resin-based composite. Dent Mater 2002;18:463-469. [ Links ]
36. Soh G, Henderson LJ. Effect of thermal stress on dentin adhesives used individually and in combination. Clin Mater 1990; 6:57-64. [ Links ]
37. Leprince JG, Lamblin G, Devaux J, Dewaele M, Mestdagh M, Palin WM, et al. Irradiation modes' impact on radical entrapment in photoactive resins. J Dent Res 2010; 89: 1494-1498. [ Links ]
38. Li J, Li H, Fok SL. A mathematical analysis of shrinkage stress development in dental composite restorations during resin polymerization. Dent Mater 2008; 24:923-931. [ Links ]

