


Servicios Personalizados
Revista

Articulo
 Inglés (pdf)
 Articulo en XML
 Referencias del artículo
 Enviar articulo por email
Indicadores
-
 Citado por SciELO
Links relacionados
-
 Similares en
SciELO
Similares en
SciELO
Compartir

 Permalink
Acta Odontológica Latinoamericana
versión On-line ISSN 1852-4834
Acta odontol. latinoam. vol.30 no.2 Buenos Aires ago. 2017
ARTÍCULO ORIGINAL
Morphological characteristics of the facial bone wall related to the tooth position in the alveolar crest in the maxillary anterior
Características morfológicas de la tabla ósea vestibular en relación a la posición dentaria en la cresta alveolar en la zona anterior del maxilar superior
Hernán Bonta1, Nelson Carranza1, Ariel F. Gualtieri2, Mariana A. Rojas1
1 Universidad de Buenos Aires, Facultad de Odontología, Cátedra de Periodoncia, Argentina.
2 Universidad de Buenos Aires, Facultad de Odontología, Cátedra de Biofísica, Argentina.
ABSTRACT
The purpose of this study was to analyze whether the position of the tooth in the alveolar ridge influences the thickness of the facial bone wall and the distance between the cemento-enamel junction (CEJ) and osseous zenith (OZ).
Cone-beam computed tomography (CBCT) scans from fifty four dentate patients were included in the study (22 male and 32 female, mean age 41. 5 years). The measurements taken included: (1). The Facial bone thickness at 7 different equidistant levels -measuring levels (ML 1-7) - between OZ and the root apex (A). (2) The CEJ -OZ distance. (3) Facial position of the tooth (FPT) relative to a straight line traced from mesial to distal interproximal depressions of the alveolar plate at the level of the CEJ.
The Facial bone wall thickness ranged between 0 mm and 3. 8 mm, with greater values at more apical levels. Mean values were smaller than 1 mm at every level except ML7. The CEJ-OZ distance varied between 0. 5 mm and 6. 9 mm (mean 2. 9 mm). The Mean of FPT value was 0. 6 mm.
No statistically significant correlation was found between FPT and the CEJ-OZ distance. Weak negative statistically significant correlations were found between FPT and the thickness of the facial bone wall at MP1 and MP3.
Within the limits of this study, no clinically relevant correlation between FPT and facial bone thickness - CEJ-OZ distance was found.
More studies should be conducted to evaluate a greater number of teeth, especially those that may present misalignment with greater FPT values.
Key words: Alveolar bone; Computed tomography; Maxilla.
RESUMEN
El objetivo del presente estudio fue analizar si la posición de la pieza dentaria en el reborde alveolar influencia el espesor de la tabla ósea vestibular y la distancia entre el limite amelo-cementario (LAC) y el cenit óseo (CO).
Tomografías computadas haz de cono (TC) de 54 pacientes dentados fueron incluidas en el estudio (22 hombres y 32 mujeres, edad promedio 41. 5 años). Las medidas registradas fueron: (1) espesor de la tabla ósea vestibular en 7 diferentes niveles de medición (NM1-7) entre CO y el ápice radicular (AR). (2) La distancia LAC-CO. (3) Posición vestibular de la pieza dentaria (PVD) en relación a una línea recta trazada desde la depresión interproximal mesial a la depresión interproximal distal de la tabla ósea a nivel del LAC.
El espesor de la tabla ósea vestibular fue 0-3. 8mm, con valores mayores registrados a nivel más apical. El valor promedio fue menor a 1 mm excepto en NM7. La distancia LAC-CO varió entre 0. 5 y 6. 9mm (promedio 2. 9mm). El promedio de PVD fue de 0. 6mm.
No se encontró correlación estadísticamente significativa entre la PVD y la distancia LAC-CO. Se halló una correlación débil negativa estadísticamente significativa entre la PVD y el espesor de la tabla ósea vestibular en NM1 y NM3.
Dentro de las limitaciones de este estudio, no se encontró una correlación clínicamente significativa entre PVD y espesor de la tabla ósea vestibular - distancia LAC-CO.
Se deben llevar a cabo más estudios para evaluar un mayor número de piezas dentarias, especialmente aquellas que se encuentran desalineadas con valores PVD mayores.
Palabras clave: Hueso alveolar; Tomografía computada; Maxilar.
INTRODUCTION
Implant placement in the anterior maxilla presents a considerable challenge to clinicians because of patients' high esthetic expectations. The thickness of the facial bone wall in this region is of crucial importance for selecting the appropriate treatment approach.
A number of studies have demonstrated that dimensional changes occurs on the alveolar process following tooth extraction and that they are more pronounced on the buccal aspect. 1-4 This difference in the healing outcome may be related to the fact that the buccal wall is thinner than its palatal counterpart. 5
It has been suggested that immediate implant placement into extraction sockets should prevent the resorption process of the buccal bone plate6, but this has not been supported by findings from experiments in dogs7-9 or by clinical trials4. In addition, the degree of facial reduction has been shown to depend on the dimension of the buccal bone wall. 10
It is important to consider that after implant bed preparation, the facial bone should ideally be at least 2 mm thick to ensure proper soft tissue support and prevent resorption of the facial bone wall following restoration. 11-13
It has been suggested that for a successful esthetic outcome, the implant should be placed in an ideal three-dimensional position14 in order to maintain adequate buccal bone15 and tissue biotype. 16 Since correct implant placement requires proper understanding of the anatomy of the anterior region, diagnostic imaging data are essential. The thickness of the facial bone wall17 and the position of the osseous zenith18 are two important variables for determining the most suitable treatment approach. Cone-beam computed tomography (CBCT) is currently the preferred tool formeasuring the thickness of bone plate. 19,20 Several studies have examined facial bone wall thickness, and although they found statistically significant results, they usually took few reference points (2 to 4) from the cemento-enamel junction (CEJ)17,21-25, often resulting in missing information about thicknesses at more points of the tooth.
The purpose of this retrospective study was to analyze whether the facial position of the tooth in the alveolar ridge influences the thickness of the facial bone wall and the distance between the CEJ and OZ.
Our hypothesis is that the more facial the position of the tooth, the thinner the facial bone wall and the greater the CEJ-OZ distance will be.
Additional purposes were to describe the bone thickness on the facial aspect of the anterior maxilla at seven equidistant measuring levels (ML) and to measure the CEJ-OZ distance.
MATERIALS AND METHODS
The present study included all CBCTs from patients referred to the Department of Periodontics, University of Buenos Aires, Buenos Aires, Argentina for implant therapy from August to December 2015. Inclusion criteria were: 1) systemically healthy patients, 2) no contraindications for performing the treatment, 3) patients having all upper front teeth in the mouth at the time of the study - 13 to 23, 4) teeth without any injury or completely healthy in their tooth structure .
Exclusion criteria were: 1) patients with active periodontal disease or history of periodontal disease, 2) patients with bone loss related to upper anterior area or with soft tissue recession, 3) patients who had received orthodontic treatment, 4) patient tomography with scattered or distorted images, 5) teeth that had received apical surgery or with root resorption and 6) patients who had received surgical treatment of any kind in the anterior upper area.
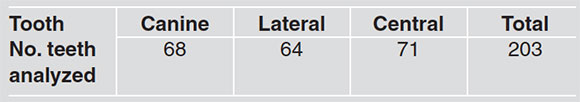
A total 54 CBCTs met the inclusion criteria, providing a sample size of 203 teeth (Table 1).
Table 1: Total number and position of analyzed teeth.
All patients in the study accepted the clinical procedures and signed the informed consent approved by FOUBA Ethics Committee.
Radiographic image analysis
The CBCT images were analyzed on a certified monitor. Slice orientation was adjusted to pass through the center of the examined tooth perpendicular to its long axis (Fig. 1). The long axis of the tooth dictated the orientation of the vertical slice.
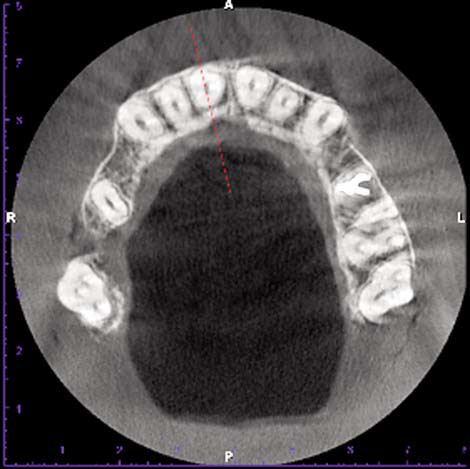
Fig. 1: Slice location in the center of the respective root, perpendicular to the alveolar ridge.
To perform the measurements, sagittal scans from the reconstructed data showing the entire root and the CEJ of the examined tooth were displayed, with the largest zooming factor possible for the respective images.
Image analysis was performed by image processing software. The studies were performed with a 3D cone-beam volume CT (Promax 3D, Planmeca, Finland). Images were analyzed through the Romexis Viewer 2. 0. 3 program (Romexis Viewer 2. 0. 3. R, Planmeca, Finland).
First, total root length (L)was measured from the osseous zenith (OZ) to the apex (A). This distance was divided into seven equidistant levels for measuring the thickness of the facial bone wall at each point (measuring levels 1-7 ML1-7) (Fig. 2). CEJ-OZ distance was also measured (Fig. 2).

Fig. 2: Measurement of facial bone wall thickness and CEJOZ distance. *CEJ = estimated position of the cementoenamel junction; L: (OZA) = length of root (osseous zenithapex) ; ML 17 = measuring levels 17.
To assess the facial position of the tooth (FPT), a straight line was determined from the facial mesial to the facial distal depressions of the interproximal alveolar crest. The shortest distance was measured between the mid-facial point of the tooth at the CEJ level and the abovementioned line(Fig. 3).
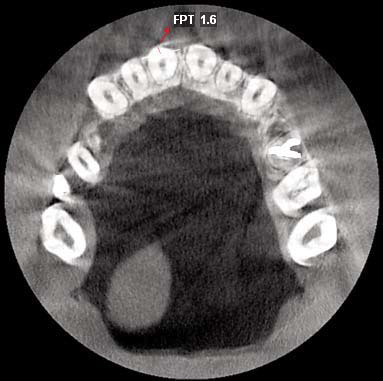
Fig. 3: Measurement of the facial position of the tooth (FPT) *FPT =Facial position of the tooth.
All measurements were taken by a single examiner who was blinded to the clinical findings and the follow-up of the included patients. A preliminary training and calibration session on 20 CBCT revealed an intra-class coefficient of correlation > 0. 75.
Statistical analysis
Quantitative variables were described by the sample size (n), minimum, medium, maximum, mean and standard deviation (SD).
The relationship between quantitative continuous variables was analyzed using the Spearman correlation test (Spearman coefficient: p). Pearson's correlation test was not performed because the normality assumption was not met.
To compare quantitative variables between groups, the Kruskal-Wallis test was performed, followed by peer group comparisons when a significant result was obtained. One-way ANOVA was not performed because assumptions of normality and homogeneity
of variance were not met. The assumptions of normality and homogeneity of variance were tested by the Shapiro-Wilk test with modifications and Levene, respectively. A statistically significant result was considered when the p-value was less than 0. 05. The 2014 version Infostatsoftware was used. 26
RESULTS
The sample consisted of 54 subjects (22 males, 32 females) with mean age 41. 5 years (range 18-65). Distribution of the analyzed teeth is presented in Table 1.
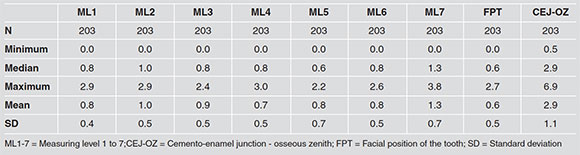
Mean thickness of facial bone wall at different levels was 1mm or less, except at ML7 (mean 1. 3 mm). Mean facial position of the tooth in the alveolar crest (FPT) was 0. 6 mm (range 0. 0 mm -2. 7 mm). The distance between the CEJ and the OZ ranged from 0. 5 mm to 6. 9 mm (mean 2. 9 mm) (Table 2). Vertically, no statistically significant correlation was found between the FPT and the CEJ-OZ vertical distance (Spearman coefficient p: 0. 132; p value: 0. 0595).
Table 2: Thickness (mm) of the facial bone wall at seven measuring levels (ML 1-7), CEJ-OZ distance and FPT values.
Horizontally, weak negative statistically significant correlations were found between FPT and facial bone wall thickness at ML1 and ML3. At the other measuring levels (ML2, ML4, ML5, ML6, ML7) no statistically significant correlation was found (Table 3).
Table 3: Correlation between FPT and thickness of facial bone wall (ML 1-7). Variable 1 Variable 2 n p

Facial bone wall thickness at ML1 and ML3 was correlated with FPT values (Fig. 4 and 5).
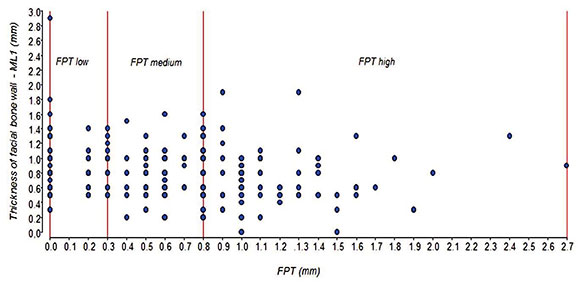
Fig. 4: Relationship between thickness of facial bone wall at ML1 and FPT. The red vertical lines indicate the limits for the grouping of values FPT at low, medium and high. *ML1 =Measuring level 1; FPT =Facial position of the tooth.
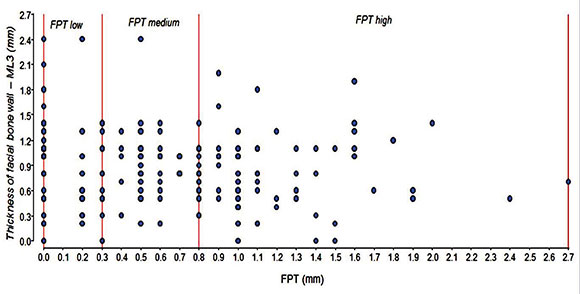
Fig. 5: Relationship between thickness of facial bone wall at ML3 and FPT.The red vertical lines indicate the limits for the grouping of values FPT at low, medium and high. *ML3 =Measuring level 3; FPT =Facial position of the tooth.
These values were grouped into low, medium and high categories according to the following parameters:
• Low: FPT between 0 mm and 0. 3 mm.
• Medium: FPT greater than 0. 3mm and equal to or smaller than 0. 8 mm.
• High: FPT greater than 0. 8 mm and equal to or smaller than 2. 7 mm.
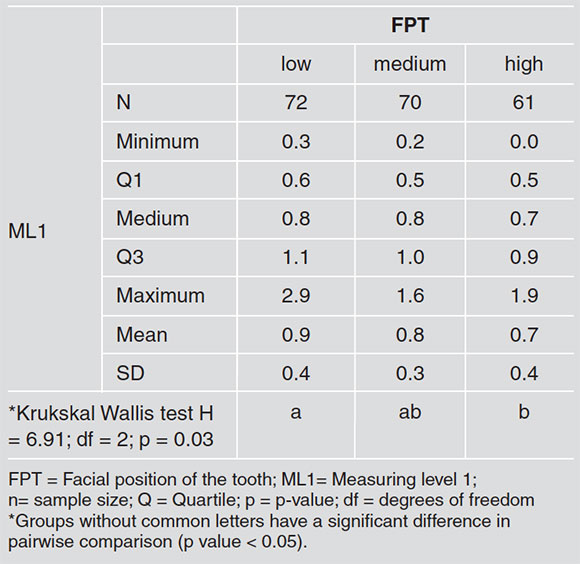
Facial bone wall thickness at measuring level 1 (ML1) varied significantly among the three groups of FPT (Kruskal-Wallis test: H = 6. 91; df = 2; p = 0. 03). Specifically, pair-wise comparisons showed significant differences between the groups with low and high values of FPT: facial bone thickness wall at ML1 was higher in the group with low FPT values (Fig. 6, Table 4). No significant difference was found for facial bone wall thickness at ML3 compared among low, medium and high FPT values (Kruskal-Wallis test: H = 1. 88; df = 2; p = 0. 386).
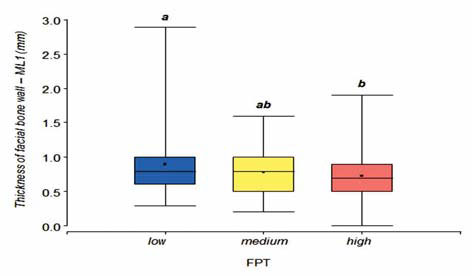
Fig. 6: Thickness of facial bone wall at ML1 and grouped values of FPT. *ML1 =Measuring level 1; FPT =Facial position of the tooth.
Table 4: Comparison between ML1 and low, medium and high values of FPT.
DISCUSSION
Several experimental and clinical studies have shown that underlying bone structure plays a role in the establishment and maintenance of esthetic soft tissue contours14,27-29. It is of clinical interest to examine the facial bone wall dimensions of teeth scheduled for extraction, especially those that are to be replaced with implants.
Data concerning the thickness of the facial bone wall in the anterior maxilla could aid in designing a more accurate treatment plan. Brauntet al. 17 evaluated the thickness of the facial bone wall in 498 teeth. They concluded that the facial bone wall in the anterior maxilla was either missing or thin in roughly 90. 0% of patients.
Januario et al. 21 evaluated the CEJ- facial bone crest distance and the facial bone thickness at three different levels (1, 3 and 5 mm apical to the crest), finding that it ranged from 1. 6 to 3 mm, and that the facial bone wall thickness in most locations was 1 mm or less. Similar results were reported by El Nahass and Naiem, 24 who analyzed the CEJ-alveolar crest distance and the thickness of facial bone wall at 1, 2 and 4 mm to the alveolar crest, finding that 73% of the incisors had a thin facial bone wall (0. 5mm-1 mm).
In the present study, CBCT images were utilized to measure facial bone wall thickness and the cementoenamel junction - osseous zenith distance. We prefer to use the term osseous zenith rather than alveolar crest. Osseous zenith was described in a previous study18 as "the bone crest that gives support to the gingival zenith, establishing its location as the nearest portion of bone tissue underlying the gingival zenith".
Considering that the position of the tooth in the alveolar ridge could influence the thickness of the facial bone wall and the CEJ-OZ distance, the current study analyzed an important parameter that was not evaluated in previous studies17,21-25 : the facial position of the tooth (FPT). Moreover, the thickness of the facial bone wall was measured at seven apico-coronal levels in order to provide a more exhaustive morphological description of the bone wall, considering that previous studies did not take more than four measurements.
The results of the present study were in agreement with those reported in the literature. 17,21-25 Mean values for facial bone wall thickness were smaller than 1 mm at every level except ML7. In general, greater values were found at more apical levels. The CEJ-OZ distance ranged from 0. 5 to 6. 9 mm (mean 2. 9 mm) and the facial position of the tooth values ranged from 0. 0 to 2. 7 mm (mean 0. 6 mm). Interestingly, no statistically significant correlation was found between FPT and the CEJ-OZ distance, and weak negative correlations were found between FPT and the thickness of the facial bone wall at ML1 and ML3. This could be due to the fact that all teeth examined were fairly aligned to the alveolar arch. Within the limits of this study, although no clinically relevant correlation was found between facial position of the tooth and facial bone thickness -distance CEJ-OZ, it would seem reasonable to conclude that the facial position of the tooth could be an important variable to consider when facial bone wall thickness is evaluated.
Further studies should be conducted evaluating a greater number of teeth, especially those that may present misalignment with greater FPT values, to determine particularly thin and vulnerable bony walls and to evaluate whether a significant correlation emerges among all these parameters.
CORRESPONDENCE
Dra. Mariana A. Rojas
Cátedra de Periodoncia, Facultad de Odontología, UBA Marcelo T. de Alvear 2142, 17° A, Buenos Aires, Argentina rojasmarianaandrea@gmail.com
1. Pietrokovski J, Massler M. Alveolar ridge resorption following tooth extraction. J ProsthetDent 1967; 17: 21-27. [ Links ]
2. Schropp L, Wenzel A, Kostopoulos L, Karring T. Bone healing and soft tissue contour changes following singletooth extraction: a clinical and radiographic 12-month prospective study. Int J Periodontics Restorative Dent 2003; 23: 313-323. [ Links ]
3. Pietrokovski J, Starinsky R, Arensburg B, Kaffe I. Morphologic characteristics of bony edentulous jaws. J Prosthodont 2007; 16: 141-147. [ Links ]
4. Sanz M, Cecchinato D, Ferrus J, Pjetursson, EB, Lang NP, Lindhe J. A prospective, randomized- controlled clinical trial to evaluate bone preservation using implants with different geometry placed into extraction sockets in the maxilla. Clin Oral Implants Res 2010 21: 13-21. [ Links ]
5. Araujo MG, Lindhe J. Dimensional ridge alterations following tooth extraction. An experimental study in the dog. J Clin Periodontol 2005; 32: 212-218. [ Links ]
6. Paolantonio M, Dolci M, Scarano A, D'Archivio D et al. Immediate implantation in fresh extraction sockets. A controlled clinical and histological study in man. J Periodontol 2001; 72: 1560-1571. [ Links ]
7. Araujo MG, Sukekava F, Wennstrom JL, Lindhe JL. Ridge alterations following implant placement in fresh extraction sockets: an experimental study in the dog. J Clin Periodontol 2005; 32: 645-652. [ Links ]
8. Araujo MG, Sukekava F, Wennstrom JL, Lindhe J. Tissue modeling following implant placement in fresh extraction sockets. Clin Oral Implants Res 2006; 17: 615-624. [ Links ]
9. Araujo MG, Sukekava F, Wennstrom JL, Lindhe J. Modelling of the buccal and lingual bone walls of fresh extraction sites following implant installation. Clin Oral Implants Res 2006; 17: 606-614. [ Links ]
10. Tomasi C, Sanz M, Cecchinato D, Pjetursson B, et al. Bone dimensional variations at implants placed in fresh extraction sockets: a multivariate analysis. Clin Oral Implants Res 2010; 21: 30-36. [ Links ]
11. Grunder U, Gracis S, Capelli M. Influence of the 3-D bone-to-implant relationship on esthetics. Int J Periodontics Restorative Dent 2005; 25: 113-119. [ Links ]
12. Buser D, Martin WD, Belser UC. Surgical considerations with regard to single-tooth replacements in the esthetic zone: Standard procedure in sites without bone defiencies. In: Buser D, Belser U, Wismeijer D (Eds). ITI Treatment Guide, Vol 1: Implant Therapy in the Esthetic Zone-Single-n Tooth Replacements. Berlin: Quintessence, 2006: 26-37. [ Links ]
13. Belser UC. Replacement of an upper left persisting deciduous canine with a regular neck implant, restored with a ceramometal crown, horizontally screw-retained. In: Buser D, Belser U, Wismeijer D (Eds). ITI Treatment Guide, Vol 1: Implant Therapy in the Esthetic Zone-Single-Tooth Replacements. Berlin: Quintessence, 2006: 159-177. [ Links ]
14. Buser D, Martin W, Belser UC. Optimizing esthetics for implant restorations in the anterior maxilla: anatomic and surgical considerations. Int J Oral Maxillofac Implants 2004; 19(Suppl): 43-61. [ Links ]
15. Grunder U, Gracis S, Capelli M. Influence of the 3-D bone-to-implant relationship on esthetics. Int J Periodontics Restorative Dent 2005; 25: 113-119. [ Links ]
16. Chen ST, Darby IB, ReynoldsEC. A prospective clinical study of non-submerged immediate implants: clinical outcomes and esthetic results. Clin Oral Implants Res 2007; 18: 552-562. [ Links ]
17. Braut V, Bornstein MM, Belser U, Buser D. Thickness of the anterior maxillary facial bone wall-a retrospective radiographic study using cone beam computed tomography. Int J Periodontics Restorative Dent 2011; 31: 125-131. [ Links ]
18. Carranza N, Bonta H, Gualtieri AF, Rojas MA, Galli FG, Caride F. Alveolar dimensional changes relevant to implant placement after minimally traumatic tooth extraction with primary closure. The osseous zenith concept and its displacement. Acta Odontol Latinoam 2016; 105-114. [ Links ]
19. Loubele M, Van Assche N, Carpentier K. Comparative localized linear accuracy of smalleld cone-beam CT and multislice CT for alveolar bone measurements. Oral Surg Oral Med Oral Pathol Oral Radiol Oral Endod 2008; 105: 512-518. [ Links ]
20. Menezes C, Janson G. Reproducibility of bone plate thickness measurements with cone-beam computed tomography using different image acquisition protocols. Dent Press J Orthodontics 2010; 15: 143-149. [ Links ]
21. Januario AL, Duarte WR, Barriviera M, Mesti JC, et al. Dimension of the facial bone Wall in the anterior maxilla: a cone-beam computed tomography study. Clin Oral Implants Res. 2011; 22: 1168-1171. [ Links ]
22. Shen JW, He FM, Jiang QH, Shan HQ. Measurement of facial bone wall thickness of maxillary anterior teeth and premolars on cone beam computed tomography images. Zhejiang Da XueXueBao Yi Xue Ban. 2012 41: 234-238. [ Links ]
23. Yang G, Hu WJ, Cao J, Liu DG. Measurement of sagittal root position and the thickness of the facial and palatal alveolar bone of maxillary anterior teeth. Zhonghua Kou Qiang Yi XueZaZhi. 2013 48: 716-720. [ Links ]
24. El Nahass H, N Naiem S. Analysis of the dimensions of the labial bone wall in the anterior maxilla: a cone-beam computed tomography study. Clin Oral Implants Res. 2015; 26: 57-61. [ Links ]
25. Wang HM, Shen JW, Yu MF, Chen XYetal. Analysis of facial bone wall dimensions and sagittal root position in the maxillary esthetic zone: a retrospective study using cone beam computed tomography. Int J Oral Maxillofac Implants. 2014 29: 1123-1129 [ Links ]
26. Di Rienzo JA, Casanoves F, Balzarini MG, Gonzalez L, et al. InfoStat versión 2014. Grupo InfoStat, FCA, Universidad Nacional de Córdoba, Argentina. URL: http://www.infostat.com.ar [ Links ]
27. Berglundh T, Lindhe J. Dimension of the periimplant mucosa. Biological width revisited. J Clin Periodontol 996; 23: 971-973. [ Links ]
28. Cochran DL, Hermann JS, Schenk RK, Higginbottom FL, et al. Biologic width around titanium implants. A histometric analysis of the implant-gingival junction around unloaded and loaded nonsubmerged implants in the canine mandible. J Periodontol 1997; 68: 186-198. [ Links ]
29. Kan JY, Rungcharassaeng K, Umezu K, Kois JC. Dimensions of peri-implant mucosa: An evaluation of maxillary anterior single implants in humans. J Periodontol 2003; 74: 557-562. [ Links ]

