


Servicios Personalizados
Revista

Articulo
 Articulo en XML
 Referencias del artículo
 Enviar articulo por email
Indicadores
-
 Citado por SciELO
Links relacionados
-
 Similares en
SciELO
Similares en
SciELO  uBio
uBio
Compartir

 Permalink
BAG. Journal of basic and applied genetics
versión On-line ISSN 1852-6233
BAG, J. basic appl. genet. vol.26 no.2 Ciudad Autónoma de Buenos Aires dic. 2015
ARTÍCULOS ORIGINALES
Genetic structure and demographic history of striped weakfish Cynoscion guatucupa (sciaenidae) from the southwestern atlantic
Estructura genética e historia demográfica de la pescadilla de red Cynoscion guatucupa (sciaenidae) del atlántico sudoccidental
Alonso M.P.1,2,*, Fernández Iriarte P.J.3
1 Facultad de Ciencias Exactas y Naturales, Universidad Nacional de Mar del Plata. Funes 3250 (7600), Mar del Plata, Argentina.
2 CONICET. Unidad Integrada Balcarce (FCA, UNMdP - EEA INTA Balcarce), CC 276, Balcarce (7620), Argentina.
3 IIMYC, Instituto de Investigaciones Marinas y Costeras, CONICET, Facultad de Ciencias Exactas y Naturales, Universidad Nacional de Mar del Plata. Funes 3250 (7600), Mar del Plata, Argentina.
* Author for correspondence firiarte@mdp.edu.ar
Fecha de recepción: 22/12/2014
Fecha de aceptación de versión final: 27/04/2015
ABSTRACT
In South America, the Pleistocene was characterized by important environmental changes related to glacial cycles, which had significant effects on the evolutionary history of several marine species. To evaluate the pattern of demographic history and the genetic structure of striped weakfish Cynoscion guatucupa, a 401 bp fragment of the mitochondrial Cytochrome b gene was sequenced from 92 individuals from three coastal areas in Argentina and one in Brazil in the southwestern Atlantic. Haplotype diversity was high, whereas nucleotide diversity was low among all sampling sites. The star-like pattern was not phylogeographically structured, in agreement with the AMOVA analysis. The Fu’s test was negative and highly significant whereas the mismatch analysis yielded an unimodal distribution indicating population expansion. The mutation rate of Cytochrome b, calibrated with pairs of species of Cynoscion found on both sides of the Isthmus of Panama was estimated at 0.006 substitutions per million years. The Bayesian skyline plot was used to date changes in population size through time and revealed a coalescence time of 155,000 years. Cynoscion guatucupa exhibited a mutation accumulation pattern associated with a rapid population growth after a period of low effective population size, probably linked to climatic changes in the late Pleistocene.
Key words: Genetic structure; Cytochrome b; Marine fish; Pleistocene; Mutation rate.
RESUMEN
Durante el Pleistoceno se registraron en Sudamérica importantes cambios climáticos relacionados con ciclos de glaciaciones que probablemente han tenido efectos significativos en la historia evolutiva de muchas especies marinas. Para evaluar el patrón de demografía histórica y la estructura genético poblacional de la pescadilla de red (Cynoscion guatucupa) se analizó una secuencia de 401 pb del Citocromo b del ADN mitocondrial de 92 individuos de tres áreas costeras en Argentina y una de Brasil en el Atlántico sudoccidental. La diversidad haplotípica fue alta y la diversidad nucleotídica fue baja para todos los sitios de muestreo. La topología en forma de estrella en base a los haplotipos mitocondriales muestra un patrón no estructurado geográficamente en concordancia con el análisis de AMOVA. El test de Fu fue negativo y altamente significativo, mientras que el análisis de mismatch distribution produjo una distribución unimodal, indicando expansión poblacional. La tasa de mutación del Citocromo b, calibrada a partir de la comparación de la divergencia entre especies del género Cynoscion encontrados en ambos lados del Istmo de Panamá fue estimada en 0,006 sustituciones por millón de años. Para datar el cambio del tamaño poblacional a través del tiempo se usó Bayesian Skyline Plot estimando un tiempo a la coalescencia de 155.000 años. Cynoscion guatucupa mostró un patrón de acumulación de mutaciones asociado a un rápido crecimiento poblacional luego de un cuello de botella, probablemente relacionado con un evento de cambio climático ocurrido en el Pleistoceno medio-tardío.
Palabras clave: Estructura genética; Citocromo b; Peces marinos; Pleistoceno; Tasa de mutación.
INTRODUCTION
Marine fish characterized by high dispersal usually display a weak phylogeographic structure (Avise, 1987); isolation by distance only occurs at large geographical scales (Matschiner et al., 2010). This pattern is associated with the general absence of dispersive barriers as well as with the high level of spatial connectivity among environments (Grant and Bowen, 1998). However, the climatic changes associated with glaciations produced variations in sea temperature, current changes and/or loss of coastal habitats, which played a key role in the evolutionary history of marine species (Hewitt, 2000; Rabassa et al., 2011). During the Pleistocene, 10,000 years - 2 million years ago, global glaciation cycles affected the genetic structure of terrestrial as well as of marine species (Hewitt, 2000). In South America, three major glaciations occurred in the last 250,000 years (Rabassa et al., 2005; 2011). These climatic changes in the southwestern Atlantic affected the distribution patterns and abundance of marine fishes. Earlier studies using mitochondrial DNA sequences (control region and Cytochrome b) in South American coastal fishes account for phylogeographic patterns that are not geographically structured in Cynoscion acoupa (Rodrigues et al., 2008), Macrodon ancylodon (Santos et al., 2006), Pagrus pagrus (Porrini et al., 2015) and Eleginops maclovinus (Ceballos et al., 2012) or with a moderate or low genetic structuring in Odontesthes argentinensis (Beheregaray and Sunnucks, 2001), Brevoortia aurea (García et al., 2008), Micropogonias furnieri (Pereira et al., 2009), and Paralichthys orbignyanus (Fernández Iriarte et al., 2014). Likewise, there is clear evidence of population expansion, in several cases, related to the climatic and geographic changes that took place in marine and coastal regions during the Pleistocene.
Striped weakfish Cynoscion guatucupa Cuvier 1830, is a widely spread demersal fish predominantly found on southwestern Atlantic coasts, ranging from Rio de Janeiro, Brazil (22° S), to Chubut province, Argentina (43° S). It inhabits coastal areas and part of the continental shelf, and is found in sea and estuarine waters, being typically caught in Brazil, Uruguay and Argentina (Cousseau and Perrotta, 2004). Argentine landings are from catches made from two main fishing areas: the Argentine-Uruguayan Common Fishing Zone (34° S to 39° S), and the southern area of Buenos Aires province (El Rincón, 39° S to 41° S), being the second most important species (Ruarte et al., 2004). Earlier studies focusing on Argentine samples of C. guatucupa and using the mitochondrial Control Region postulate that there is no pattern of genetic structure among Argentinean populations, though an historical population expansion would have occurred (Sabadin et al., 2009; Fernández Iriarte et al., 2011). The objectives of this study were: (i) to analyze C. guatucupa genetic structure using Cytochrome b marker across its distribution in the southwestern Atlantic, including a sample from Brazil (reaching most of the species distribution), (ii) to calibrate the mutation rate for this mitochondrial gene fragment using this data set, and (iii) to infer the main historical demographic events in the species.
MATERIALS AND METHODS
Sampling, DNA extraction, PCR amplification and sequencing Samples of muscle tissue kept in ethanol were obtained from adult individuals caught in El Rincón (39° S; 61° W) (n= 25), Mar Chiquita (37° S; 57º W) (n= 21), and Samborombón (36° S; 56° W) (n= 28) on Buenos Aires province coast (Argentina) and in Ubatuba (23º S; 45º W) (n= 18) on the Brazilian coast (Figure 1). Specimens were obtained from local fishermen and/or from landing samplings collected from different ports. DNA was extracted using Chelex 100 method (Estoup et al., 1996). A small muscle piece of each individual (100-150 mg) was incubated with 500 µl of Chelex 100 at 10 % solution and 25 µl of Proteinase K (20 µg/µl) for 1 hour at 56 ºC followed by 100 ºC for 15 min. The amplification of a partial fragment of Cytochrome b (Cyt b) was conducted using primers Glu-L-CP and CB2-H (Aboim et al., 2005). PCR conditions using 50 µl reaction volumes were: 5 µl of 10× buffer, 3.6 µl of Cl2Mg (25 mM), 5 µl of each primer (200 mM), 6 µl of dNTPs (100 mM), 1 µl of Taq polymerase (5 U/µl), and 5 µl of genomic DNA. The reaction volume was completed with water. PCR was performed in a GeneAmp PCR system 2700 thermocycler (Applied Biosystems) at 94 °C for 4 min, followed by 30 cycles at 94 °C for 50 s, 50 °C for 30 s and 72 °C for 1 min, with a final extension of 72 °C for 5 min. The PCR product was purified and sequenced in MACROGEN Korea (http://www.macrogen.com/).

Figure 1. Study area and sampling sites of Cynoscion guatucupa from Southwestern Atlantic: 1, Ubatuba; 2, Samborombón; 3, Mar Chiquita; 4, El Rincón.
Population genetic analysis
Sequences were manually aligned using PROSEQ (Filatov, 2002). For each sampling site, haplotype (h) and nucleotide (ð) diversity were estimated using DNAsp v5 (Librado and Rozas, 2009). Likewise, to detect historical demographic changes, the D (Tajima, 1989) and Fs (Fu, 1997) neutrality tests were calculated to discriminate mutation/drift equilibrium and to evaluate the hypothesis of population expansion through the significant excess of low-frequency haplotypes. These parameters were calculated using ARLEQUIN 3.11 (Excoffier et al., 2005). Mismatch distribution was also estimated with DNAsp, and it was compared with the distribution expected under a model of sudden population expansion. Deviations from the model were evaluated by calculating the R2 index (Ramos-Onsins and Rozas, 2002). Those populations that have undergone large expansion are expected to exhibit unimodal mismatch distributions with a low R2 value; while stable populations produce a variety of multimodal distributions with a high R2 index. The significance of D, Fs and R2 indices was evaluated on 10,000 simulations. The genetic structure of C. guatucupa was assessed by the Analysis of Molecular Variance (AMOVA), and pairwise genetic distances were estimated to assess fixation indices (FST) among all population pairs (10,000 permutation) in ARLEQUIN. The haplotype median-joining network was constructed using Network 4.6 (Bandelt et al., 1999).
Molecular clock and coalescence time
The pair of Cynoscion species found on both sides of the Isthmus of Panama has evolved in isolation for about 3.5 million years (Coates et al., 1992), and could be used to calibrate the molecular clock (Bermingham and Lessios, 1993). Hence, by comparing the variations within and among Cynoscion genus species for Cyt b sequence (Vergara- Chen et al., 2009), less biased estimates of the mutation rate could be calculated, and historical demographic changes occurring in the glaciations could be inferred with greater precision. Cyt b sequences were obtained from GenBank for C. reticulatus Günther, 1864 (GQ220005.1), C. nothus Holbrook, 1848 (GQ220006.1), C. phoxocephalus Jordan and Gilbert, 1882 (GQ220010.1) and C. leiarchus Cuvier, 1830 (GQ219999.1). The molecular clock was calculated from the sequences of Cynoscion genus using Kimura 2-parameter distance (Kimura, 1980). Expansion time was directly estimated from mismatch distribution with the statistic ô (tau) and translated into absolute time in years (t), using the equation t = ô/2µk, where µ is the mutation rate per year and k is the number of nucleotides of the sequence analyzed. Confidence intervals for t estimates were obtained using a parametric bootstrap approach in ARLEQUIN. On the other hand, the substitution model of Cyt b in C. guatucupa was determined using jModelTest 0.1.1 (Posada, 2008) and, based on such model, expansion time was calculated using the Bayesian Skyline Plot (BSP) in BEAST (Drummond and Rambaut, 2007). BSP analysis was performed using a relaxed molecular clock, with three runs of 10 million steps (MCMC) each, where trees and parameters were sampled every 1,000 steps. The fact that the ESS values estimated with Tracer were > 200 (Drummond et al., 2012) allowed determining that the two independent runs converged on the same distribution in the MCMC run. Only one of the three runs was plotted. To estimate coalescence time, the calibrated mutation rate was applied.
RESULTS
Molecular diversity, demography and network A 401 bp fragment of the mitochondrial Cyt b gene was sequenced for 92 individuals. Thirty one different haplotypes (GenBank Accession numbers KR086363- KR086393), 27 substitutions (22 transitions and 5 transversions) were observed. The average number of nucleotide differences between pairs of sequences (k) was 1.504 (Table 1). The molecular diversity patterns for all individuals revealed a haplotype diversity (h) (mean ± SD) = 0.822 ± 0.034 and a nucleotide diversity (ð) (mean ± SD) = 0.004 ± 0.003 (Table 1). Haplotype diversities decreased from South to North ranging from 0.903 ± 0.001 in RIN to 0.569 ± 0.018 in UBA, respectively. The statistical test of neutrality (D) was negative and significant for each site except for Samborombón when all samples were analyzed together; the Fu’s F was negative and statistically significant in all sites and at a total level (Table 1). The global mismatch analysis yielded a unimodal distribution curve (Figure 2) associated with the low R2 value (R2 = 0.026, P <0.05). The network of Cyt b haplotypes displayed no evidence of a phylogeographic structure and showed a star-like pattern with two highly represented central haplotypes, differentiated from each other by a single mutation step (Figure 3). AMOVA indicated that the largest genetic variation was within groups and not among them (F ST = -0.011, df = 3, 88, P = 0.81). Additionally, no significant f ST values (P > 0.05) were noticed among site pairs: UBASAM (FST = -0.013), UBA-MCH (FST = -0.010); UBARIN (FST = -0.007), SAM-MCH (FST = -0.010), SAMRIN (FST = -0.010) and MCH-RIN (FST = -0.014).
Table 1. Genetic diversity and demographic parameter for 401 bp fragment of the mitochondrial Cyt b gene from Cynoscion guatucupa in Ubatuba (UBA), Samborombón (SAM), Mar Chiquita (MCH) and El Rincón (RIN): sample size (n), number of haplotypes (NH), number of polymorphic sites (NP), average number of nucleotide differences between pairs of sequences (k), haplotype diversity (h); nucleotide diversity (ð), Tajima’s D, Fu’s Fs and R2.


Figure 2. Mismatch distribution (observed values: closed squares; expected values: open circles). R2 (raggedness index), * P < 0.05.
Mutation rate, Tau and BSP
Regarding C. reticulatus - C. nothus sequences, the genetic distance was of 0.052 and for C. phoxocephalus - C. leiarchus, it was of 0.034, thereby yielding a mean genetic distance of 0.043 between species. A mutation rate of 1.2 % between species of the Cynoscion genus was estimated on the basis of such distance. Given the fact that the mutation rate within lineages is half the rate between lineages (Bowen et al., 2006), a mutation rate of 0.6 % per million years was established.
The t (tau) parameter, in turn, was 1.55 (confidence interval, a = 0.050: 1.15-1.99), estimating the expansion time at 320,000 (230,000-410,000) years ago. The substitution rate of Cyt b using Akaike information criterion was adjusted to the Hasegawa, Kishino and Yano model (HKY) more the proportion of invariable sites (I). BSP, using a mutation rate of 0.006 substitutions per million years, revealed a significant reduction in population size followed by an expansion about 155,000 years ago (Figure 4). Moreover, for BSP construction, confidence intervals for estimates of this marker in several fish species (1-1.8 %) (Pfeiler et al., 2008) were used. These substitution rates of 0.009 substitutions per million years (maximum) and 0.005 substitutions per million years (minimum), yielded coalescence values ranging from 105,000 to 185,000 years, respectively (Figure 4).
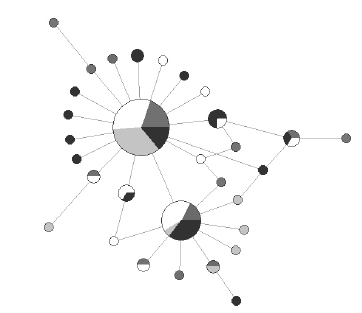
Figure 3. Mitochondrial DNA network of Cyt b sequences for Cynoscion guatucupa. Circle size is proportional to haplotype frequency in each sample site: Ubatuba (light grey), Samborombón (white), Mar Chiquita (dark grey) and El Rincón (black), respectively. Line length is proportional to the number of mutations separating the haplotypes (one or two mutations in this case).

Figure 4. BSP based on mitochondrial Cyt b haplotypes. The y axis represents the product of the effective population size (Ne) and generation length (t) in a log scale. The black solid lines are median estimates under the assumed mutation rate of 0.006 substitutions per million years, and the dotted lines indicate 95 % highest density regions. The thin top solid line shows the median obtained under the mutation rate of 0.005, while the thin bottom line depicts the median obtained under the assumption of a mutation rate of 0.009.
DISCUSSION
The absence of a genetic structure across C. guatucupa distribution in the southwestern Atlantic may be explained by the fact that this species is characterized by high dispersal and weak barriers to gene flow. Population expansion, estimated by means of the substitution rate of Cyt b, showed demographic processes of low population size after one of the largest Pleistocene glaciations. AMOVA indicated absence of genetic differentiation among sampling sites but most genetic variation among the Cyt b haplotypes was distributed within sites. These results are consistent with those accounted for by Sabadin et al. (2009), which found no differences in two microsatellite loci in individuals from Samborombón and El Rincón. The same result was achieved in the study conducted for the mtDNA control region (Fernández Iriarte et al., 2011), which reported lack of genetic structuring among Samborombón, El Rincón and Mar Chiquita. The absence of the genetic differentiation is evident in the haplotype and low nucleotide diversities of Cynoscion guatucupa characterize species that have undergone a historical bottleneck, followed by population expansion with accumulation of mutations (Type 2; Grant and Bowen, 1998). This pattern was observed in species not genetically structured as C. guatucupa (Fernández Iriarte et al., 2011), Eleginops maclovinus (Ceballos et al., 2012) and Pagrus pagrus (Porrini et al., 2015). On the contrary, it is considered that those species with low haplotype and nucleotide diversity have undergone a recent bottleneck or founder effect (Type 1, Grant and Bowen, 1998). This pattern was observed in species such as M. furnieri (Pereira et al., 2009) and P. orbignyanus (Fernández Iriarte et al., 2014).
The molecular diversity values are also consistent with the unimodal distribution curve and, together with the low R2 value and the negative Fs values, could indicate that the species underwent demographic expansion. The starting period of population expansion differs depending on the method. The value calculated from t was of 320,000 years (240,000-410,000) and from BSP, of 155,000. Despite the fact that it has been suggested that ô tends to underestimate coalescence time, this parameter is very sensitive to mismatch curve variations; thus, small variations could have a great effect on expansion time estimates (Schneider and Excoffier, 1999). Another point in this regard is the heterogeneity of the substitution rate along the analyzed sequence and its relevance when expansion time is calculated. . In view of the fact that BSP uses the substitution model under which the sequence mutates to calculate population expansion, the value obtained would be more representative. The data obtained from BSP for Cyt b (155,000 years) is in agreement with that estimated for the mtDNA control region (190,000 years; Fernández Iriarte et al., 2011). In this sense, changes in population size estimated with Cyt b associate better with the Quaternary climatic changes with a population expansion time that would correspond to the end of the most extensive glaciation event recorded in the last 250,000 years (140,000-180,000 years ago) (Ruzzante et al., 2008). Recent studies using Cyt b in the Patagonian blennie fish Eleginops maclovinus Cuvier and Valenciennes 1830, from the southwestern Atlantic estimate a coalescence of 125,000 years (Ceballos et al., 2012), also associated with the end of such cold period.
The substitution rate of Cyt b in fishes was five to ten times lower than that of the control region (Bargelloni et al., 2003), while in C. guatucupa this value was 8.3 times network, in which no genetic structure is observed and individuals from all sites share common haplotypes. This pattern is common in many marine fish species given their life history, characterized by high dispersal and absence of natural barriers (Zane et al., 2006; Pfeiler et al., 2008). When evaluating the individuals from the different sampling sites, no qualitative differences were observed in the molecular diversity values analyzed (h and ð) taking, for both cases, a high h (> 0.5) and a low ð (< 0.005) as a cut-off point (Grant and Bowen, 1998). Pi (ð) values, both at a global and at each sampling site level, were similar and low, while h values were high but showed a pattern of decreasing variability from South (RIN) to North (UBA). The sample from Ubatuba represents the most northern distribution of the species with temperatures that could represent a less favorable habitat. The high haplotype smaller. In general, the mean mutation rate of the estimated control region was 0.05 substitutions per million years (Bowen et al., 2006; Ruzzante et al., 2008; Fernández Iriarte et al., 2011). In this sense, the mutation rate reported here, calibrated by the divergence between species, increases the reliability of the estimated times, and is consistent with that used for other fish groups, being very similar to that applied to Cyt b in E. maclovinus (0.0056), in line with the fossil record. Even though the real starting period of population expansion may be slightly different, present data suggests that the glacial period could have been particularly relevant for the distribution and abundance of marine species in the southwestern Atlantic.
ACKNOWLEDGEMENTS
The authors wish to thank two anonymous reviewers who improved the previous versions of this manuscript. This work was financially supported by “Universidad Nacional de Mar del Plata” under grants 15/E534 and 15/E627 and “Comisión Nacional de Investigaciones Científicas” under grant PIP 2504 and 0798.
BIBLIOGRAPHY
1. Aboim M.A., Menezes G.M., Schlitt T., Rodgers A.D. (2005) Genetic structure and history of populations of the deep-sea fish Helicolenus dactylopterus (Delaroche, 809) inferred from mtDNA sequences analysis. Mol. Ecol. 14: 1343-1354. [ Links ]
2. Avise J.C., Arnold J., Ball M., Bermingham E., Lamb T., Neigell J.E., Reebl C.A., Saunders N.C. (1987) Intraspecific phylogeography: the mitochondrial DNA bridge between population genetics and systematics. Annu. Rev. Ecol. Syst. 18: 489-522. [ Links ]
3. Bandelt H.J., Forster P., Röhl A. (1999) Median-joining networks for inferring intraspecific phylogenies. Mol. Biol. Evol. 16: 37-48. [ Links ]
4. Bargelloni L., Alarcon J.A., Alvarez M.C., Penzo E., Magoulas A., Reis C., Patarnello T. (2003) Discord in the family Sparidae (Teleostei): divergent phylogeographical patterns across the Atlantic-Mediterranean divide. J. Evol. Biol. 16: 1149-1158. [ Links ]
5. Beheregaray L.B., Sunnucks P. (2001) Fine-scale genetic structure, estuarine colonization and incipient speciation in the marine silverside fish Odontesthes argentinensis. Mol. Ecol. 10: 2849-2866. [ Links ]
6. Bermingham E., Lessios H.A. (1993) Rate variation of protein and mitochondrial DNA evolution as revealed by sea urchins separated by the Isthmus of Panama. Proc. Natl. Acad. Sci. U.S.A. 90: 2734-2738. [ Links ]
7. Bowen B.W., Muss A., Rocha L.A., Grant W.S. (2006) Shallow mtDNA Coalescence in Atlantic Pygmy Angelfishes (genus Centropyge) indicates a recent invasion from the Indian Ocean. J. Hered. 97: 1-12. [ Links ]
8. Ceballos S.G., Lessa E.P., Victorio M.F., Fernández D.A. (2012) Phylogeography of the sub-Antarctic notothenioid fish Eleginops maclovinus: evidence of population expansion. Mar. Biol. 159: 499-505. [ Links ]
9. Coates A., Jackson J., Collins L., Cronin T., Dowsett H., Bybell L., Jung P., Obando J. (1992) Closure of the Isthmus of Panama: the near shore marine record of Costa Rica and western Panama. Geological Soc. of Amer. Bull. 104: 814-828. [ Links ]
10. Cousseau M.B., Perrotta R.G. (2004) Peces marinos de Argentina. Biología, distribución y pesca. Instituto Nacional de Investigación y Desarrollo Pesquero, Mar del Plata, Argentina. [ Links ]
11. Drummond A., Rambaut A. (2007) BEAST: Bayesian evolutionary analysis by sampling trees. BMC Evol. Biol. 7: 214. [ Links ]
12. Drummond A., Suchard M.A., Xie D., Rambaut A. (2012) Bayesian phylogenetics with BEAUti and the BEAST 1.7. Mol. Biol. Evol. 29: 1969-1973. [ Links ]
13. Estoup A., Largiadèr C.R., Perrot E., Chourrout D. (1996) Rapid one-tube DNA extraction for reliable PCR detection of fish polymorphic markers and transgenes. Mol. Mar. Biol. and Biotechnol. 5: 295-298. [ Links ]
14. Excoffier L., Laval G., Schneider S. (2005) ARLEQUIN ver. 3.0. An integrated software package for population genetics data analysis. Evol. Bioinformatics 1: 47-50. [ Links ]
15. Fernández Iriarte P.J., Alonso M.P., Sabadin D.E., Arauz P.A., Iudica C.M. (2011) Phylogeography of weakfish Cynoscion guatucupa (Perciformes: Sciaenidae) from the southwestern Atlantic. Sci. Mar. 75: 701-706. [ Links ]
16. Fernández Iriarte P.J., Fainburg L., Porrini L., Alonso M.P., Sabadin D. (2014) Genética, filogeografía y conservación de peces del Atlántico suroccidental. Primer Congreso Latinoamericano de Genética para la Conservación, 5-9 de Mayo 2014, Macuto, Vargas, Venenezuela; p. 28. [ Links ]
17. Filatov D.A. (2002) ProSeq: A software for preparation and evolutionary analysis of DNA sequence data sets. Mol. Ecol. Notes 2: 621-624. [ Links ]
18. Fu Y.X. (1997) Statistical tests of neutrality of mutations against population growth, hitchhiking and background selection. Genetics 147: 915-925. [ Links ]
19. García G., Vergara J., Gutiérrez V. (2008) Phylogeography of the Southwestern Atlantic menhaden genus Brevoortia (Clupeidae, Alosinae). Mar. Biol. 155: 325-336. [ Links ]
20. Grant W.S., Bowen B.W. (1998) Shallow population histories in deep evolutionary lineages of marine fishes: insights from sardines and anchovies and lessons for conservation. J. Hered. 89: 415-426. [ Links ]
21. Hewitt G. (2000) The genetic legacy of the Quaternary ice ages. Nature 405: 907-913. [ Links ]
22. Kimura M. (1980) A simple method for estimating evolutionary rates of base substitutions through comparative studies of nucleotide sequences. J. Mol. Evol. 16: 111-120. [ Links ]
23. Librado P., Rozas J. (2009) DNAsp v.5: A software for comprehensive analysis of DNA polymorphism data. Bioinformatics 25: 1451-1452. [ Links ]
24. Matschiner M., Hanel R., Salzburger W. (2010) Phylogeography and speciation processes in marine fishes and fishes from large freshwater lakes. In: Rutgers D.S. (Ed.) Phylogeography. Nova Science Publishers, New York, pp. 1-29. [ Links ]
25. Pereira A.N., Marquez A., Marin M., Marin Y. (2009) Genetic evidence of two stocks of the whitemouth croaker Micropogonias furnieri in the Rio de la Plata and oceanic front in Uruguay. J. Fish Biol. 75: 321-331. [ Links ]
26. Pfeiler E., Watts T., Pugh J., van der Heiden A.M. (2008) Speciation and demographic history of the Cortez bonefish, Albula sp. A (Albuliformes: Albulidae), in the Gulf of California inferred from mitochondrial DNA. J. Fish Biol. 73: 382-394. [ Links ]
27. Porrini L., Fernández Iriarte P.J., Iudica C., Aristizabal Abud E. (2015) Population genetic structure and body shape assessment of Pagrus pagrus (Perciformes: Sparidae) from Buenos Aires coast of the Argentine Sea. Neotr. Ichth. In press. [ Links ]
28. Posada D. (2008) JModelTest: Phylogenetic Model Averaging. Mol. Biol. Evol. 25: 1253-1256. [ Links ]
29. Rabassa J., Coronato A.M., Salemme M. (2005) Chronology of the Late Cenozoic Patagonian glaciations and their correlation with biostratigraphic units of the Pampean region (Argentina). J. South Am. Earth Sci. 20: 81-103. [ Links ]
30. Rabassa J., Coronato A.M., Martínez O. (2011) Late Cenozoic Glaciations in Patagonia and Tierra del Fuego: an updated review. Biol. J. Linn. Soc. 103: 316- 335. [ Links ]
31. Ramos-Onsins S.E., Rozas J. (2002) Statistical properties of new neutrality tests against population growth. Mol. Biol. Evol. 19: 2092-2100. [ Links ]
32. Rodrigues R., Schneider H., Santos S., Vallinoto M., Sain-Paul U., Sampaio I. (2008) Low levels of genetic diversity depicted from mitochondrial DNA sequences in a heavily exploited marine fish (Cynoscion acoupa, Sciaenidae) from the Northern coast of Brazil. Gen. Mol. Biol. 31: 487-492. [ Links ]
33. Ruarte C., Lasta C., Carozza C. (2004) Pescadilla de red (Cynoscion guatucupa). In: Boschi E. (Ed.) El Mar Argentino y sus recursos pesqueros, vol. 4, Instituto Nacional de Investigación y Desarrollo Pesquero, Mar del Plata, Argentina, pp. 271-281. [ Links ]
34. Ruzzante D.E., Walde S.J., Gosse J.C., Cussac V.E., Habit E., Zemlak T.S., Adams E.D.M. (2008) Climate control on ancestral population dynamics: insight from Patagonian fish phylogeography. Mol. Ecol. 17: 2234-2244. [ Links ]
35. Sabadin D.E., González Castro M., Iudica C., Díaz de Astarloa J.M., Fernández Iriarte P.J. (2009) Morphometric and genetic assessment of the Cynoscion guatucupa population structure from Buenos Aires coast, Argentine Sea. Rev. Biol. Mar. Oceanogr. 45: 513-517. [ Links ]
36. Santos S., Hrbek T., Farias I.P., Schneider H., Sampaio I. (2006) Population genetic structuring of the king weakfish, Macrodon ancylodon (Sciaenidae), in Atlantic coastal waters of South America: deep genetic divergence without morphological change. Mol. Ecol. 15: 4361-4373. [ Links ]
37. Schneider S., Excoffier L. (1999) Estimation of past demographic parameters from the distribution of pairwise differences when the mutation rates vary among sites: application to human mitochondrial DNA. Genetics 152 (3): 1079-1089. [ Links ]
38. Tajima F. (1989) The effect of change in population size on DNA polymorphism. Genetics 123: 597-601. [ Links ]
39. Vergara-Chen C., Aguirre W.E., González-Wangüemert M., Bermingham E. (2009) A mitochondrial DNA based phylogeny of weakfish species of the Cynoscion group (Pisces: Sciaenidae). Mol. Phylogenet. Evol. 53: 602-607. [ Links ]
40. Zane L., Marcato S., Bargelloni L., Bortolotto E., Papetti C., Simonato M., Varotto V., Patarnello T. (2006) Demographic history and population structure of the Antarctic silverfish Pleuragramma antarcticum. Mol. Ecol. 15: 4499-4511. [ Links ]

